The neutron log records counts of the collisions between neutrons that radiate from a tool source and hydrogen atoms within the rock of the borehole wall. So, the log is mainly a measure of hydrogen concentration (mostly contained by the pore fluids of the formation). Older neutron logs are recorded in counts that require conversion to porosity units either by calibration to units of known porosity within the logged section or by reconciliation with cored samples from the same well. Newer neutron logs are scaled directly in units of porosity (Figure 4). Shales appear to have high porosities on the neutron log, mostly because of bound water, rather than effective porosity. However, porosities recorded in shale-free sandstones are a reasonable estimate of pore spaces that contain water that can be produced in a well.
Figure 4. Neutron porosity log from KGS Jones #1. Note that porosity increases from right to left. A "limestone scale" is normally, because oil exploration targets below the Dakota are usually limestone. Actual prosoities in the sandstones will be about 3% higher. The porosity reflects "free" water in the sandstones, but bound water in the shales.

The density log is a measure of apparent density of the rock and is computed from the absorption of gamma rays emitted from a tool radioactive source by the formation. An example of a density log run in the Dakota is shown in Figure 5. The density of quartz is about 2.65 grams per cubic centimeter, and that of water is approximately 1.0. These two values correspond to the density of a sandstone with zero porosity and a hypothetical sandstone with a porosity of 100%. The two limits can be used to convert the density scale to values of equivalent porosity units. On more recent density logs, a supplementary curve of the photoelectric factor is also recorded, and is a useful measure of formation mineralogy.
Figure 5. Density log from KGS Jones #1 recorded in grams per cc (upper scale) and an equivalent sandstone scale (lower scale). Newer density logs commonly have a photoelectric factor curve which is a useful lithology discriminator.

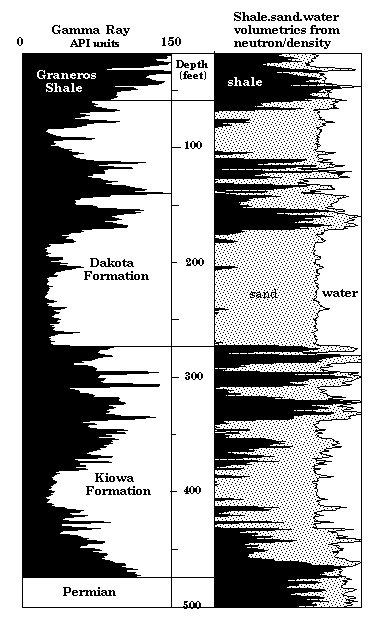
It is common to see both the neutron and density logs recorded on the same logging run and shown as an "overlay" on a common scale of equivalent limestone porosity units (see Figure 6). The overlay allows shales, sandstones, and other lithologies to be distinguished and a better estimate to be made of the true porosity of the formation at any depth. The log overlay has sufficient information to be converted to a profile that graphically shows shale content and volume of effective pore space (Figure 7). Notice that the overall shale composition estimated from the density-neutron log combination is similar to shale indicated by the gamma ray log. but there are also systematic differences. The reason is, that while both measurements are sensitive to shale content, the gamma ray log responds to the natural radioactivity of the shale, while the neutron-density logs are influenced by the bound water and density of the shales.
Figure 6. Neutron and density logs from KGS Jones #1 overlaid on a common equivalent limestone scale. The overlay allows the log analyst to recognize lithologies and read values of true porosity in zones of interest.

Figure 7. Volumetric summary of shale, quartz, and pore space indicated by gamma-ray and lithodensity-neutron logs from KGS Jones #1. Note that shale estimation by the gamma-ray log is based on natural radioactivity and shows slight differences with shales from the lithodensity and neutron logs which are based on shale bound water and density characteristics.

The third type of porosity estimate is computed from measurements of the speed of ultrasonic sound through the formation. The sonic tool has a mechanical source of compressional energy that radiates sound through the rock formation in the borehole wall. The log records the acoustic velocity of the rocks as a trace which is shown as a continuous function of depth. The log is measured as transit time in units of microseconds per foot. Sound travels faster in rocks with low amounts of contained fluids than those with higher contents of fluid. This physical relationship can be used to compute the porosity of a sandstone at any depth, by interpolating the measured value at any depth between the expected value of quartz (55.5 microseconds per foot) and that of water (189 microseconds per foot) as extremes of a porosity scale of zero to 100% porosity.
The sonic log is widely used by geophysicists to create synthetic seismograms for comparison with field records of seismic reflections from lines shot close to the well. Observations from drill-cuttings and logs at the well site allow the geology in the borehole section to be established. Therefore, reflection events on the synthetic seismogram can be tagged with specific rock formations and used as a key to identify reflections on field records. Some exploratory seismic field studies were made by Coyle (1990) to determine what units in the stratigraphic section that contains the Dakota Aquifer could be resolved as distinct reflections and whether seismic shooting could be used in exploration for thick Dakota sandstones. For more information, see the section on Seismic records and the synthetic seismogram.
Previous page--Gamma-ray Log ||
Next page--SP Log
Dakota Home ||
Petrophysics Intro Page