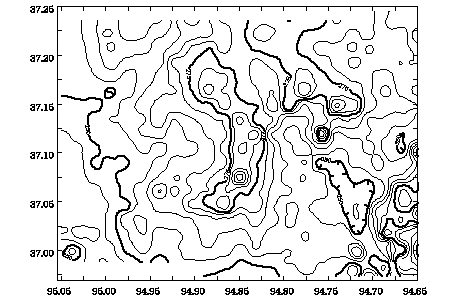
Topographic maps show variations in the elevation of a land surface. The contour lines connect lines of equal elevation. The contours also describe the land form. Areas of tightly spaced contour lines describe steep changes in elevation, whereas areas of very few contours portray flat areas. Other commonly used contour maps include weather maps showing temperature values as bands of color (temperature lines are called isotherms) or barometric pressure as contour lines (called isobars).
The map shown above is a contour map of small changes in gravity values in southeastern Kansas. The gravity measured is adjusted for elevation above sea level and for known changes in the spherical shape of the Earth. The resulting contours show the very small changes in gravity that are created by changes in subsurface rock types or elevations.
 go back