Kansas Geological Survey, Open-file Report 2000-01
by
Robert Sawin and Rex Buchanan
KGS Open File Report 2000-01
Springs are excellent indicators of groundwater quality. Because the aquifers that feed most spring systems are relatively shallow, springs are more vulnerable to contamination from the surface. The quality of the water that flows from springs depends on the material the water encounters before reaching the surface, and contaminants that may be introduced into the system.
Over the course of one year, the Kansas Geological Survey (KGS) sampled seven springs at the Tallgrass Prairie National Preserve in Chase County, Kansas. The purpose of this study was to locate the springs, monitor their flow rates, investigate seasonal changes in water quality, and see if the effects of burning and cattle grazing could be detected in the springs. Seven springs were sampled quarterly (December, March, June, and September), and the water samples were analyzed for four basic components: specific conductance, sulfates, chlorides, and nitrates. In addition, the flow rate of each spring was estimated at the time of sampling. These data are compiled in Table 1. Figure 1 shows the locations of the springs that were sampled on a portion of the Strong City, Kansas U.S. Geological Survey 1:24,000 scale topographic quadrangle.
Table 1--Water Quality of Selected Springs Taligrass Prairie National Preserve. Sp C in micromhos/cm @ 25 deg C; SO4, Cl, and NO3 in ppm; Temp in degrees F; GPM is estimated unless noted as measured (m).
| Sample No. | Legal Desc. | Name | Date | Sp C | SO4 | Cl | NO3 | Temp | GPM | GPS (N) | GPS (W) | Formation |
|---|---|---|---|---|---|---|---|---|---|---|---|---|
| Drinking Water Limit | 250 | 250 | 45 | |||||||||
| Rainwater sample | NE NE NE Sec. 6, T. 17 S., R. 8 E | 12/4/1999 | 17 | 1.4 | 1.1 | 2.5 | ||||||
| CS-A | SW SE SW Sec. 6, T. 17 S., R. 8 E | Red House Sp. | 12/17/98 | 523 | 9.8 | 1.9 | 0.3 | 58 | 100 | 38.42321 | 96.58567 | Crouse Ls. |
| CS-A2 | 3/10/99 | 512 | 11.6 | 1.9 | 0.7 | 100 | ||||||
| CS-A3 | 6/23/99 | 533 | 10.2 | 1.8 | 0.5 | 60 | ||||||
| CS-A4 | 9/21/99 | 560 | 6.0 | 2.3 | 0.5 | 64 | 60 | |||||
| CS-B | NE NE NW Sec. 7, T. 17 S., R. 8 E | 12/17/98 | 552 | 10.7 | 2.0 | 1.0 | 60 | 10m | 38.41774 | 96.57843 | Funston Ls. | |
| CS-B2 | 3/10/99 | 540 | 11.9 | 2.2 | 1.4 | 58 | 18 | |||||
| CS-B3 | 6/23/99 | 547 | 12.7 | 2.2 | 1.1 | 10 | ||||||
| CS-B4 | 9/21/99 | 515 | 7.1 | 2.2 | 0.8 | 62 | 2 | |||||
| CS-C | SE NE NW Sec 7, T. 17 S., R. 8 E | 12/17/98 | 592 | 11.2 | 2.9 | 0.9 | 59 | <1 | 38.41371 | 96.57988 | Wreford Ls. | |
| CS-C2 | 3/10/99 | 613 | 13.2 | 3.7 | 1.4 | <1 | ||||||
| CS-C3 | 6/23/99 | 613 | 13.7 | 3.6 | 1.3 | <1 | ||||||
| CS-C4 | 9/21/99 | 559 | 12.3 | 4.7 | 1.8 | 63 | <1 | |||||
| CS-D | SW NE NE Sec 9, T. 17 S., R. 8 E | 12/17/98 | 654 | 24.3 | 6.1 | 1.3 | 58 | 8 | 38.41708 | 96.52745 | Wreford Ls. | |
| CS-D2 | 3/10/99 | 661 | 26.0 | 4.9 | 1.2 | 58 | 15 | |||||
| CS-D3 | 6/23/99 | 662 | 28.7 | 4.9 | 1.3 | 5 | ||||||
| CS-D4 | 9/21/99 | 633 | 25.9 | 4.4 | 1.6 | 58 | 2 | |||||
| CS-E | NE NW SW Sec 9, T. 17 S., R. 8 E | 12/17/98 | 530 | 12.5 | 2.0 | 0.6 | 60 | 8 | 38.41408 | 96.53492 | Crouse Ls. | |
| CS-E2 | 3/10/99 | 538 | 16.4 | 2.1 | 0.7 | 25 | ||||||
| CS-E3 | 6/23/99 | 571 | 15.0 | 2.1 | 0.7 | 10 | ||||||
| CS-E4 | 9/21/99 | n/a | n/a | n/a | n/a | n/a | 0 | |||||
| CS-F | SE NW NE Sec 31, T. 18 S., R. 8 E | 12/17/98 | 530 | 14.4 | 2.3 | 0.7 | 58 | 38.44187 | 96.56815 | Bader Ls. | ||
| CS-F2 | 3/10/99 | 528 | 15.5 | 2.3 | 0.6 | |||||||
| CS-F3 | 6/23/99 | 560 | 14.1 | 1.8 | 0.7 | |||||||
| CS-F4 | 9/21/99 | 570 | 14.0 | 3.1 | 0.8 | 66 | ||||||
| CS-G2 | SW SE NW Sec. 7, T. 17 S., R. 8 E | 3/10/99 | 548 | 13.6 | 2.0 | 1.3 | 56 | 20 | 38.48482 | 96.58552 | Crouse Ls. | |
| CS-G3 | 6/23/99 | 552 | 11.9 | 1.8 | 1.0 | 10 | ||||||
| CS-G4 | 9/21/99 | 560 | 8.4 | 1.8 | 1.0 | 58 | 1 |
Figure 1--Location map of the seven springs in Chase County, north and west of Strong City. A larger PDF of this figure is available (1.6 MB).
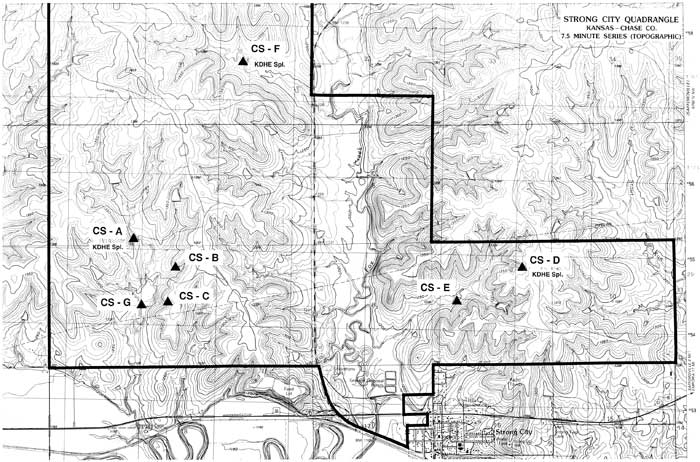
During this study, the Kansas Department of Health and Environment (KDHE) sampled three of the springs (CS-A, CS-D, and CS-F) twice, and performed a complete analysis of organic and inorganic chemistry, and environmental microbiology. These reports of analysis from KDHE are included as Appendix A, but are not discussed in this report. The locations and sample dates of the KDHE samples are as follows:
| Location Number |
Legal Description | Date Sampled |
|---|---|---|
| CS-A | SW SE SW Sec 6, T. 17 S., R. 8 E | 4/2/99 and 8/17/99 |
| CS-D | SE NE Sec 9, T. 17 S., R. 8 E | 4/2/99 and 8/17/99 |
| CS-F | SE NW NE Sec 31, T. 18 S., R. 8 E. | 6/23/99 and 8/17/99 |
Specific Conductance (Sp C). Most substances dissolved in water dissociate into ions that can conduct an electrical current. Specific conductance measures electrical conductivity, and therefore is an indicator of the amount of material dissolved in water. The larger the conductance, the more mineralized the water. In general terms, the more mineralized the water, the lower its quality. Specific conductance values are reported in micromhos per centimeter at 25° C.
Specific conductance measurements can be used to estimate total dissolved solids (TDS) content if the general characteristics of the water sample are known. For example, in the Flint Hills, most of the ground water contains some calcite or dolomite that has been derived from the limestone bedrock. In the absence of evaporite minerals or contaminants, the water chemistry is generally a calcium-bicarbonate type. If gypsum or anhydrite are present, calcium-sulfate waters are generated. Contamination of the ground water with brine produces sodium-chloride type waters, and livestock and septic system waste can increase chloride and nitrate concentrations.
To convert specific conductance values to total dissolved solids, a reliable conversion curve must be developed for each type of water using analyses of several representative samples. Based on two KDHE samples that measured both total dissolved solids and specific conductance, the conversion factor for springs at the Tallgrass Prairie National Preserve appears to be about 0.57 when dealing with specific conductance values in the 500 to 600 range. For example, if the specific conductance is 550, the approximate total dissolved solids value is 314 parts per million (550 X 0.57). This factor compares favorably with values developed in Marion County (the conversion factor in Marion County for specific conductance values between 1 and 999 is 0.62) for similar calcium-bicarbonate type waters (O'Connor and Chaffee, 1983).
Water high in dissolved solids may have a disagreeable taste or a laxative effect. Water containing less than 500 parts per million total dissolved solids is preferred for domestic use.
Sulfate (SO4). Sulfates are derived from gypsum, anhydrite, pyrite, and other materials containing sulfur compounds. Sulfate gives water a bitter taste, and at higher concentrations (500-1,000 ppm), a laxative effect. If sulfate combines with calcium, a hard scale can form in boilers and heat exchangers. The maximum recommended sulfate concentration for drinking water is 250 ppm.
Chloride (Cl). Natural occurrence of chloride in ground water comes from dissolution of salt beds and from seawater trapped in sediments during deposition. Chloride, in high concentrations, can increase the corrosiveness of water, and in combination with sodium, gives water a salty taste. Recommended drinking water standards limit the concentration of chloride to 250 ppm.
Nitrate (NO3). Nitrate from natural and human activities is a common ground-water contaminant. Naturally occurring nitrate concentrations in ground water seldom exceed 45 ppm, the recommended concentration of nitrate for drinking water. Decaying organic matter, legume plants, sewage, manure, and nitrate fertilizers are the most common sources of nitrate in ground water. Nitrate concentrations of 45 ppm may be harmful to infants. Higher concentrations may have adverse effects on older children and adults.
| Drinking Water Standards for the Parameters Tested in this Study. | |
|---|---|
| Parameter | Concentration (ppm or mg/L) |
| Total Dissolved Solids (TDS) | 500 |
| Sulfate (SO4) | 250 |
| Chloride (CI) | 250 |
| Nitrate (NO3)* | 45 |
*Nitrate (NO3) is often reported as nitrate-nitrogen (NO3-N). To convert nitrate (NO3) to nitrate-nitrogen (NO3-N), divide the nitrate concentration by 4.43 (e.g., the drinking water standard for NO3-N = 10 ppm or mg/L).
Based on the four components analyzed in seven springs at the Tallgrass Prairie National Preserve over a period of one year, the following conclusions can be drawn:
For comparison purposes, a rainwater sample was analyzed for the same four components and the results included in Table 1. Specific conductance of the rainwater was very low (17 compared to 500-650 for spring water) because it does not contain the dissolved minerals derived from the bedrock. Sulfate, chloride, and nitrate values for both rainwater and spring water were very similar. In fact, the nitrate value for rainwater was higher than any nitrate reading from the springs.
Buchanan, R., Sawin, R., and Lebsack, W., 1998, Kansas Springs: Kansas Geological Survey, Public Information Circular 11, 4 p. [available online]
O'Connor, H. G., and Chaffee, P. K., 1983, Geohydrology field trip, Marion County, Kansas: Kansas Geological Survey, Open-file Report 83-25, 42 p.
Sawin, R.S., Buchanan, R.C., and Lebsack, W., 1999, Flint Hills Springs: Transactions of the Kansas Academy of Science, v. 102, no. 1-2, p. 1-3 1.
Acknowledgements
The authors would like to acknowledge analysis of water samples by Larry Hathaway and Truman Waugh (retired), Geohydrology Section, Kansas Geological Survey; analysis of water samples by Bryan Bain, Kansas Department of Health and Environment, and the assistance of Bob Angelo, Kansas Department of Health and Environment; the assistance of Iralee Barnard, Kansas State University, in locating springs; and the assistance of Barbara Zurhellen, National Park Trust, and Steve Miller, National Park Service, and the staff of the Tallgrass Prairie National Preserve.
Inorganic Chemistry, Organic Chemistry, and Environmental Microbiology Analysis, Kansas Dept. of Health and Environment
appendixA.pdf (1.3 MB)
To read this file, you will need the Acrobat PDF Reader, available free from Adobe.
Kansas Geological Survey, Public Outreach
Placed online Nov. 13, 2007.
Comments to webadmin@kgs.ku.edu
The URL for this page is http://www.kgs.ku.edu/Publications/OFR/2000/OFR00_01/index.html