Kansas Geological Survey, Spatial Analysis Series 3, originally published in 1977
Originally published in 1977 as Kansas Geological Survey Spatial Analysis Series 3. This is, in general, the original text as published.
This is the third volume in the Series on Spatial Analysis, and the second to be authored by Ing. Ricardo Olea, of ENAP, the national petroleum company of Chile. This publication, with OPTIMUM MAPPING TECHNIQUES USING REGIONALIZED VARIABLE THEORY (SSA #2), is the result of a joint research effort conducted by the Kansas Geological Survey and Empresa Nacional del Petróleo (ENAP). The methods described have been extensively used for research and petroleum exploration in both Kansas and Chile. This cooperative research between industry and governments on an international level has proved remarkably productive, and demonstrates that scientific cooperation can transcend national and cultural boundaries for the benefit of all.
MEASURING SPATIAL DEPENDENCE WITH SEMIVARIOGRAMS is unique among studies on structural analysis in that real data are used to illustrate the various forms which the semivariogram can assume. These results are representative of what will be obtained from actual regionalized variables, rather than idealized abstractions. This publication and the included computer program should, therefore, be especially valuable to those wishing to perform structural analysis and universal kriging for practical purposes.
Dr. John C. Davis, Editor
Series on Spatial Analysis
The semivariogram is a measure of statistical dependence and is closely related to the autocorrelogram. It is particularly suitable for analysis of spatial functions that describe natural phenomena characterized by a geographic distribution and variations which arc in part continuous and in part stochastic. If the phenomenon is sampled at regular intervals along lines, important statistical parameters can be estimated from the semivariogram.
Spatial dependence may be expressed by a type of autocorrelogram referred to as the semivariogram, which expresses the degree of spatial variation as a function of distance. Semivariance is a special form of second-order moment used in the statistical theory of regionalized variables (Matheron, 1965).
Typically, a regionalized variable is a function that describes a natural phenomenon which has a geographic distribution. Examples of geologic properties which can be considered as regionalized variables include variations in structural elevation of a stratigraphic horizon (Olea, 1974), differences in Bouguer gravity values (Huijbregts and Matheron, 1971), changes in porosity within a petroleum reservoir, and changes in ore content in a mineralized body (Blais and Carlier, 1968).
A regionalized variable has the following characteristics: (1) An observation, which is a value from a function whose argument contains geographic coordinates specifying the location where the observation was made. Observations may be punctual, such as measurements of the gravitational or magnetic field taken at point locations, or they may consist of measurements made on areas or volumes, such as analyses of ore samples. If the observations are not punctual, the size, shape, and orientation of the samples must be specified. (2) An average continuity, in a mathematical sense. The spatial variation of a regionalized variable may be great or small, depending on the phenomenon, but continuity from point to point must exist. (3) A random or stochastic component which has no spatial continuity. Not all of the variation in the phenomenon may be expressable by a deterministic function.
Because regionalized variables include random components, they may be considered as random functions. Classical univariate statistics, however, is not adequate for the study of regionalized variables, because the information concerning the geographic locations of the samples cannot be considered (Blais and Carlier, 1968). The theory of regionalized variables as developed by Matheron (1965, 1970, 1971) takes into account the effects of sample location in the calculation of statistics. By utilizing the degree of relationship between adjacent samples, optimal interpolation and prediction can be achieved.
The semivariogram, or intrinsic function, is used in the theory of regionalized variables to express spatial variation. In form and use, it is similar to the autocorrelation function as used for signal analysis in communication theory (Mix, 1969). Let Z(![]() +
+ ![]() ) and Z(
) and Z(![]() ) be values of the regionalized variable at two locations a distance
) be values of the regionalized variable at two locations a distance ![]() apart. The semivariogram is defined as:
apart. The semivariogram is defined as:
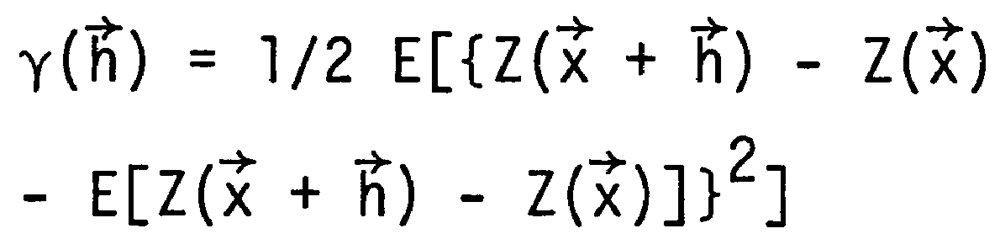
The first and second moments of the difference Z(![]() +
+ ![]() ) - Z(
) - Z(![]() ) depend only on the distance
) depend only on the distance ![]() between the two locations (
between the two locations (![]() +
+ ![]() ) and
) and ![]() and not on the individual coordinates. E is the expected value operator as used in classical statistics.
and not on the individual coordinates. E is the expected value operator as used in classical statistics.
Kansas Geological Survey
Placed on web Jan. 28, 2019; originally published 1977.
Comments to webadmin@kgs.ku.edu
The URL for this page is http://www.kgs.ku.edu/Publications/Bulletins/SpA3/index.html