Kansas Geological Survey, SDP 6, originally published in 1964
Originally published in 1964 as Kansas Geological Survey Special Distribution Publication 6. This is, in general, the original text as published. The information has not been updated. An Acrobat PDF version of this report is available (1.5 MB). Sheets for Table 1 available separately.
Data contained in this survey have been assembled through the efforts of the Conservation Division of the Kansas Corporation Commission in cooperation with the Kansas Geological Survey. A state Secondary Recovery Committee appointed to assist in the accumulation and interpretation of information relative to secondary recovery projects in Kansas has the following membership:
E. D. Goebel, Co-Chairman, Kansas Geological Survey
Mack C. Colt, Co-Chairman, Mack C. Colt, Inc.
E. E. Funk, Cities Service Oil Co.
Carl L. Pate, Oilfield Research Lab
Carrol F. Mahoney, Core Laboratories, Inc.
John Roberts, Oil and Gas Consv. Div., Kansas Corp. Commission
V. W. McKnab
Gene Rowe, Vance Rowe, Inc.
Lester Wilkonson
R. F. Ramsey, Barbara Oil Company
C. R. Wallen, Continental Oil Company
Robert L. Dilts, Kansas Geological Survey
Tom L. Schwinn, Kansas Independent Oil and Gas Association
J. M. Penrod, James A. Lewis Engineering, Inc.
In recent years, secondary recovery projects in Kansas have contributed an increasingly larger proportion of the total crude oil produced in Kansas. This trend has been observed also in other oil-producing states. Because of the increasing importance of oil production from secondary recovery projects in each state's oil economy and in the interest of conservation, the Interstate Oil Compact Commission, through its Secondary Recovery and Pressure Maintenance Committee, has encouraged the collection and distribution of information pertaining thereto. The amount of oil attributable to secondary recovery or pressure maintenance methods can be determined only by the judgment of the individual operator. For this reason, it was necessary to survey all active projects and all operators holding secondary recovery permits in Kansas.
The committee wishes to thank the operators for the good response to the survey which is probably the most complete secondary recovery survey ever made for Kansas. Nevertheless, it is hoped that the response to questionnaires for 1963 will be even better, as the value of the survey to the petroleum industry improves with the completeness of the data available.
The organizational meeting of the Kansas Secondary Recovery Committee was held on May 28, 1963, at the Kansas Corporation Commission's Conservation Division offices in Wichita, Kansas. At that time Mack C. Colt and E. D. Goebel were elected Co-Chairmen. The questionnaire on secondary recovery operations in Kansas was prepared in accordance with the rules and regulations of the Kansas Corporation Commission by a pilot committee consisting of John Roberts, Lester Wilkonson, and E. D. Goebel, with help from a representative of the Interstate Oil Compact Commission, and was submitted to the committee for approval. The committee recommended that the data collected by way of the questionnaires from the operators should be placed on key-punch cards so that manipulation by modern computer methods could be possible. The Kansas Geological Survey acted for the committee as the agency for assembling the data into publication form after the questionnaires were completed by the individual operators and returned to the Kansas Corporation Commission's Conservation Division. In this way only one agency requested information from the petroleum industry on secondary recovery statistics in Kansas during 1962.
The data was key-punched onto cards and a program was written under the direction of Dr. Floyd Preston to be processed on an IBM 1620 Computer at The University of Kansas. Assisting the committee in gathering data, tabulation, key-punching, programming, and manuscript preparation were: Douglas Beene, S. S. Greider, Dean Lebetsky, and Robert L. Walters.
In Kansas, many oil reservoirs are inefficiently produced by the primary sources of energy inherent to the reservoir, usually gas expansion, and a secondary means of furnishing energy to move the oil to the wellbore must be provided. In most oil reservoirs it is possible, when the natural energy for production has declined, to bring about increased oil production by injection of either gas or water into the reservoir. If such injection takes place while the reservoir pressure is high and the producing wells are in the flowing stage, the operation is classified as pressure maintenance. If it is started after the pressure has been substantially depleted and the field is in the pumping stage, it is classified as secondary recovery, repressuring, or water-flooding. Only the operators of an oil field can make the judgment as to when a field is in the secondary recovery stage.
The general rules and regulations for the conservation of crude oil and natural gas in Kansas issued by the State Corporation Commission have specific sections dealing with the application, approval, operation, and discontinuance of fluid repressuring and water-flooding of oil and gas properties in Kansas. Applications for permanent disposal of brines produced from Kansas oil and gas fields also comes under the jurisdiction of the Conservation Division. The permanent disposal of brines differs from water-flooding or secondary recovery operations in that disposal is in other than the producing zones (oil and gas reservoirs).
The data resulting from the 1962 survey of secondary recovery projects in Kansas are presented in Table 1 (in pocket). This is a direct "print-out" of information on the punch cards. A key to the various abbreviations and coding which appear in Table 1 is footnoted.
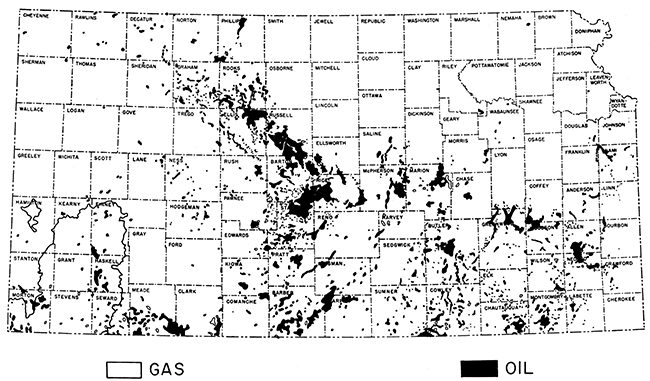
An index map showing the general location and extent of the Kansas oil and gas fields is presented as Figure 1. Detailed total production statistics for all Kansas oil and gas fields are given in Oil and Gas Developments in Kansas During 1962 (Bulletin 166, Kansas Geological Survey), as well as a map of Kansas (1"=500,000') on which the oil and gas fields are named and located. The locations of pipelines and allied petroleum industries in Kansas also are available in map form at the same scale (M-2, Kansas Geological Survey).
Figure 1--Index map of Kansas oil and gas fields.
Of the 940 projects listed in Table 1, 146 reported no production attributable to secondary recovery during 1962 and no entry was made in that space of the questionnaire in 143 projects. Therefore, a total of 289 projects reported no oil production attributable to secondary production during 1962. It should, however, not be interpreted that all of these had no secondary recovery. In addition, 130 of the 940 entries represented Multiple Order Numbers (Conservation Division permits for project extensions). Therefore, from a total of 940 entries in Table 1, 521 projects had secondary recovery production specifically reported during the year. A total of 15,891,000 barrels of oil from 10,297 producing wells was reported from these 521 projects.
During 1962, the Conservation Division of the State Corporation Commission issued 144 permits for secondary recovery operations, two less than in 1961. Of these 144 permits issued, some were to new projects but some were to extension of former projects, and represent a portion of 146 projects for which no information on secondary recovery production was attributable during the year. The approximately 15.9 million barrels of oil reported as secondary recovery production for the year 1962 in Kansas represents only that which was reported on the questionnaires and is not necessarily an accurate figure. Assuming that 90 percent of the secondary recovery project operators in Kansas returned questionnaires, and also assuming that the 10 percent that did not return questionnaires actually produced oil that should have been added to the total of secondary recovery during 1962, and taking into consideration the factors discussed above, it is reasonable to assume that about 3 million more barrels of oil could be designated as secondary recovery oil.
As an example of the incompleteness of the survey, about 511,000 barrels of oil is reported as attributable to secondary recovery projects from Allen County in 1962, yet the total amount of oil produced in the county during the year was approximately 900,000 barrels. A review of all operations in the county during 1962 would indicate that actually 85-90 percent of the county is under secondary recovery operations.
These factors should not negate the results from the survey but the results should be examined carefully and interpretations made with caution. The data presented on an individual project basis in Table 1 could be evaluated on a project basis as valid but a total of all projects would not represent the total secondary recovery oil in the state. It is anticipated that surveys similar to the one made in 1962 will be conducted annually by the Kansas Secondary Recovery Committee, aided by the Kansas Corporation Commission's Conservation Division and the Kansas Geological Survey. Attempts will be made to fill in those voids in information to the extent that future surveys will be more and more complete.
Table 2 presents a county summary of secondary recovery projects in Kansas during 1962. Included are county totals of secondary oil produced, number of producing wells, and number of acres. Data on the amount of water injected, number of injection wells and the oil production to water injection ratio are presented. Water production and oil per acre are also listed. The oil production to water injection ratios are calculated on a project weighted basis.
Example:
| Crawford County | ||
|---|---|---|
| M Bbls. Water Injected | M Bbls. Oil Produced | Calculations |
| 2 | ** (<500 bbl; >1 bbl) | ** ÷ 2 = .000 |
| 206 | 13 | 13 ÷ 206 = .063 |
| -1 | -1 (no data) | none |
| -1 | -1 (no data) | none |
| 6 | 2 | 2 ÷ 6 = .333 |
| .000 + .063 + .333 = .396 ÷ 3 (projects) = .132 oil produced/water injected ratio | ||
The oil per acre figures are simple divisions of the two factors involved. Caution should be used here also to evaluate the completeness of the basic project data presented in Table 1.
Butler County had the most oil attributed to secondary recovery projects in 1962 with approximately 3,408,000 barrels from 1,198 wells. Greenwood County was second and Cowley and Russell were third and fourth. The total oil production reported in the survey amounted to 15,891,000 barrels from 10,297 wells. There were 6,428 active injection wells which accounted for 250,022,000 barrels of water. This represents approximately twice the volume of oil produced by all methods in Kansas during 1963, or about two barrels of water (mostly brine) for each barrel of oil produced by all methods in Kansas in 1962.
Table 3 presents information on a formation or "pay zone" basis. The "Bartlesville sand" yielded the most oil by secondary recovery methods, 5,058,000 barrels. The second most important zone was the Lansing with 2,531,000 barrels of oil. Of the pay zones accredited with more than 100,000 barrels of secondary recovery oil during 1962, the "Squirrel" had the highest ratio (.677) of average injection pressure (in p.s.i.) to average depth to top of pay zone.
Table 2--Summary of 1962 Secondary Recovery Projects in Kansas, by County.
| Counties | Oil Production, (Mbbl) |
No. Producing Wells |
Acreage | Water Inject., (Mbbl) |
No. Injection Wells |
Oil-Water Ratio* |
Water Production, (Mbbl) |
Oil Per Acre, (Bbls) |
|||
|---|---|---|---|---|---|---|---|---|---|---|---|
| Active | Inact. | Current | Add. | Active | Inact. | ||||||
| Allen | 511 | 1,085 | 141 | 4,971 | 1,156 | 8,931 | 732 | 159 | .142 | 2,281 | 102 |
| Anderson | 350 | 1,062 | 38 | 3,203 | 518 | 5,656 | 830 | 39 | .088 | 3,277 | 109 |
| Barber | 57 | 61 | 14 | 2,620 | 480 | 3,522 | 12 | 1 | .126 | 45 | 21 |
| Barton | 143 | 169 | 26 | 4,819 | 770 | 4,435 | 70 | 13 | .044 | 10,351 | 29 |
| Bourbon | 84 | 65 | 1 | 700 | 480 | 292 | 65 | 0 | .309 | 119 | 120 |
| Butler | 3,408 | 1,198 | 108 | 18,804 | 2,489 | 59,521 | 930 | 36 | .078 | 41,729 | 181 |
| Chase | 0 | 7 | 1 | 240 | 0 | 127 | 1 | 1 | -- | 99 | -- |
| Chautauqua | 24 | 176 | 19 | 1,801 | 350 | 633 | 103 | 10 | .196 | 117 | 13 |
| Clark | 57 | 21 | 1 | 2,960 | 0 | 657 | 7 | 0 | .105 | 20 | 19 |
| Cowley | 1,766 | 425 | 84 | 13,357 | 1,210 | 22,536 | 286 | 46 | .103 | 11,725 | 132 |
| Crawford | 15 | 70 | 0 | 368 | 100 | 214 | 72 | 0 | .132 | 69 | 40 |
| Decatur | 78 | 40 | 0 | 1,294 | 560 | 835 | 11 | 0 | .138 | 593 | 60 |
| Dickinson | 0 | 3 | 1 | 160 | 160 | 0 | 3 | 1 | -- | 0 | 0 |
| Douglas | 0 | 5 | 1 | 0 | 0 | 0 | 0 | 0 | -- | 0 | 0 |
| Edwards | 11 | 5 | 0 | 140 | 0 | 191 | 2 | 0 | .059 | 191 | 78 |
| Elk | 21 | 47 | 18 | 240 | 180 | 522 | 21 | 4 | .117 | 390 | 87 |
| Ellis | 60 | 60 | 2 | 2,150 | 30 | 1,030 | 23 | 0 | .081 | 813 | 27 |
| Ellsworth | 30 | 14 | 0 | 640 | 120 | 212 | 6 | 0 | .066 | 25 | 46 |
| Finney | 0 | 5 | 0 | 240 | 480 | 144 | 2 | 1 | .000 | 144 | -- |
| Franklin | 214 | 355 | 27 | 1,575 | 590 | 3,976 | 389 | 37 | .092 | 3,146 | 135 |
| Graham | 138 | 234 | 13 | 9,121 | 660 | 3,236 | 67 | 3 | .278 | 1,288 | 15 |
| Greenwood | 2,057 | 1,003 | 221 | 17,755 | 1,745 | 42,222 | 654 | 203 | .078 | 31,744 | 115 |
| Harper | 0 | 0 | 0 | 0 | 0 | 0 | 0 | 0 | -- | 0 | -- |
| Harvey | 0 | 0 | 0 | 0 | 0 | 0 | 0 | 0 | -- | 0 | -- |
| Hodgeman | 95 | 15 | 0 | 960 | 0 | 364 | 4 | 0 | .260 | 107 | 98 |
| Kingman | 41 | 18 | 1 | 775 | 80 | 716 | 10 | 2 | .032 | 432 | 52 |
| Labette | 49 | 109 | 66 | 755 | 570 | 512 | 47 | 20 | .245 | 153 | 64 |
| Linn | 20 | 116 | 0 | 260 | 50 | 613 | 103 | 9 | .038 | 422 | 76 |
| Lyon | 11 | 19 | 2 | 714 | 160 | 216 | 11 | 2 | .087 | 63 | 15 |
| Marion | 35 | 43 | 1 | 1,460 | 400 | 975 | 19 | 0 | .022 | 903 | 23 |
| McPherson | 412 | 193 | 82 | 5,910 | 420 | 13,347 | 79 | 21 | .089 | 13,524 | 69 |
| Meade | 341 | 21 | 4 | 1,839 | 0 | 1,233 | 10 | 0 | .276 | 271 | 185 |
| Miami | 254 | 495 | 21 | 1,486 | 810 | 3,438 | 472 | 52 | .107 | 1,607 | 170 |
| Montgomery | 22 | 176 | 27 | 610 | 910 | 437 | 35 | 53 | .052 | 50 | 36 |
| Neosho | 189 | 452 | 33 | 2,798 | 1,996 | 2,110 | 290 | 43 | .216 | 148 | 67 |
| Ness | 34 | 17 | 0 | 500 | 80 | 387 | 5 | 0 | .087 | 387 | 68 |
| Pawnee | 54 | 28 | 3 | 859 | 640 | 788 | 21 | 1 | .024 | 371 | 62 |
| Phillips | 353 | 125 | 2 | 7,765 | 580 | 2,473 | 47 | 0 | .127 | 942 | 45 |
| Pratt | 390 | 126 | 23 | 3,600 | 1,250 | 4,006 | 33 | 6 | .121 | 1,908 | 108 |
| Reno | 127 | 37 | 11 | 2,630 | 320 | 3,976 | 14 | 1 | .034 | 1,576 | 48 |
| Rice | 366 | 185 | 4 | 5,506 | 250 | 3,909 | 48 | 2 | .068 | 1,939 | 66 |
| Rooks | 120 | 89 | 5 | 3,210 | 1,040 | 1,645 | 29 | 1 | .312 | 1,327 | 37 |
| Rush | 33 | 29 | 1 | 550 | 80 | 1,526 | 8 | 3 | .008 | 307 | 60 |
| Russell | 1,297 | 519 | 25 | 17,520 | 1,900 | 15,990 | 269 | 3 | .091 | 8,667 | 74 |
| Saline | 66 | 54 | 5 | 2,294 | 0 | 650 | 18 | 3 | .140 | 638 | 28 |
| Sedgwick | 595 | 181 | 4 | 2,391 | 0 | 9,059 | 56 | 0 | .076 | 2,628 | 248 |
| Sheridan | 57 | 51 | 2 | 1,466 | 0 | 1,271 | 12 | 3 | .087 | 396 | 38 |
| Stafford | 269 | 98 | 18 | 4,178 | 13 | 1,782 | 42 | 6 | .194 | 690 | 64 |
| Sumner | 741 | 149 | 27 | 4,413 | 0 | 8,123 | 78 | 10 | .075 | 3,014. | 167 |
| Trego | 49 | 21 | 3 | 1,060 | 0 | 772 | 8 | 0 | .145 | 148 | 46 |
| Wilson | 217 | 256 | 97 | 1,219 | 2,560 | 1,716 | 134 | 47 | .124 | 174 | 178 |
| Woodson | 258 | 356 | 91 | 4,438 | 592 | 2,979 | 153 | 28 | .094 | 1,090 | 58 |
| Allen & Neosho | 70 | 39 | 2 | 175 | 80 | 180 | 18 | 1 | .388 | 100 | 400 |
| Barton & Rice | 10 | 18 | 0 | 370 | 0 | 195 | 7 | 0 | .051 | 147 | 27 |
| Ellis & Rooks | 55 | 31 | 2 | 337 | 327 | 800 | 10 | 2 | .067 | 487 | 163 |
| Ellis & Russell | 56 | 14 | 0 | 450 | 0 | 347 | 3 | 1 | .161 | 291 | 124 |
| Kingman & Pratt | 56 | 29 | 8 | 1,100 | 0 | 1,613 | 22 | 2 | .034 | 501 | 50 |
| Kingman & Sedgwick | 72 | 34 | 11 | 445 | 530 | 1,738 | 19 | 0 | .041 | 827 | 161 |
| McPherson & Harvey | 46 | 11 | 3 | 350 | 0 | 522 | 2 | 1 | .088 | 522 | 131 |
| Rice & McPherson | 0 | 9 | 0 | 100 | 0 | 49 | 1 | 1 | -- | 43 | -- |
| Trego & Graham | 7 | 13 | 1 | 320 | 340 | 483 | 2 | 0 | .014 | 0 | 21 |
| Woodson & Coffey | 0 | 11 | 0 | 140 | 180 | 190 | 3 | 0 | -- | 156 | -- |
| *Oil-water injected ratio calculated on project weighted averages. | |||||||||||
Table 3--Secondary Recovery Oil Production and Ratios of Injection Pressures to Depths of the Producing Zones During 1962 in Kansas
| Producing Zone |
Oil Production (Mbbl) |
Average Injection Pressure (p.s.i.)/ Average Depth |
|---|---|---|
| "Bartlesville" | 5,058 | .274 |
| Lansing | 2,531 | .063 |
| Mississippian | 1,666 | .047 |
| Simpson | 1,327 | .034 |
| "Shallow El Dorado" | 1,307 | .208 |
| "Squirrel" | 865 | .677 |
| Kansas City | 635 | .084 |
| Marmaton | 466 | .061 |
| "Hunton" | 392 | .040 |
| Tarkio | 293 | .166 |
| Viola | 211 | .013 |
| "Cattleman" | 156 | .101 |
| "Peru" | 142 | .446 |
| Douglas | 108 | .132 |
| "Tucker" | 82 | ---- |
| "Layton" | 67 | .086 |
| Morrowan | 57 | .179 |
| Maquoketa | 56 | .002 |
| Reagan | 40 | .007 |
| "Redd" | 23 | .343 |
| "Wayside" | 20 | .833 |
| Admire | 20 | .941 |
| Pennsylvanian | 19 | .030 |
| Kinderhookian | 17 | .305 |
| Topeka | 16 | .035 |
| Hoover | 14 | .144 |
| Indian Cave | 14 | .742 |
| "Gorham" | 13 | .042 |
| Arbuckle | 12 | .013 |
| "Dodge" | 10 | .102 |
| Toronto | 10 | ---- |
| "Conglomerate" | 10 | .108 |
Kansas Geological Survey
Placed on web March 10, 2017; originally published 1964.
Comments to webadmin@kgs.ku.edu
The URL for this page is http://www.kgs.ku.edu/Publications/Bulletins/SDP6/index.html