Kansas Geological Survey, Irrigation Series 6, originally published in 1981
Prepared by the Kansas Geological Survey and the U.S. Geological Survey
Originally published in 1981 as Kansas Geological Survey Irrigation Series 6. This publication is also available as an Acrobat PDF file (1.2 MB). Plates available separately.
Aquifer--a formation, group of formations, or part of a formation that contains sufficient saturated permeable material to yield a significant quantity of water to wells or springs.
Evaporation--the process by which water moves to the atmosphere by changing from a liquid to a vapor.
Evapotranspiration--the combined process by which water is vaporized by direct evaporation and by transpiration of vegetation.
Hydraulic conductivity--the property of a medium, such as an aquifer, to transmit a unit volume of water at the prevailing viscosity through a cross section of unit area (LT-1).
Hydrograph--a graph showing variation of water level or flow rate with time.
Leakance--the ratio of the hydraulic conductivity of the streambed, in the vertical direction, to the thickness of the streambed material.
Riparian evapotranspiration--the water that moves to the atmosphere by evapotranspiration along stream banks largely due to transpiration by plants, except in wetlands where evaporation may dominate.
Specific yield--the volume of water that will drain by gravity from a volume of saturated aquifer material as the water table declines (dimensionless).
Steady state--steady flow of water through permeable material. Under this condition, there is no change in hydraulic head with time or change in volume of water in storage.
Storage coefficient--the volume of water an aquifer releases from or takes into storage per unit surface area of the aquifer per unit change in hydraulic head (dimensionless).
Transmissivity--the rate at which water of prevailing viscosity is transmitted through the entire thickness of a medium (such as an aquifer) of unit width and under a unit hydraulic gradient (L2T-1).
Transpiration--the movement of water vapor from a living body through its membrane or pores.
Water table--the water table is that surface in a ground-water body at which water pressure is atmospheric. It is defined by the levels at which water stands in wells that only penetrate the aquifer a small distance below the water table.
Water-table aquifer--is an aquifer that has a water table.
For readers familiar with or interested in the metric system, the inch-pound units of measurement given in this report are listed below with equivalent International System (SI) of Units using the following abbreviations and conversion factors:
| Inch-pound units | Multiply by | To obtain SI units |
|---|---|---|
| Length | ||
| inch (in) | 2.54 | centimeter (cm) |
| foot (ft) | 0.3048 | meter (m) |
| mile (mi) | 1.609 | kilometer (km) |
| Area | ||
| acre | 4,047 | square meter (m2) |
| square mile (mi2) | 2.590 | square kilometer (km2) |
| Volume | ||
| acre-foot (acre-ft) | 1,233 | cubic meter (m3) |
| acre-foot per year (acre-ft/yr) |
1,233 | cubic meter per year (m3/yr) |
| Flow | ||
| gallon per minute (gal/min) | 0.06309 | liter per second (L/s) |
| cubic foot per second (ft3/s) | 0.02832 | cubic meter per second (m3/s) |
| cubic foot per second per mile [(ft3/s)/mi] |
0.01760 | cubic meter per second per kilometer [(m3/s)/km] |
| Hydraulic conductivity | ||
| foot per day (ft/d) | 0.3048 | meter per day (m/d) |
| Transmissivity | ||
| square foot per day (ft2/d) | 0.0929 | square meter per day (m2/d) |
The alluvial valley of the North Fork Solomon River is an important agricultural area. Reservoir releases diverted below Kirwin Dam are the principal source of irrigation water. During the 1970'S, severe water shortages occurred in Kirwin Reservoir and other nearby reservoirs as a result of an extended drought. Some evidence indicates that surface-water shortages may have been the result of a change in the rainfall-runoff relationship. Examination of the rainfall-runoff relationship shows no apparent trend from 1951 to 1968, but annual records from 1969 to 1976 indicate that deficient rainfall occurred during 6 of the 8 years.
Ground water from the alluvial aquifer underlying the river valley also is used extensively for irrigation. Utilization of ground water for irrigation greatly increased from about 200 acre-feet in 1955 to about 12,300 acre-feet in 1976. Part of the surface water diverted for irrigation has percolated downward into the aquifer raising the ground-water level. Ground-water storage in the aquifer increased from 230,000 acre-feet in 1946 to 275,000 acre-feet in 1976-77.
A digital model was used to simulate the steady-state conditions in the aquifer prior to closure of Kirwin Dam. Model results indicated that precipitation was the major source of recharge to the aquifer. The effective recharge, or gain from precipitation minus evapotranspiration, was about 11,700 acre-feet per year. The major element of discharge from the aquifer was leakage to the river. The simulated net leakage (leakage to the river minus leakage from the river) was about 11,500 acre-feet per year. The simulated value is consistent with the estimated gain in base flow of the river within the area modeled.
Measurements of seepage used to determine gain and loss to the stream were made twice during 1976. Based on these measurements and on base-flow periods identified from hydrographs, it was estimated that the ground-water discharge to the stream has increased about 4,000 acre-feet per year from 1946 to 1976. During the same period, ground water withdrawn from the aquifer increased 12,100 acre-feet per year. Hydrographs of water levels in wells indicate some withdrawal from aquifer storage during 1976, possibly as a combined result of below-normal rainfall and greatly increased pumpage. The analysis of data is inconclusive as to whether the aquifer can sustain increased groundwater development. However, the analysis does indicate that the aquifer could sustain withdrawals at the 1976 rate for several consecutive years of drought similar to the 1976 conditions.
The alluvial valley of the North Fork Solomon River from Kirwin Dam to Waconda Lake, as shown in figure 1, is an important agricultural area. The valley has rich soils and is farmed extensively. Both surface water and ground water are used extensively for irrigation. Releases of water from Kirwin Dam are the predominant source of surface water.
Figure 1--Location of study area.
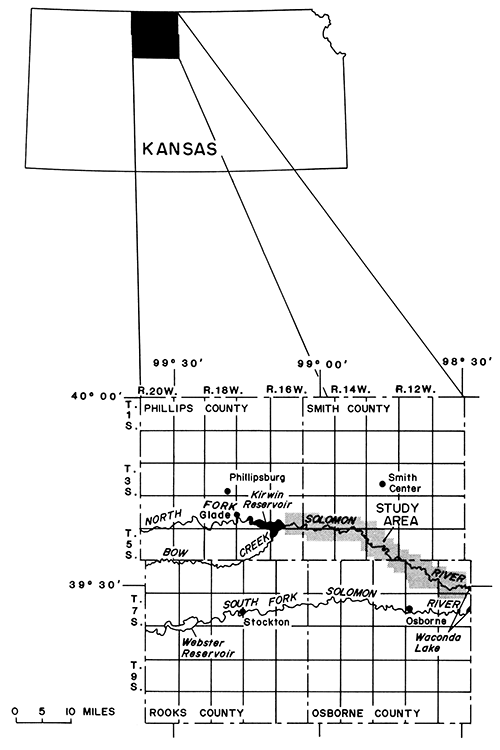
The study area includes about 170 mi2 located in Osborne, Phillips, and Smith Counties in north-central Kansas. The valley aquifer underlies more than 86 mi2. The valley is nearly flat with one or more terraces near the river. The upland adjoining the valley consists of gentle hills dissected by small valleys of intermittent streams.
Many reservoirs in central and north-central Kansas are receiving less streamflow than in the past. The reason for the shortage of surface water is not known for certain. Soil-conservation practices, changing methods of tillage, and increasing farm yields may be changing the rainfall-runoff relation. Preliminary analyses of rainfall-runoff relations for several Kansas streams by P. R. Jordan, U.S. Geological Survey (written commun., 1980), strongly suggest changes in recent years.
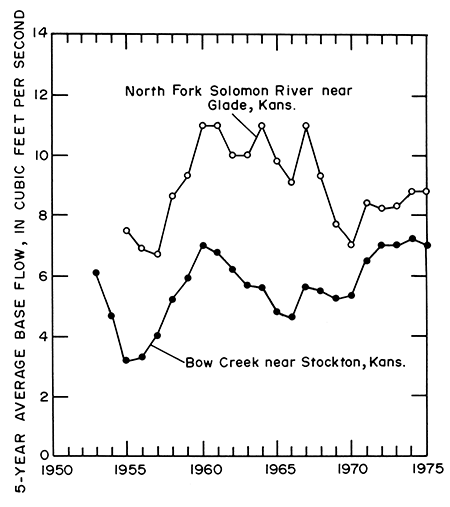
Five-year centered moving averages of base flow during the winter months (fig. 2), based on hydrograph separation at a point (gage) upstream from the existing Kirwin Reservoir, show a decrease in base flow of the North Fork Solomon River since 1967. This reduction may be, at least partly, the result of increased pumping from wells in the alluvium upstream from the gage. The base flow in Bow Creek, where few wells were pumping from the alluvium upstream from the gage, has shown an increase since 1966.
Figure 2--Five-year centered moving averages of October to April base flow upstream from Kirwin Reservoir.
In recent years, increased irrigation with ground water has been used to supplement the irrigation with surface water. It is not known if the same rate of ground-water development can be continued because the hydrology of the aquifer in the valley is relatively unknown.
The purpose of this study was to evaluate the effect of irrigation development in the river valley between Kirwin Dam and Waconda Lake and to better define the hydrologic system, especially the relation between the aquifer and the river, so that management plans can be based on the best available knowledge of the system.
This study of the hydrology of the North Fork Solomon River valley began in 1976 as part of a cooperative program between the Kansas Geological Survey and the U.S. Geological Survey. Similar studies of the hydrology of the South Fork Solomon River valley between Webster Dam and Waconda Lake and of the Prairie Dog Creek valley between Norton Reservoir and the Nebraska State line also are part of the cooperative program.
Data for this report were obtained chiefly during 1976 and 1977. Additional data were obtained from the yearly operation report of the U.S. Water and Power Resources Service (formerly U.S. Bureau of Reclamation) for Kirwin Reservoir and Kirwin Irrigation District. An investigation by A. R. Leonard (1952) described the geology and the ground-water resources of the valley prior to construction of Kirwin Dam.
Data collection for this study consisted of locating all large-capacity wells (yields of more than 100 gal/min); collecting selected discharge and power-consumption data; drilling test holes to determine lithology, depth to water, and depth to bedrock; measuring streamflow gains or losses; collecting water samples; and measuring water levels in wells. Hydrologic data collected for this study and for similar studies in the cooperative investigation of north-central Kansas are presented in a supplementary report by L. E. Stullken (1980).
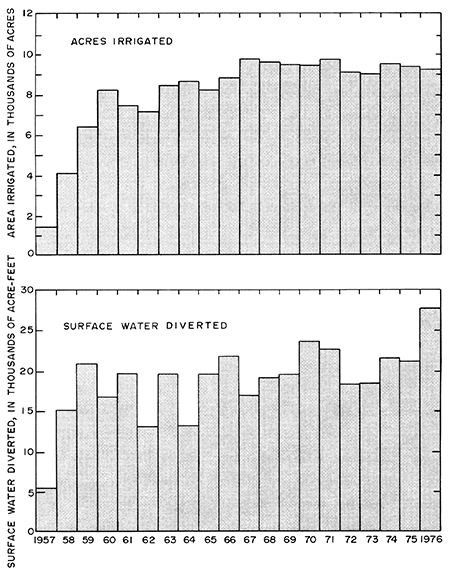
Impoundment of water behind Kirwin Dam began in October 1955, and the Kirwin Irrigation District began operation in July 1957. During that year, 5,530 acre-ft of surface water were diverted below the dam and applied to 1,440 acres of farmland. Since 1957, the irrigated acreage (fig. 3) has increased from about 4,130 acres in 1958 to 9,220 acres in 1976. The quantity of surface water diverted for irrigation also has increased in a similar manner from about 15,200 acre-ft in 1958 to about 27,700 acre-ft in 1976, as shown in figure 3. The average diversion for 1958-76 was about 19,000 acre-ft/yr.
Figure 3--Acres irrigated and surface water diverted in Kirwin Irrigation District.
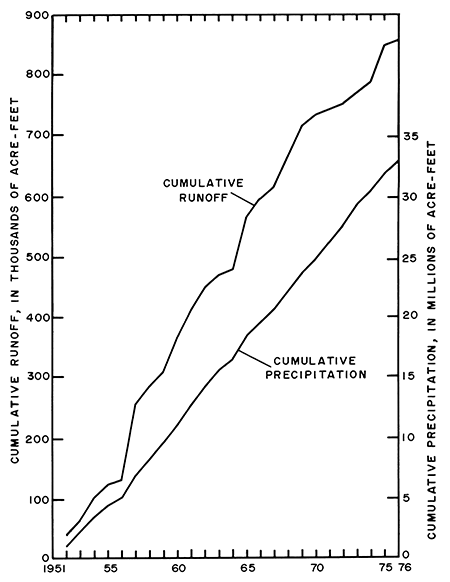
The availability of surface water to be diverted for irrigation in the study area is dependent upon the amount of water available to Kirwin Reservoir. Thus, a study of the stream-aquifer relation must consider the availability of water to the stream. The cumulative precipitation and the cumulative runoff in the area upstream from Kirwin Dam since 1952 are shown in figure 4. Cumulative precipitation was determined using the "Theissen mean" method (Wisler and Brater, 1959, p. 81). Cumulative discharge or runoff was determined from streamflow records for the North Fork of the Solomon River at Glade, Kans., and from the records of Bow Creek near Stockton, Kans. (U.S. Geological Survey, 1953-77). No significant change in the trend of annual precipitation is shown. A definite change in the trend of cumulative runoff is not proven from the data in figure 4; however, a reduction in runoff may be indicated after 1969.
Figure 4--Cumulative runoff and cumulative precipitation upstream from Kirwin Dam.
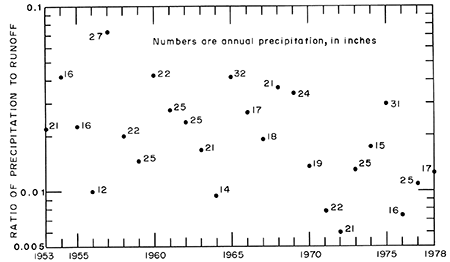
A graph of the yearly ratio of precipitation to runoff in Bow Creek and the North Fork Solomon River upstream from Kirwin Reservoir (fig. 5) shows large variability. Although the graph shows no linear relationship, the data indicate a decreasing trend in the ratio with time.
Figure 5--Yearly ratio of precipitation to runoff in Bow Creek and North Fork Solomon River upstream from Kirwin Reservoir.
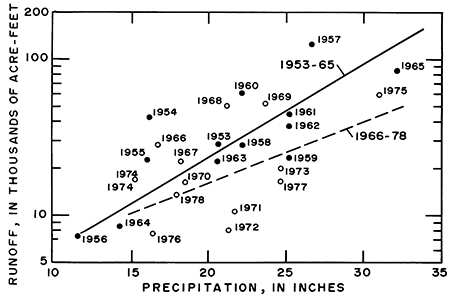
Inspection of the data indicates that, within the limited range of observation, the relationship between yearly precipitation and runoff can be approximated by an exponential function. The relationship is dependent on many complex interacting factors, such as antecedent conditions, intensity of rainfall, and systematically changing practices of soil and water conservation. The nature of the changing relationship between runoff and precipitation was investigated by dividing the period of record into two equal parts (1953-65 and 1966-78). A straight line was fitted to the data for each part by the least-squares technique, as shown in figure 6.
Figure 6--Relation of yearly precipitation to runoff in Bow Creek and North Fork Solomon River upstream from Kirwin Reservoir.
To evaluate the significance of the differences between the two lines, the data were tested statistically using techniques described by Dixon and Massey (1957, p. 212-213) and Snedecor and Cochran (1967, p. 434-435). Two-sided "F" tests were used to indicate whether the observed differences between slopes and intercepts of the two lines are random (satisfies the null hypothesis of statistics) or are due to one or more systematic causes (rejects the null hypothesis). Results gave "F" test probabilities of p > 0.10 for the slopes and p > 0.40 for the intercepts of the two lines. These probabilities show that the differences between the two lines may be due to random sampling error (Dixon and Massey, 1957).
Although it is not apparent in figure 2, pumping from irrigation wells in the drainage area upstream from Kirwin Dam reduces the base flow of the river. In this area of 1,190 mi2, the number of wells (fig. 7) increased from 56 in 1971 to 146 in 1976 (data from the Division of Water Resources, Kansas State Board of Agriculture). Wells located in the flood plain of the river would have considerable effect on base flow, but the many wells located in the uplands would have only minimal effect. Although a "water budget" analysis of the aquifer would show that pumping lowers water levels and reduces ground-water discharge to the river, base flow is only a part of the total inflow to Kirwin Reservoir. Busby and Armentrout (1965) calculated that the average base flow upstream from the reservoir, for 1929-32 and 1937-62, was 26.3 ft3/s, or 25 percent of the average total flow of 105 ft3/s.
Figure 7--Number of irrigation wells and estimated pumpage.
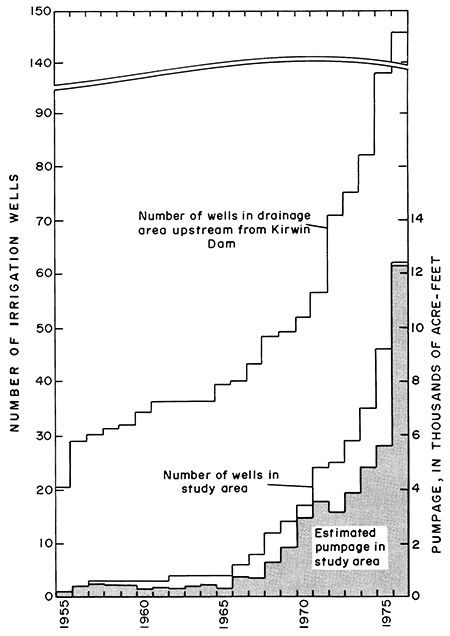
The withdrawal of ground water for irrigation has increased rapidly since 1965, as shown in figure 7. In the study area, the area of cropland irrigated by ground water has increased from 100 acres in 1956 to about 4,000 acres in 1976. Ground-water withdrawal in the study area increased from about 200 acre-ft in 1955 to about 12,300 acre-ft in 1976. The number of irrigation wells has increased from 1 in 1955 to about 60 in 1976. The locations of irrigation and municipal wells are shown on plate 1.
Well yields differ within a large range. Well yields in the study area are primarily a function of saturated sand and gravel thicknesses. Typical irrigation-well yields range from 250 to 750 gal/min. Sites for irrigation wells, even in areas as small as 80 acres, generally are determined by test drilling to find locations with 15 feet or more of saturated sand and gravel.
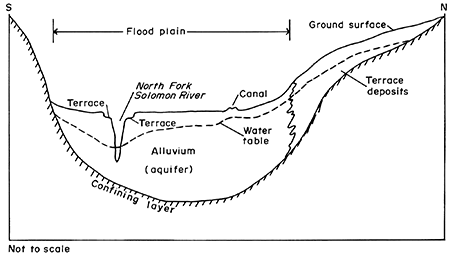
The aquifer, in general, consists of the alluvial deposits below the flood plain of the river. The areal extent of the aquifer is shown on plate 1. Terrace deposits of silt, sand, and gravel occur at some locations, especially along the northern edge of the flood plain. If these deposits are saturated, they are part of the aquifer. A generalized cross section of the aquifer is shown in figure 8. The aquifer consists of layers of clay, silt, sand, and gravel. Water in quantities large enough to be used for irrigation or public supply is withdrawn from the lenticular and discontinuous sand and gravel layers. The aquifer is underlain by Niobrara Chalk and Carlile Shale of Cretaceous age. Both formations are considered confining layers; however, the Niobrara is an aquifer in local areas where secondary permeability and porosity have developed.
Figure 8--Hydrologic units in the river valley.
The transmissivity of the aquifer is a function of the hydraulic conductivity of the aquifer material and the saturated thickness of the aquifer. The hydraulic conductivity of the aquifer differs greatly within short distances. These differences are largely the result of the discontinuous and lenticular nature of the alluvial sediments. The hydraulic conductivity of the aquifer material was estimated to range from nearly zero to more than 500 ft/d. The average hydraulic conductivity probably is slightly less than 150 ft/d.
Although two aquifer tests were made during the study, the transmissivity and storage values determined from these tests were not considered accurate. Thus, specific yield could not be determined from existing aquifer tests. However, the specific yield of most similar water-table aquifers is between 0.1 and 0.2.
Dingman (1969, p. 6) reported that two aquifer tests were conducted in 1963 for municipal wells 1 and 4, owned by the city of Downs. Transmissivity values from these aquifer tests were calculated at 4,800 ft2/d, with a storage coefficient of 0.1. Saturated thickness in the Downs area is about 25 feet (pl. 1). Using these values, a hydraulic conductivity of 190 ft/d would be indicated. Additionally, tests for determining interference between wells in secs. 8 and 12, T. 6 S. R. 12. W. were analyzed for this study. Transmissivity values between 4,500 and 10,500 ft2/d were indicated within 625 feet of each other. Hydraulic conductivities ranged from 160 to 530 ft/d.
A map of aquifer transmissivity is not included because the available data generally represent the most favorable sites for large well yields as determined by test drilling. However, the area of relatively large transmissivity is indicated in a general way on plate 1 by the location of wells and by the area that has a saturated thickness of greater than 25 feet.
Recharge to the aquifer system in the study area is from infiltration of precipitation, infiltration of both surface and ground water used for irrigation, subsurface inflow to the aquifer downstream from Kirwin Dam, seepage from the river, and subsurface inflow along the borders of the aquifer, especially in the small alluvial channels entering the valley.
Recharge by infiltration of precipitation in the study area is a function of many factors including saturation of the soil, soil permeability, rate and volume of precipitation, and evapotranspiration. Most of the precipitation is lost to evapotranspiration and does not reach the aquifer. Some of the water runs off the land to the streams, and some infiltrates downward to recharge the aquifer. That part of the mean annual precipitation (about 23 in/yr) infiltrating the aquifer in the study area is unknown. Other investigators who constructed models of shallow, valley aquifers with similar aquifer conditions in Kansas (Winslow and Nuzman, 1966), Nebraska (E. G. Lappala, U.S. Geological Survey, oral commun., 1980), and South Dakota (N.C. Koch, U.S. Geological Survey, oral commun., 1980) have estimated that 10 percent of the precipitation infiltrates to the aquifer.
Infiltration of diverted surface water from the irrigation system is a major source of recharge to the aquifer in the study area. Records of the Kirwin Irrigation District (1960-76) indicate that 31 percent of the diverted water was lost in the canals and laterals. Nearly all of this lost water infiltrated to the aquifer. Part of the remaining 69 percent of the diverted water that was applied to the irrigated land also recharged the aquifer by infiltration. If the quantity of diverted water is reduced or if more efficient irrigation is accomplished in the future, the quantity of water recharged to the aquifer will be reduced.
The North Fork Solomon River gains water in most of the study area. Before closure of the Kirwin Dam, however, water was lost by seepage to the aquifer in several short reaches. Additionally, water from the river is recharged to the aquifer during periods of high flow.
The aquifer is recharged by subsurface inflow in the alluvial deposits in the valley downstream from Kirwin Dam. Subsurface inflow through the alluvial deposits in the tributary valleys is an important source of recharge. Some subsurface inflow through the material of the valley walls also occurs, especially into and through the terrace deposits along the valley walls.
Water is discharged from the aquifer by leakage to the river, evapotranspiration, pumping, and subsurface outflow to Waconda Lake. Leakage from the aquifer generally is represented by base flow in the river. First, two methods were used to estimate the pre-1956 base flow of the North Fork Solomon River. Streamflow records were examined for 14 periods of base flow (from September 1945 to December 1955) prior to closure of Kirwin Dam. These records indicate that the discharge from the aquifer to the river in the study area was 11 ft3/s, with a standard deviation of ± 6 ft3/s.
Secondly, Busby and Amentrout (1965, p. 52-53), using a hydrograph-separation technique on pre-1956 streamflow records, estimated that the 30-year mean-annual increase in base flow between Kirwin and Downs would be 34 ft3/s. The two methods of determining base flow are quite different, and the values obtained are estimates. However, it is probable that the two estimates define the range in which the true value of base flow occurs.
Recharge from surface-water irrigation has raised the water level in the aquifer and has resulted in an increased leakage of water from the aquifer to the river. Examination of streamflow records for 1957-76 indicated 20 periods of well-defined base flow. During these periods, the loss from the aquifer (or gain to the river) was 0.5 (ft3/s)/mi, with a standard deviation of ± 0.2 (ft3/s)/mi. Thus, the average loss from the aquifer from 1957 to 1976, based on these measurements, would be 27 ft3/s, with a standard deviation of ± 10 ft3/s.
Measurements of base flow made on August 8, 1976, during the irrigation season, indicated a gain of 0.19 (ft3/s)/mi. Measurements of base flow made on November 10, 1976, several months after cessation of irrigation, indicated a gain to the river of 0.52 (ft3/s)/mi. If the two values of gain are typical for the irrigation and nonirrigation seasons, the weighted average for the year would be 0.44 (ft3/s)/mi. Using this value, the loss from the aquifer (gain to the river) along the 50 miles of river in the study area would be about 22 ft3/s in 1976.
Discharge from the aquifer by evapotranspiration is the combined evaporation from the land surface and transpiration from plants. Evapotranspiration by native vegetation is a major discharge from the aquifer. Evapotranspiration occurs at a relatively high rate near and along stream channels where the water level in the aquifer is near the land surface. For this report, evapotranspiration near the stream is termed riparian evapotranspiration. Evapotranspiration losses from the aquifer prior to 1955, except for along the river, were minimal as the average depth to water was well below the root zone of grasses and crops (see plate 1). Although water levels have risen due to the contribution from surface-water irrigation, the levels are generally below the crop root zone.
No practical methods of accurately measuring transpiration of the riparian vegetation are known. Many rivers and streams increase in flow when transpiration is greatly reduced, such as at night or after a "killing" frost. Meteorological records were compared to streamflow records to find occurrences where killing frosts, which were not accompanied by precipitation, showed an increased flow on an otherwise stable discharge hydrograph. Only one such occurrence (October 1952) was identified. Assuming this single observation was average for October and that evapotranspiration during the growing season is proportional to average solar radiation, the average annual riparian evapotranspiration was estimated to be about 3.5 ft3/s.
Withdrawal of ground water by pumping in 1976 was a major discharge from the aquifer. Pumping has increased from about 200 acre-ft in 1955 to 12,300 acre-ft in 1976 (fig. 7). The estimate of discharge was based on the number of acres irrigated, as reported to the Division of Water Resources of the Kansas State Board of Agriculture, and the amount of water applied per acre. The amount applied for irrigation per acre per year was determined from records of the Kirwin Irrigation District. Not all ground water applied for irrigation is used consumptively. Some of the water infiltrates downward into the aquifer. This is especially true in areas where the water table is near the surface and where the intervening soil becomes sufficiently saturated to transmit water.
Water is discharged from the aquifer by subsurface flow through the alluvial deposits at the lower end of the study area near Downs.
During 1946, prior to construction of Kirwin Dam, A. R. Leonard measured the depth to water in many wells, The U.S. Water and Power Resources Service also installed observation wells in the Kirwin Irrigation District during construction of the dam, and the wells have been measured regularly by the U. S. Water and Power Resources Service or by the the Kirwin Irrigation District since construction. The altitude of the water levels in 1946 is shown on plate 1.
Water levels in the aquifer, as determined by measurements during the 1976-77 winter, also are shown on plate 1. Hydrographs of water levels in selected wells, also shown on plate 1, indicate a rise in ground-water levels from 1956 (when surface-water irrigation was initiated) to 1965.
Areas where saturated thicknesses of the aquifer are greater than 25 feet, based on 1976-77 water-level data and the altitude of the bedrock surface, also are shown on plate 1. The altitude of the base of the aquifer based on data from existing test holes and logs is shown on plate 2. In areas where no testhole data were available, depths of irrigation wells were used to infer "minimum" depth to bedrock. A more precise map could be made if many more logs of test holes or wells were available.
Comparison of the water-level maps for 1946 and 1976-77 indicates that the average saturated thickness for the aquifer in the study area increased from 21 feet in 1946 to 27 feet in 1976-77. Assuming a storage coefficient (specific yield) of 0.2, the volume of water in storage increased from an estimated 230,000 acre-ft in 1946 to 275,000 acre-ft in 1976-77.
A digital model of the aquifer in the study area was made to evaluate the hydrologic system. A digital model based on the finite-difference method, described by Trescott, Pinder, and Larson (1976), was used for aquifer simulation. It was particularly desirable to evaluate the hydrologic cycle within the water-table aquifer under steady-state conditions. If the water resources in the valley are to be managed, it is necessary to determine the quantity of water entering and leaving the stream-aquifer system. Steady-state simulation of the hydrologic system before surface- and ground-water irrigation allows the evaluation of "natural" hydrologic conditions' development.
It was assumed that 1946 water-level conditions, which existed prior to construction of the dam, approximated steady-state conditions. Since closure of the dam, steady-state conditions have not existed. The quantity of water stored in the aquifer in 1946 was increased by recharge from surface-water irrigation. However, subsequent ground-water development increased discharge from the aquifer and reduced storage. Water-level conditions during 1976-77 show the effects of extended drought on recharge and the effect of increased ground-water development but do not approximate steady-state conditions.
A grid consisting of 688 nodes was used to model the aquifer system. A rectangular grid was used that corresponded with the actual subdivisions of land; each grid was 0.25 mile in the north-south direction and 0.5 mile in the east-west direction. The area-vector concept (Walton and Ackroyd, 1966) was used to distribute aquifer-system characteristics to various nodes. This concept allows a minimum number of nodes to accurately represent actual conditions.
Boundary conditions were specified to control flow at the edges of the modeled aquifer system and to distribute vertical flow within the system, as shown on plate 2. Conventions also were used for conditions of no flow, constant head, constant flow, and leakance through a streambed.
A no-flow boundary was used to simulate the effects of lateral termination of the aquifer system against relatively impermeable bedrock boundaries. The effect of having no flow across the aquifer limits was accomplished in the model by assigning zero hydraulic-conductivity values to the appropriate nodes at the no-flow boundary.
Constant-head boundaries were used to simulate subsurface inflow at the upstream end of the system and the nearly steady-state water levels in the aquifer. Flow from the constant heads is consistent with calculated estimates of subsurface flow based on saturated thickness, gradient, and hydraulic conductivity.
Constant-flow (constant flux) boundaries were used to simulate steady-flow rates into and out of the model. A constant flow was used to simulate outflow by pumping of the municipal wells nearKirwin, Cedar, Gaylord, and Downs. Constant flow was used to simulate inflow to the system from alluvium associated with tributary streams and to simulate flow into the terrace deposits along the edge of the aquifer in secs. 15, 16, 17, 22, and 23 of T. 6 S., R. 11 W. Constant flow was used to model subsurface outflow to Waconda Lake.
Constant flow also was used to simulate recharge to the aquifer from precipitation and discharge by riparian evapotranspiration. An "effective recharge" from precipitation, which is defined for this study as annual recharge from precipitation less annual loss by evapotranspiration exclusive of riparian evapotranspiration, was assumed to be a constant flow and was distributed uniformly over the aquifer. Riparian evapotranspiration at and near the river was considered separately and was simulated by discharging constant-flow conditions.
Leakage through the streambed, which allows water to transfer between the stream and aquifer, was simulated using the equation:
Q = (K'/m) Δh A, (1)
where
Q = leakage;
K'= vertical hydraulic conductivity of streambed;
m = thickness of streambed (assumed to be 1 foot);
Δh = difference in hydraulic head between water level in the stream and water level in the aquifer; and
A = area of streambed.
The ratio K'/m is termed streambed leakance.
The rates of flow, as simulated in the model, are shown in table 1. The values appear to be rational and were determined, to some degree, by the trial and error process of model calibration. Adjustments for hydraulic conductivity of the aquifer and adjustment of leakance were made across all applicable nodes. Calibration by adjusting these values at individual nodes to eliminate all residuals was not done as the results would be nearly meaningless.
Table 1--Hydrologic budget used to simulate steady-state conditions
| Hydrologic Item | Rate | ||
|---|---|---|---|
| (cubic feet per second) |
(acre-feet per year) |
||
| Recharge items | |||
| Leakage from river | 2.96 | 2,140 | |
| Subsurface inflow | 0.51 | 370 | |
| Leakage from alluvial tributaries and into terrace deposits |
3.53 | 2,560 | |
| Effective recharge from precipitation | 16.13 | 11,690 | |
| Total recharge | 23.13 | 16,760 | |
| Discharge items | |||
| Leakage to river | 18.87 | 13,670 | |
| Subsurface outflow | 0.70 | 510 | |
| Pumping | 0.12 | 90 | |
| Riparian evapotranspiration | 3.37 | 2,440 | |
| Total discharge | 23.06 | 16,710 | |
| Percent difference | 0.3 | ||
It should be emphasized that the solution listed in the table for the hydrologic budget is not unique. However, the values listed represent rational and tested estimates. The resulting water-table distribution, as shown on plate 1, can be compared to the corresponding water table based on 1946 measurements. Additionally' the simulated gain in flow from the aquifer to the river minus leakage from the river was 15.91 ft3/s, which is comparable to the increase in base flow of 11 ft3/s estimated from historic records but which is less than the 34 ft3/s estimated by Busby and Armentrout (1965).
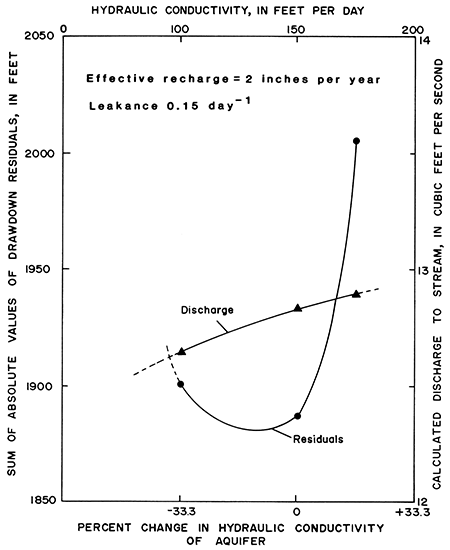
Different values, ranging from one-third less to one-sixth more than the value of 150 ft/d, were substituted for hydraulic conductivity of the aquifer. These values did change the altitude of the water table, but they did not significantly change the quantity of water lost to the stream (fig. 9). For steady-state conditions, results from the model are relatively insensitive to the value assigned for hydraulic conductivity.
Figure 9--Sensitivity of model to hydraulic conductivity.
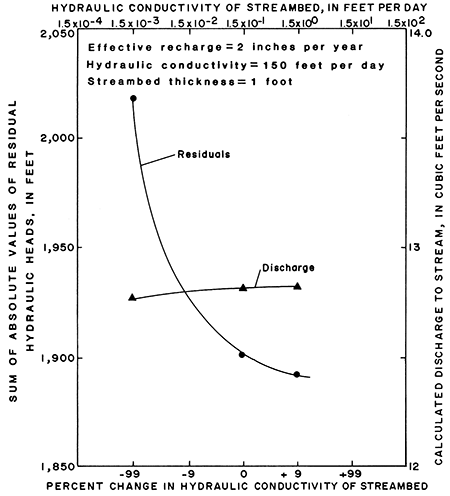
The curve relating the water gained by the stream to vertical hydraulic conductivity of the streambed is shown in figure 10. The curve shows that, for steady-state conditions, the model is relatively insensitive to values assigned to vertical hydraulic conductivity of the streambed. However, the difference between simulated and measured water levels (residuals) is sensitive to values assigned to vertical hydraulic conductivity of the streambed.
Figure 10--Sensitivity of model to hydraulic conductivity of the streambed.
The sensitivity curves indicate that the accuracy of the long-term (steady-state) hydrologic budget, as listed in table 1, is most dependent on either determination of effective recharge or net leakage to the river from the aquifer. For this analysis, differences in the values assigned to hydraulic conductivity or vertical hydraulic conductivity do not al ter greatly the total recharge and total discharge. The sensitivity curves can be used to estimate the water budget that results from using different values of streambed leakance, hydraulic conductivity, or effective recharge.
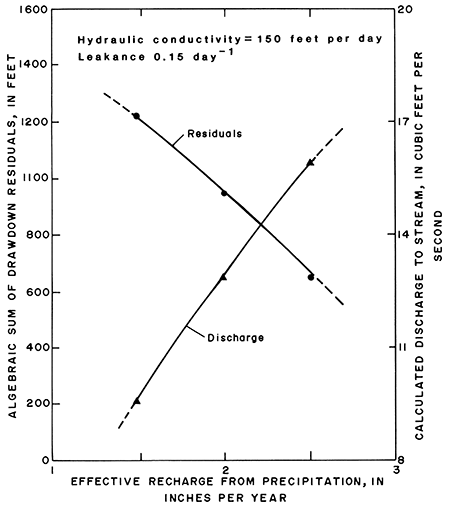
The data in table 1 indicate that effective recharge from precipitation was a major source of recharge to the aquifer before irrigation was initiated. The data in figure 11 indicate that the model of the steady-state system was very sensitive to both water-Level change and streamflow gain from effective recharge from precipitation.
Figure 11--Sensitivity of model to effective recharge from precipitation.
The results of this investigation indicate that there may have been a significant change in the rainfall-runoff relationship upstream from Kirwin Reservoir. The results, however, do not indicate any long-term change in the annual rainfall. Priorto 1977, the extreme shortage of water needed for irrigation had not occurred in Kirwin Reservoir as that which occurred in other nearby reservoirs, such as Webster and Norton.
The availability of ground water for irrigation should not change significantly if the availability of surface water for irrigation does not change significantly because recharge resulting from surface-water irrigation is a major source of water to the aquifer. Examination of figure 7 indicates that development of ground water for irrigation is proceeding rapidly. Examination of hydrographs on plate 1 indicates that water levels in the aquifer were relatively stable during 1962-74. Thus, a management question is, "Can the aquifer sustain withdrawals at the 1976 rate?" During 1976, an estimated 12,300 acre-ft or about 17 ft3/s of ground water were pumped from the large-capacity wells in the area. During the same year, a total of 27,700 acre-ft or 38 ft3/s was diverted for surface-water irrigation. If the weighted average of the two seepage measurements made in 1976 is assumed to be representative, the loss of water from the aquifer to the river would be about 22 ft3/s. (Due to the increased pumping during 1976, the gain in streamflow of 22 ft3/s is probably less than the average annual base-flow gain prior to 1976.)
For the purpose of analysis only, the following assumptions were made:
Hydrologic conditions based on these assumptions are summarized in table 2.
Table 2--Assumed hydrologic budget for 1976
| Hydrologic Item | Rate | ||
|---|---|---|---|
| (cubic feet per second) |
(acre-feet per year) |
||
| Recharge items | |||
| Subsurface inflow | 0.5 | 400 | |
| Recharge from surface water in distribution system | 12 | 8,700 | |
| Recharge resulting from water applied for irrigation | 13 | 9,400 | |
| Effective recharge from precipitation | 8 | 5,800 | |
| Leakage from terrace deposits | 3.5 | 2,500 | |
| Total recharge | 37.0 | 26,800 | |
| Discharge items | |||
| Subsurface outflow | 1 | 700 | |
| Net leakage to river | 22 | 16,000 | |
| Riparian evapotranspiration | 3.5 | 2,500 | |
| Pumping | 17 | 12,000 | |
| Total discharge | 43.5 | 31,200 | |
The sum of the discharge items is about 6.5 ft3/s greater than the sum of the recharge items. Thus, the hydrologic budget indicates that the aquifer was in a changing or transient condition during 1976. The accuracy of the assumed values are not known. However, discharge during 1976 was greater than recharge, as is evidenced by the declining water levels shown in the hydrographs on plate 1. Hydrographs of water levels in nearly all of the 28 available observation wells also showed similar declines. These water-level changes represent a decrease of water in storage. A change of water in storage produced by a decline in water levels of 1 foot during the year, assuming a specific yield of 0.2, is equivalent to 15 ft3/s. If effective recharge had been at the modeled rate of 16 ft3/s, the assumed hydrologic budget would have indicated recharge and discharge to be about equal.
Based on all the assumptions listed, pumping during 1976 reduced the amount of water in aquifer storage by about 1 to 2 percent. If no recharge occurred as a result of surface-water irrigation, the quantity of water in storage would have been reduced an estimated 3 to 5 percent. In general, the aquifers serve as excellent storage reservoirs and would sustain ground-water withdrawals at the 1976 rate for several consecutive years of drought. However, it is probable that well yields would decrease.
An overview of all of the data collected indicates that water levels were relatively stable during 1967-74, even though ground-water irrigation had increased rapidly, thus implying that additional ground-water development would be possible. Water levels at most locations had a declining trend during 1975 and 1976 that might be interpreted as overdevelopment. However, precipitation during 1976 was approximately one-half of the long-term average, and effective recharge may have been reduced by one-half or more. Thus, the analysis of data is inconclusive as to whether the aquifer can sustain a continuing increase in ground-water development.
A model of the aquifer under transient conditions would greatly improve the definition of the hydrologic budget. The model of transient conditions also would allow solution of the distribution of water with time. For example, transient simulation would allow the solution of problems such as, "How many wells can operate during a severe drought?"
Data needed for transient simulation presently are not available. These data include the quantity of ground water withdrawn annually per well, additional continuous measurements of streamflow within the study area to better define loss and gain between the aquifer and the river, and a detailed examination of streamflow records to improve the definition of base flow to increase the accuracy of the hydrologic budget. Precipitation-runoff and soil-moisture modeling also are needed to increase accuracy in determining the availability of streamflow resulting from measurable quantities of precipitation.
The assi stance of personnel from the Kansas State Board of Agriculture, Division of Water Resources, Stockton, Kans., was essential to the study. Assistance from the Director of the Kirwin Irrigation District and from personnel of the U.S. Water and Power Resources Service, McCook, Nebr., also was essential to the completion of the study. Finally, the cooperation of area residents in supplying information about wells and in aiding in hydrologic-data collection was beneficial and greatly appreciated.
Busby, M. W., and Armentrout, G. W., 1965, Kansas streamflow characteristics, base flow data: Kansas Water Resources Board Technical Report 6A, 207 p.
Dingman, R. J., 1969, Evaluation of the effects of the U. S. Bureau of Reclamation ring dike on the ground-water flow and water quality in the Downs area, Kansas: U.S. Geological Survey, Open-file Report, 20 p.
Dixon, W. J., and Massey, F. J., 1957, Introduction to statistical analysis: New York, McGraw-Hill, 488 p.
Leonard, A. R., 1952, Geology and ground-water resources of the North Fork Solomon River in Mitchell, Osborne, Smith, and Phillips Counties, Kansas: Kansas Geological Survey Bulletin 98, 150 p. [available online]
Snedecor, G. W., and Cochran, W. G., 1967, Statistical methods: Ames, Iowa Press, 593 p.
Stullken, L. E., 1980, Hydrogeologic data from north-central Kansas: Kansas Geological Survey Basic Data Series, Ground-Water Release 7, 45 p.
Trescott, P. C., Pinder, G. F., and Larson, S. P., 1976, Finite-difference model for aquifer simulation in two dimensions with results of numerical experiments: U.S. Geological Survey, Techniques of Water-Resources Investigations, book 7, ch. C-1, 116 p.
U.S. Geological Survey, 1953-77, Water resources data for Kansas, water years 1952-76: U.S. Geological Survey Water-Data Reports [issued annually].
Walton, W. C., and Ackroyd, E. A., 1966, Effects of induced streambed infiltration on water levels in wells during aquifer tests: University of Minnesota, Water Resources Research Council, Bulletin 2, 43 p.
Winslow, J. D., and Nuzman, C. E., 1966, Electronic simulation of ground-water hydrology in the Kansas River valley near Topeka, Kansas: Kansas Geological Survey, Special Distribution Publication 29, 24 p.
Wisler, C. O., and Brater, E. F., 1959 (2nd ed.), Hydrology: New York, John Wiley, 408 p.
Kansas Geological Survey
Placed on web June 11, 2013; originally published in 1981.
Comments to webadmin@kgs.ku.edu
The URL for this page is http://www.kgs.ku.edu/Publications/Bulletins/IRR6/index.html