Kansas Geological Survey, Irrigation Series 3, originally published in 1977
Originally published in 1977 as Kansas Geological Survey Irrigation Series 3. This publication is also available as an Acrobat PDF file (1.5 MB). The plate is available separately.
The availability of dependable water supplies is becoming increasingly important to the economic growth of predominantly agricultural areas in western Kansas. Because perennial flow in major streams in Ness County has been depleted by pumping, the principal supply of all water uses must be obtained from ground-water sources. Therefore a study of the availability and chemical quality of ground water is of great importance in respect to continued development of municipal, industrial, and irrigation uses.
Alluvium in the Pawnee River and Walnut Creek valleys are the most productive aquifers in Ness County, and the water is of suitable quality for most uses. Extensive development of these water sources, however, probably would impair the rights of current users. The Ogallala Formation yields water of generally suitable quality to supply as much as 250 gallons per minute to wells. This formation could be developed further for municipal, industrial, and irrigation uses. The Dakota Formation, which underlies the county at depths of 100 to 700 feet, is relatively untested. A few stock wells and one irrigation well in the Dakota produce water that is high in sodium and exceeds the recommended limit for dissolved solids in drinking water. More information is needed to evaluate the quantity and quality of water from this potential source.
Ness County is a 1,080 square-mile area in the eastern edge of the High Plains section of western Kansas. The altitude ranges from about 2,050 to 2,650 feet above sea level. The mean annual precipitation is 21.39 inches. The population in 1975 was 4,653.
Rocks significant as sources of water supply range in age from Early Cretaceous to Pleistocene. The principal aquifers are the Lower Cretaceous Dakota Formation, the Tertiary (Pliocene) Ogallala Formation, and the Quaternary alluvium. [Note: Definitions of hydrologic terms used in this report are given in the glossary.]
The Dakota Formation is the only productive aquifer that underlies the entire county. One irrigation well (19-23W-1CCB), which was drilled to a depth of 450 feet obtains water from the Dakota aquifer between 350 and 425 feet. This well yields 800 gallons per minute of water with a drawdown of 92 feet after 54 hours pumping. The transmissivity was computed to be 2,800 feet squared per day. Several wells are drilled to the Dakota for stock use. Water from the Dakota is high in sodium and exceeds the concentration limits recommended by the Kansas Department of Health and Environment for dissolved solids in drinking water. More studies are needed to test the water-yielding characteristics of the Dakota Formation and its water quality in Ness County.
The Ogallala Formation underlies the northern tier of townships, and some erosional remnants of the formation, about 15 square miles each, extend into the western part of the county. Yields of wells range from 5 to 245 gallons per minute. Seven irrigation wells irrigate 100 acres, and nine public-supply wells furnish water for a population of about 800. The saturated thickness decreases toward areas of outcrop where the formation is being drained of water along its contact with the underlying bedrock. Therefore, areas of greatest saturated thickness and potential yield are likely to be found farthest from the Ogallala outcrop. Isolated channels in the bedrock may provide increased saturated thickness where yields may exceed 245 gallons per minute, but this possibility can be verified only by test drilling. Quality of water in the Ogallala is within the recommended limits for dissolved solids in drinking water and is suitable for most uses. The Ogallala could be developed further for industrial, irrigation, or municipal uses where demands per well are less than 250 gallons per minute and where suitable quality of water is desired.
The Quaternary alluvium of Pawnee River and Walnut Creek valleys is the most productive aquifer and the least costly for construction of irrigation, industrial, or public-supply wells. The area underlain by the alluvium, however, is small compared to the total area of the county. Maximum yields from wells tapping the alluvium of the Pawnee River and Walnut Creek valleys were measured as 900 and 770 gallons per minute, respectively.
The maximum thickness of the alluvium is about 127 feet in Pawnee River valley. Wells in the alluvium and unconsolidated material in smaller valleys or draws that act as catchment basins generally are adequate for domestic and stock use and yield from 1 to 140 gallons per minute. The water is very hard and slightly exceeds the recommended limit for dissolved solids in drinking water, but is suitable for most uses.
Continuous development of wells and increased pumping along the Pawnee River and Walnut Creek valleys have lowered the water table until the streams no longer maintain base How; however, the stream channels are a source of recharge when precipitation is great enough to cause runoff. A total of about 11,000 acre-feet of ground water was pumped for irrigation and municipal uses in 1975.
Further development of ground water in these valleys for industrial and municipal use is attractive because of the large well yields that are obtainable, but extensive development would impair the rights of current users.
This report presents information on the groundwater resources of Ness County. The study was begun in 1974 as part of a cooperative program between the Kansas Geological Survey and the U.S. Geological Survey, with data and support provided by the Division of Water Resources of the Kansas State Board of Agriculture and the Division of Environment of the Kansas Department of Health and Environment.
The objective of this project is to describe the general availability and chemical quality of the ground water in Ness County with respect to municipal, industrial, and irrigation use. Increased development of water for irrigation in Ness County depends upon knowledge of the availability and chemical quality of water.
For readers familiar with or interested in the metric system, the English units of measurement given in this report are listed with equivalent metric units using the following abbreviations and conversion factors:
| English unit | Multiply by | Metric unit |
|---|---|---|
| Length | ||
| inches (in) | 2.54 | centimeters (cm) |
| feet (ft) | .3048 | meters (m) |
| miles (mi) | 1.609 | kilometers (km) |
| Area | ||
| acres | .4047 | square hectometers (hm2) |
| square miles (mi2) | 2.590 | square kilometers (km2) |
| Volume | ||
| gallons (gal) | 3.785 | liters (L) |
| acre-feet (acre-ft) | 1.233 X 10⁻³ | cubic hectometers (hm3) |
| acre-feet (acre-ft) | 1233 | cubic meters (m3) |
| barrels (for petroleum, 42 gal) |
.1590 | cubic meters (m3) |
| Flow | ||
| gallons per minute (gal/min) |
.06309 | liters per second (L/s) |
| cubic feet per second (ft3/s) |
.02832 | cubic meters per second (m3/s) |
| Hydraulic conductivity | ||
| feet per day (ft/day) | .3048 | meters per day (m/day) |
| Transmissivity | ||
| feet squared per day (ft2/day) |
.0929 | meters squared per day (m2/day) |
| Specific capacity | ||
| gallons per minute per foot [( gal/min)/ft] |
.207 | liters per second per meter [(L/s)/m] |
Ness County is located in the fourth tier of counties south of the Kansas-Nebraska border, and is the fifth county east of the Kansas-Colorado border (fig. 1). The bordering counties are Trego and Gove on the north, Lane on the west, Hodgeman on the south, and Hush and Pawnee on the east. The county extends from T. 16 S. through T.20 S. and from R. 21 W. through R. 26 W., and has an area of 1,080 square miles.
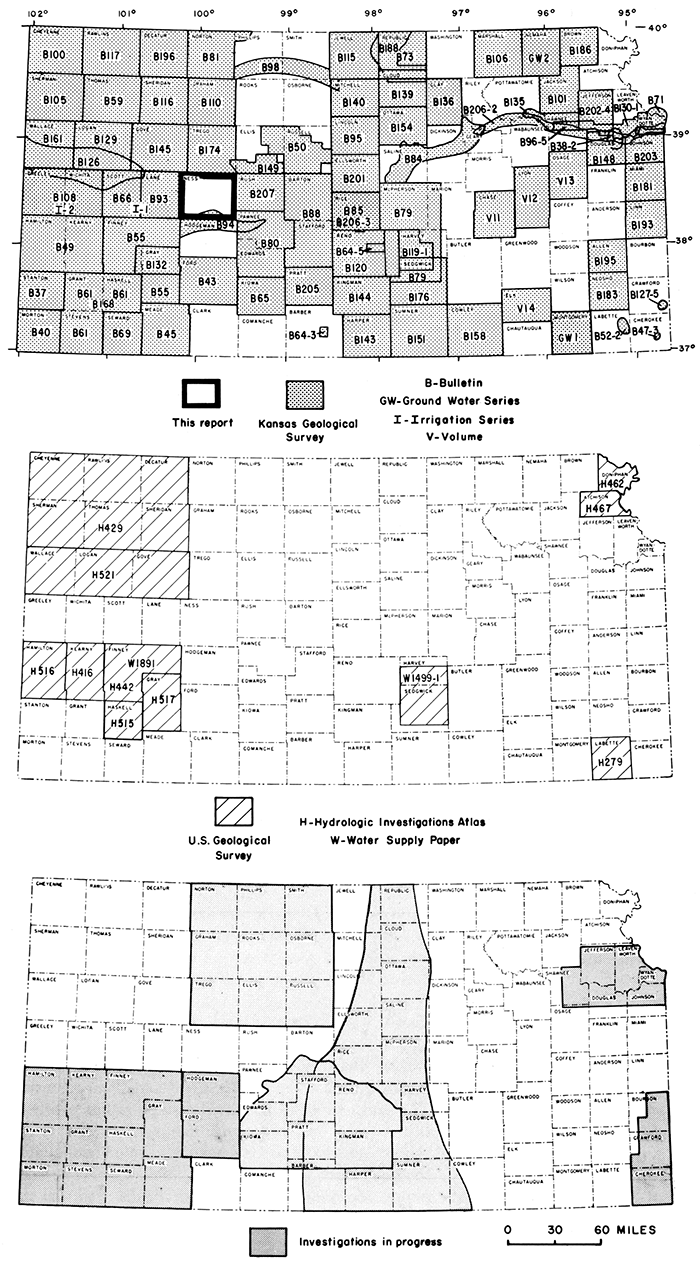
Figure 1--Index maps showing area discussed in this report, and other areas for which ground-water reports have been published or are in preparation.
The average population density for the county is 4.3 per square mile as compared with about 28 for the entire State. Ness County had a population of 4,653 (3107 in 2010, Kansas and Ness City, the county seat, 1,754 in 1975. [Note: Ness County population was listed as 3,107 in 2010 U.S. census, with a population per square mile of 2.9 (KU Institute for Policy & Social Research). Population density for the state was 34.9 in 2010. Ness City had a population of 1,449 in 2010.]
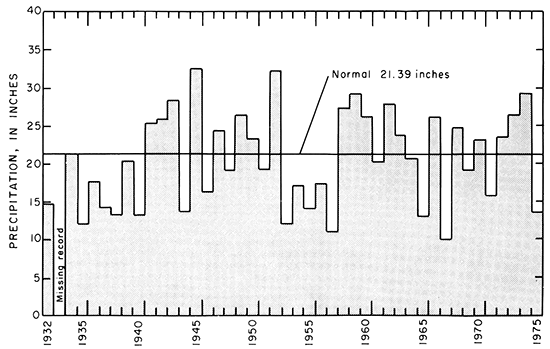
The average precipitation at Ness City is 21.39 inches per year (fig. 2). The climate of Ness County is characterized by abundant sunshine, moderate precipitation, high rates of evaporation, moderate to high wind velocities, and frequent and abrupt weather changes. Hot days and cool nights are typical in summer. During winter, temperatures are moderate to cold with occasional short periods of severe cold. Thunderstorms are prevalent in spring and summer, and blizzards occur in winter. Approximately threefourths of the precipitation in Ness County occurs from April through September, which coincides with the growing season. The growing season at Ness City averages 170 days.
Figure 2--Annual precipitation at Ness City.
Agriculture is the dominant economic activity in the county. The principal crops are wheat, milo, corn, oats, barley, and hay. Mineral resources of the county include oil and gas, sand and gravel, and limestone, in addition to ground water. During 1974, there were 604 producing oil wells in Ness County, which produced 2,690,276 barrels (Beene, 1974).
Most of Ness County is in the Arkansas River drainage basin; a narrow strip, 4 to 8 miles wide along the north edge of the county, drains into the Smoky Hill River (fig. 3). Most of Ness County drains into Walnut Creek, which heads in Lane County and flows eastward across Ness and Hush Counties to join the Arkansas River. The southern part of Ness County drains into the Pawnee River, which begins in Finney County and joins the Arkansas River at Larned. Total relief in the county is about 600 feet. The highest point, west of Utica on the divide between the Smoky Hill Hiver and Walnut Creek, is about 2,650 feet above sea level, and the lowest point, where Walnut Creek leaves Ness County, is 2,050 feet. Physiographically, Ness County lies on the eastern edge of the High Plains. The Ogallala-capped divides between the larger streams form the eastern margin of the High Plains. Because the major drainage of the area is toward the east, the divides trend and slope eastward. The south flanks of the divides slope rather gently to the streams, but the north flanks have short steep slopes. The major streams have developed flood plains, some of which are more than 2 miles wide. The flood plains, the gently sloping south flanks, and the flat divides are utilized chiefly for cultivating wheat and corn. The steeply sloping north flanks are used mostly for grazing.
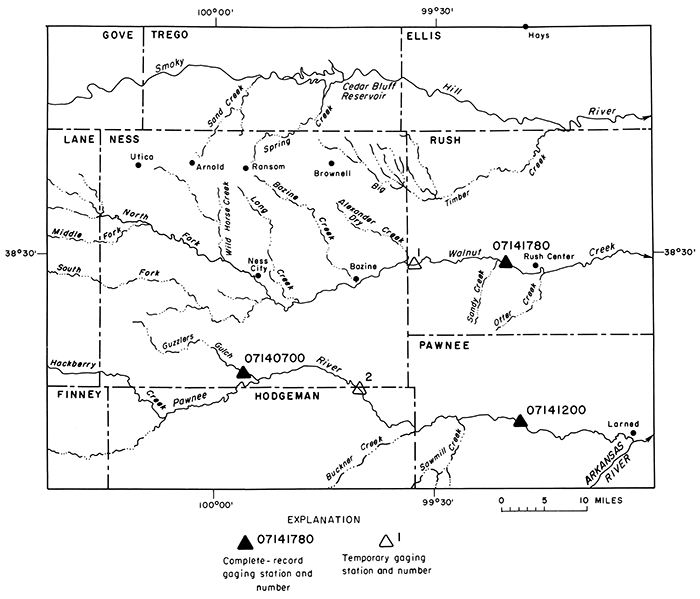
Figure 3--Drainage in Ness and adjacent counties, and location of surface-water gaging stations.
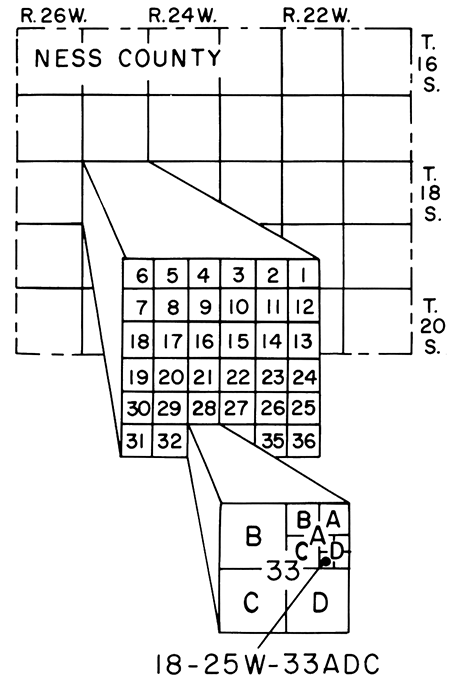
The wells and test holes are numbered in this report according to the Bureau of Land Management's system of land subdivision. In this system, the first set of digits of a well number indicates the township; the second set, the range east or west of the sixth principal meridian; and the third set, the section in which the well is located (fig. 4). The first letter denotes the quarter section or 160-acre tract; the second letter, the quarter-quarter section or 40-acre tract; the third letter, the quarter-quarter-quarter section or 10-acre tract. The 160-acre, 40-acre, and 10-acre tracts are designated A, B, C, and D in a counterclockwise direction beginning in the northeast quadrant. As an example well 18-25W-33ADC is in the SW SE NE sec. 33, T. 18 S., R. 25 W. Where two or more wells are located within a lO-acre tract, wells are numbered serially, beginning with 2, according to the order in which they were inventoried.
Figure 4--System of numbering wells.
Thanks and appreciation are expressed to the many county residents who permitted access to their property and supplied information on their wells, to municipal officials who provided information on city water supplies, to well drillers who supplied well and test-hole logs, and to oil and service companies who provided logs. Special acknowledgment is made to owners of wells that were used in making discharge, drawdown, and power-consumption measurements; to the Ness County Agricultural Extension Council; Soil Conservation District; and to Mr. Carlyle Thompson of the Fort Hays Experiment Station who provided information on wells and irrigation practices.
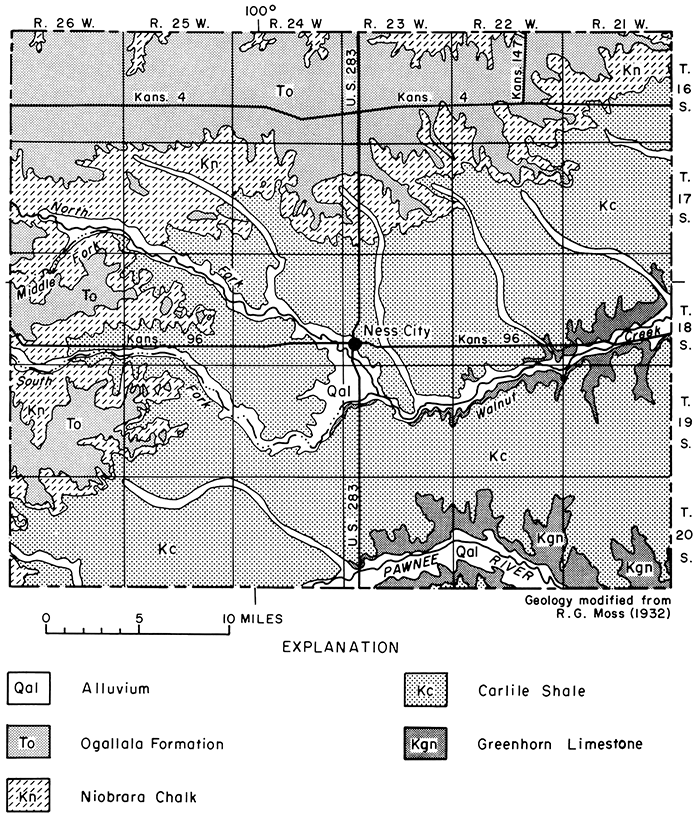
The surface rocks of Ness County are of Cretaceous, Tertiary, and Quaternary age. The Cretaceous rocks, composed of the Greenhorn Limestone, Carlile Shale, and Niobrara Chalk, are the oldest rocks exposed in the area; the Tertiary (Pliocene) Ogallala Formation is the next oldest; and the Quaternary deposits, which consist of undifferentiated Pleistocene deposits and alluvium, are the most recent. The geologic map (fig. 5) shows the formations that crop out or directly underlie a very thin mantle of undifferentiated Pleistocene deposits (loess) in Ness County.
Figure 5--Geologic map.
Rocks that are significant as sources of water supply in Ness County range in age from Early Cretaceous to Pleistocene. The Upper Cretaceous rocks, although of geologic importance, generally are not significant as aquifers. The principal aquifers in Ness County are the Lower Cretaceous Dakota Formation, the Pliocene Ogallala Formation, and the Pleistocene alluvium. The Lower Cretaceous Cheyenne Sandstone is considered to be an aquifer, but is not known to have been tapped for water supply in Ness County. The physical character and the water-supply characteristics of these aquifers and other geologic units that underlie the county are described in table 1. For a more complete discussion of the geologie units listed in table 1, the reader is referred to Bass (1926, p. 84-89) and to Moss ( 1932, p. 10-42).
Table 1--Generalized section of geologic units. The classification and nomenclature of the rock units used in this report are those of the Kansas Geological Survey and differ somewhat from those of the U.S. Geological Survey.
| System | Series | Geologic unit | Thickness (feet) |
Physical character | Water supply |
|---|---|---|---|---|---|
| Quaternary | Pleistocene | Alluvium | 0-127 | Stream-laid deposits ranging from clayey silt to coarse sand and gravel that occur along principal stream valleys. | Yields to wells commonly range from 85 to 900 gal/min in principal valleys and 1 to 40 gal/min in tributary valleys. Chemical quality of water may be objectionable for some uses in localities where thin deposits of alluvium are in contact with Upper Cretaceous rocks. |
| Undifferentiated deposits |
0-15 | Silt and fine sand, mostly eolian (loess), mantle most of the upland and mask much of the valley walls. | Most of the deposits are above the water table, but locally yield small quantities of water to wells. | ||
| Tertiary | Pliocene | Ogallala Formation |
0-100 | Sand, gravel, silt, clay, and caliche, largely unconsolidated but cemented locally by calcium carbonate or silica. | Yields 30 to 245 gal/min of water to wells in north and west parts of the area; may yield 5 gal/min or less to wells or springs along edges of outcrop. Water quality generally suitable for most uses. |
| Cretaceous | Upper Cretaceous |
Niobrara Chalk |
0-370 | Upper unit (Smoky Hill Chalk Member) consists of yellow to orange-yellow chalk and light- to dark-gray beds of chalky shale that locally weather to ochre-yellow. Lower unit (Fort Hays Limestone Member) consists of a white to yellow massive chalky limestone; contains thin beds of dark-gray to brownish-gray chalky shale. | Not known to yield significant amounts of water to wells. |
| Carlile Shale |
0-300 | Upper part consists of dark-gray to bluish-black noncalcareous to slightly calcareous shale that locally is interbedded with calcareous silty very fine-grained sandstone. Lower part consists of very calcareous dark-gray shale and thin interbedded limestone. | Not known to yield significant amounts of water to wells. | ||
| Greenhorn Limestone |
0-120 | Alternating light- to dark-gray thin-bedded chalky limestone and calcareous shale. Contains layers of bentonite. | Not known to yield significant amounts of water to wells. | ||
| Graneros Shale |
20-40 | Dark-gray calcareous shale interbedded with black noncalcareous shale. Contains thin beds of bentonite, gray limestone, and fine-grained silty sandstone. | Not known to yield significant amounts of water to wells. | ||
| Lower Cretaceous |
Dakota Formation |
150-300 | Brown to gray fine- to medium-grained sandstone interbedded with gray sandy shale and varicolored shale. Locally sandstone beds are cemented with calcium carbonate or iron oxide. | Yields as much as 800 gal/min to wells tapping loosely cemented sandstone beds, but locally may yield only small quantities from cemented beds. Water from Dakota is more mineralized than from Ogallala Formation and alluvium. | |
| Kiowa Formation |
60-170 | Dark-gray to black shale interbedded with tan and gray sandstone. | Not known to yield significant amounts of water to wells. | ||
| Cheyenne Sandstone |
50-220 | Gray to brown fine- to medium-grained sandstone interbedded with dark-gray shale. | The sandstone beds, although untested, may be a potential aquifer. Water probably too highly mineralized for most uses. |
The Cheyenne Sandstone is a gray to brown fine- to medium-grained sandstone interbedded with shale. It lies below and is separated from the Dakota Formation by the Kiowa Formation as indicated in table 1. No information was collected concerning the Cheyenne Sandstone during this study, but from an examination of oil-well geophysical logs, it is estimated to range in thickness from 50 to 220 feet in Ness County.
The Dakota Formation is the oldest formation from which water is pumped for irrigation in Ness County. It is composed of lenticular brown to gray sandstone, gray sandy shale, and varicolored shale. The sandstone beds are commonly interbedded with shale. The sandstone may be cemented with calcium carbonate or with iron oxide. The beds that are cemented with iron oxide are generally harder than others.
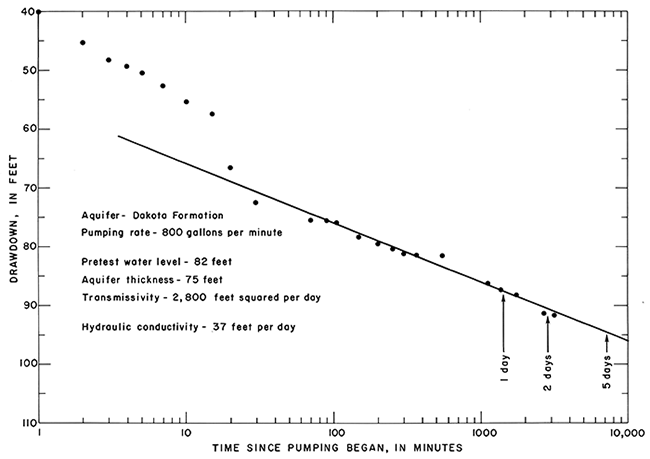
Only one large-capacity well, described at the end of this report (table 4) as well number 19-23W-1CCB, pumped water for irrigation from the Dakota aquifer in 1975. The well is used to irrigate 120 acres of corn, milo, and wheat. The depth of the well is 450 feet, and the casing is screened opposite sandstone from 350 to 425 feet. The aquifer is confined and the static water level stood at a depth of 82 feet below land surface in July 1975. The well was pumped at 800 gal/min in July 1975 with a drawdown of 88 feet after 24 hours pumping and 92 feet after 54 hours pumping. The specific capacity, therefore, was 9.1 (gal/min)/ft after 24 hours and 8.7 (gal/min)/ft after 54 hours, as given in table 4. The transmissivity and hydraulic conductivity were computed to be 2,800 ft2/day and 37 ft/day respectively, from the aquifer-test results illustrated in figure 6.
Figure 6--Aquifer-test data from well 19-23W-1CCB.
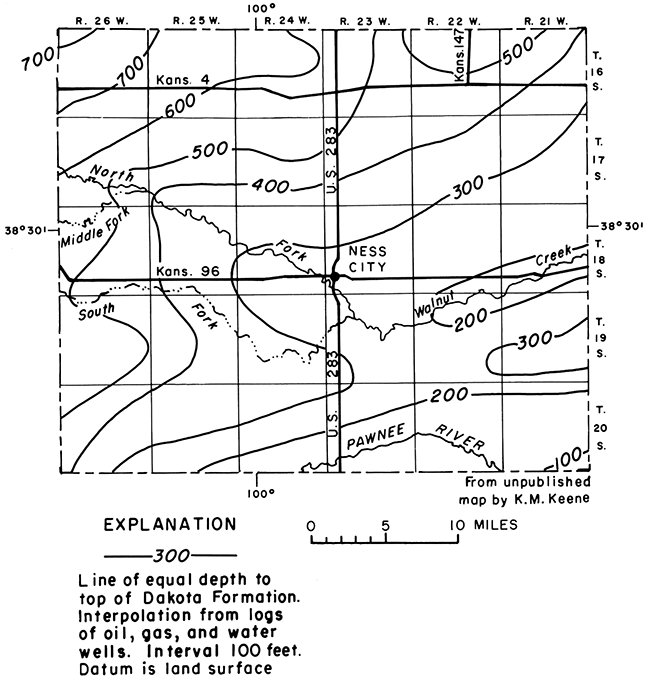
The Dakota Formation which ranges in thickness from about 150 to 300 feet, underlies all Ness County at depths ranging from about 100 to 700 feet below land surface (fig. 7). The map showing the depth to the top of the Dakota Formation in Ness County (fig. 7) was adapted from a map prepared in 1973 by K. M. Keene, Kansas Geological Survey (written commun.). It indicates that the Dakota is near land surface in the southeastern part of Ness County, but becomes increasingly deeper to the northwest. Several domestic wells have been drilled to this aquifer where shallower aquifers are missing or inadequate.
Figure 7--Generalized depth to top of the Dakota Formation.
Considerable interest exists in testing the Dakota Formation for adequate irrigation supplies. Owing to differences in lithology, the hydraulic conductivity of the sandstone is variable, and yields differ from place to place. Analysis of several test holes drilled in the vicinity of the Clouston well (19-23W-1CCB) showed that not only does the lithology of the sandstone differ within a few hundred feet, but also the depth and thickness of sandstone lenses in the Dakota Formation are unpredictable.
A well tapping the Dakota Formation anywhere in the county could be expected to yield about 20 gal/ min, but only sufficient test drilling will show where a well capable of yielding more than 100 gal/min can be constructed.
The Ogallala Formation, which consists chiefly of alluvial deposits, is the principal aquifer in western Kansas. Unfortunately, the Ogallala aquifer in Ness County is thin and largely drained by valleys cut into the bedrock. The eastern edge of the Ogallala Formation occurs as erosional remnants in the western part of Ness County and thins to the east probably owing to a lesser amount of original deposition. The Ogallala Formation is as much as 100 feet thick in northwestern Ness County. One remnant extends across two-thirds of the northern tier of townships and the other remnants, of about 15 square miles each, extend into the western part of the county (see fig. 5).
The Ogallala Formation consists of sand, gravel, silt, clay, and caliche and is largely unconsolidated, but cemented by calcium carbonate locally into "mortar beds." The materials composing the Ogallala deposits were derived from erosion of older rocks to the west, chiefly from the flanks of the Rocky Mountain uplift; however, subsequent erosion has completely removed any connection with the Rocky Mountains.
The Ogallala aquifer does not yield sufficient water in Ness County for large-scale development of irrigation, industrial, or municipal uses, but it may be a source of supply where demands are less than 250 gal/min. Reported depths of wells drilled through the Ogallala Formation range from 34 to 100 feet. The saturated thickness of the Ogallala ranges from 0 to 30 feet and the yield to irrigation wells commonly ranges from 30 to 245 gal/min. Isolated channels may exist in the bedrock where the saturated thickness is greater than 30 feet, and the yield might be greater than 245 gal/min, but none were reported during the study. Seven irrigation wells pumped from the Ogallala Formation in 1975 to irrigate about 100 acres. Nine public-supply wells furnish water for the towns of Brownell, Hansom, and Utica, which have a total population of about 800.
Domestic and stock wells generally yield 5 gal/min where the Ogallala aquifer has at least 5 feet of saturated material. Where the Ogallala is drained, residents use cisterns, haul water, or drill to the Dakota Formation for a water supply.
Alluvium underlies the flood plains and occurs along valleys of major streams and their tributaries. The principal valleys are the Pawnee River in the southern part, and Walnut Creek, which flows eastward across the center of the county (see fig. 5). The alluvium of the two valleys supplies more water for irrigation and municipal use than any other source in Ness County. However, the area underlain by the alluvium is small compared to the total area of the county.
The alluvium consists predominantly of sand, gravel, and lesser amounts of silt and clay, derived from the Ogallala Formation and Niobrara Chalk. The upper few feet of the alluvium consists predominantly of silt, clay, and sand; however, these finer deposits do not limit or seriously hinder recharge by precipitation or streamflow. The deposits are as much as 127 and 82 feet thick in Pawnee River and Walnut Creek valleys, respectively, but only 90 feet or less of the alluvium is saturated in the Pawnee River valley and 40 feet or less in Walnut Creek valley. For a more detailed discussion of the ground-water resources of Pawnee Hiver valley, the reader is referred to Fishel (1952).
Measured yields from wells along the Pawnee River valley and its tributaries range from 125 to 900 gal/ min, but yields of as much as 1,800 gal/min were reported (see table 4). Yields of 85 to 770 gal/min were measured along Walnut Creek valley.
Sixty-seven irrigation wells pump from the alluvium of Walnut Creek valley to irrigate about 2,100 acres, and 70 irrigation wells pump from the alluvium of the Pawnee River valley to irrigate about 4,800 acres. One irrigation well in Pawnee River valley was used only as an observation well in 1975. Eighteen public-supply wells furnish water for the towns of Bazine and Ness City, which have a total population of about 2,150. Smaller yielding 6-inch diameter wells supply water from the alluvium of the principal valleys and their tributaries for many domestic and stock uses.
The number of irrigation and public-supply wells is increasing each year as new wells are drilled in the alluvium of Pawnee River and Walnut Creek valleys to supplement decreasing yields that occur late in the summer. Decreasing yields result from well interference and declines in water levels.
Yields from wells in the alluvium of smaller valleys, tributaries, and draws are considerably less than in the two major valleys because of the presence of finer, less permeable materials. As a result, wells generally are adequate for only domestic or stock use, and yield 1 to 140 gal/min. These smaller valleys are underlain, to a large part, by the Carlile Shale. Because groundwater storage in the smaller valleys is limited, water levels fluctuate primarily in response to rainfall. Sometimes wells go dry after prolonged periods of little precipitation.
Chemical character of ground water in Ness County is indicated by analyses of water collected from 2 wells tapping the Dakota Formation, 2 wells tapping the Ogallala Formation, and 21 wells tapping alluvium of the Pawnee River and Walnut Creek valleys. The chemical character of water from the Cheyenne Sandstone is inferred by analysis of data from adjacent counties. Concentrations of dissolved constituents in water from wells are listed in table 5.
In the analyses of water samples for selected chemical constituents (table 5), values also are listed for dissolved solids, hardness, sodium-adsorption ratio (SAR), and specific conductance. Water containing more than 1,000 mg/L (milligrams per liter) of dissolved solids generally is objectionable for most uses. Hardness of water, expressed in terms of CaCO3 (is classified Durfor and Becker, 1964) as: soft, less than 60 mg/L, moderately hard, 61-120 mg/L, hard, 121- 180 mg/L, and very hard, more than 180 mg/L. The suitability of water for irrigation described here is based on the classification by the U.S. Salinity Laboratory Staff (1954). The salinity hazard of waters used for irrigation is determined on the basis of specific conductance, and the sodium hazard is determined on the basis of the sodium-adsorption ratio.
Analysis of water samples collected from wells tapping the Cheyenne Sandstone and examination of electric logs from adjacent counties to the east and south indicate that the water is high in dissolved-solids concentration. It probably would be unsatisfactory for most irrigation, industrial, and public-supply uses.
The Dakota Formation yields a mixed sodium bicarbonate sulfate type or a sodium chloride bicarbonate type water, based on predominant ions. The analyses of the two samples of water from the Dakota show a dissolved-solids concentration of 684 and 1,420 mg/L. This water, which has a high to very high salinity hazard and a very high sodium hazard, is considered to be marginal for irrigation of most crops and for most soil conditions. Water in the Dakota (ranging in hardness from 40 to 64 mg/L) is soft to moderately hard, but it contains more dissolved solids than water in the Ogallala and alluvium.
Wells developed in the Ogallala Formation in northwestern Ness County yield a calcium chloride bicarbonate type water. The two samples analyzed from wells 16-26W-23ABB and 16-26W-35CCD contained 297 and 446 mg/L of dissolved solids. This water, having a medium salinity hazard and a low sodium hazard, is considered to be suitable for irrigation. The water (with hardness of 208 and 334 mg/L) is very hard.
Water from the alluvium in Ness County is of the calcium bicarbonate type, and the dissolved-solids concentrations range from 404 to 794 mg/L. This water generally has a high salinity hazard and a low sodium hazard when used for irrigation. The water (ranging from 233 to 565 mg/L) is very hard.
Water from the alluvium would probably require some special practices to keep the soil salinity to a low enough level unless an excess of irrigation water is applied to cause leaching. While similar to the water from the alluvium, the water from the Ogallala Formation has a lower leaching requirement. Water from the Dakota Formation probably would cause difficulty if used for irrigation because of both soil salinity and poor tilth created by the high sodium concentration.
Maximum concentrations for use in drinking water recommended by the Kansas Department of Health and Environment are shown as follows:
| Constituent | Recommended limits in milligrams per liter |
|---|---|
| Dissolved solids | 500 |
| Iron (Fe) | .3 |
| Manganese (Mn) | .05 |
| Sulfate (SO4) | 250 |
| Chloride (Cl) | 250 |
| Fluoride (F) | 1.5 |
| Nitrate (NO3) | 45 |
Most of Ness County is within the Arkansas River drainage basin. Walnut Creek drains all Ness County except the strip on the north edge and another along the south edge. Walnut Creek begins in Lane County and flows eastward across the county into Rush County and joins the Arkansas River about 50 miles east of the Ness County border. Only a narrow strip, 4 to 8 miles wide along the north edge of Ness County drains into the Smoky Hill River to the north, as shown in figure 3. The southern part of Ness County drains into the Pawnee River, which begins in Finney County and joins the Arkansas River at Larned.
Numerous seeps and pot holes containing water were observed along the Walnut Creek drainage where it intersects the Ogallala Formation in the western and northern part of the county. The seeps act as drains along the eastern edge of the Ogallala Formation. The ground-water contribution to streamflow is not great in anyone drainage because transpiration and evaporation consume this supply within a few miles downstream, but the amount of water contributed to all the tributaries could amount to a significant figure.
Ten surface-water rights have been appropriated to divert water from Walnut Creek and two have been appropriated from Pawnee River in Ness County. In 1974, only 17 acre-feet was diverted to irrigate 25 acres along Walnut Creek and none was diverted along the Pawnee River. In 1975, no water was diverted from either stream because both the Pawnee River and Walnut Creek had no flow for many days during the 1975 irrigation season.
The status of streamflow was observed at temporary station sites (fig. 3) from July 15, 1975 to February 3, 1976, and both streams were dry until January 26, 1976. Sometime between January 26 and February 3, 1976, Walnut Creek began to flow and on February 3, 1976, had a flow of 0.48 ft3/s at temporary station 1, but the Pawnee River at temporary station 2 remained dry.
The annual discharge of principal streams that flow through Ness County is given in table 2. Locations of gaging stations are shown in figure 3.
Table 2--Annual discharge of principal streams that flow through Ness County.
| Water Year1 |
Station 07141780 Walnut Creek near Rush Center (12 mi. east of Ness County) (acre-feet) |
Station 07141200 Pawnee River near Larned (14 mi. southeast of Ness County) (acre-feet) |
Station 07140700 Guzzlers Gulch near Ness City (acre-feet) |
|---|---|---|---|
| 1970 | 17,350 | 27,650 | 243 |
| 1971 | 12,250 | 26,050 | 1,900 |
| 1972 | 17,800 | 33,000 | 636 |
| 1973 | 62,730 | 84,320 | 3,360 |
| 1974 | 16,820 | 26,120 | 2 |
| 1975 | 14,130 | 11,230 | 1,440 |
| Average | 23,4702 | 54,9903 | 1,7104 |
| 1 12-month period, October 1 through September 30 of the year shown. 2 6 years. 3 51 years. 4 14 years. |
|||
Residents along the Pawnee River and Walnut Creek valleys report that prior to pump irrigation, these streams flowed continually with enough water to support fish and to fill depressions in the stream channel that made good swimming holes. Subsequently, wells along the Pawnee River valley, both in Ness County and in counties upstream, have pumped water from the alluvium. Pumping by wells has lowered the water table below the creek bed so that water moves from the stream to the aquifer during periods of streamflow resulting from precipitation. The loss to the stream is a gain to the aquifer as recharge. Pumping along the valley also intercepts ground water that would have moved toward the stream, thereby resulting in a depletion or reduction in base flow. Likewise, pumping by wells depletes streamflow along Walnut Creek.
Better farm management in the upland dryland farming areas has reduced runoff to the streams. Terracing, farm retention dams, and tillage retard runoff and make more water available for seepage into the ground for plant use. The use of large machinery has resulted in better cultivation practices that have increased infiltration of precipitation. Yields of dryland crops have increased over the years by development of better varieties and by use of fertilizers. However, increased yields consume more of the water that has been made available, to a large part, by improved farming practices.
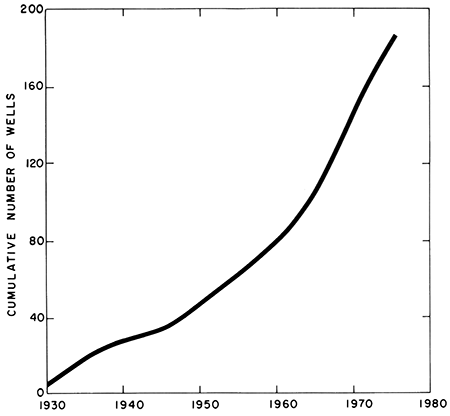
Ground-water development for irrigation began in the 1930's along the Pawnee River and Walnut Creek valleys. Early development occurred along the valleys because water levels were shallow, generally less than 30 feet, and depths to bedrock were less than 100 feet; therefore, the cost of constructing wells and pumping water was not as great in comparison to other areas where water levels exceeded 100 feet and depths to bedrock exceeded 300 feet. About 50 irrigation and public-supply wells were constructed before 1950, about 30 in the 1950's, 60 in the 1960's, and 45 during 1970-75, as shown in figure 8. All irrigation and publicsupply wells are equipped with deep-well-turbine or submersible-turbine pumps. The power units for the pumped wells are electric motors or internal-combustion engines.
Figure 8--Cumulative number of irrigation and public-supply wells constructed during 1930-75.
Location of irrigation, public-supply, and selected stock wells are shown on plate 1. Included are observation wells used to measure annual or quarterly water levels.
The most intensively developed areas are along the Pawnee River and Walnut Creek valleys. There are 71 irrigation wells located in a 24-square-mile area along the Pawnee River with 7 wells in sec. 28, T. 20 S., R. 22 W. The greatest concentration of wells along Walnut Creek is near Bazine, in sec. 31, T. 18 S., R. 21 W., where 11 irrigation and public-supply wells have been drilled.
Records of 191 wells in Ness County are presented in table 4. Included are 159 irrigation, 3 observation, 27 public-supply, and 2 stock wells. Several irrigation wells also are used as observation wells. Table 4 and plate 1 were intended to include all irrigation and public-supply wells, however, a few may not have been located. Yields listed in table 4 were measured under the operating conditions of the day of measurement and do not necessarily indicate the maximum yield of the well. Well yields generally differ during the irrigation season, and are higher in the spring after water levels have recovered a large percentage of their past season's decline. A decrease in the yield of irrigation wells in the alluvial valleys occurs during the summer because of generally lowered water levels and local well interference.
Yields from irrigation wells differ because of differences in the thickness and hydraulic conductivity of the water-bearing materials (aquifer). Measured yields ranged from 85 to 900 gal/min; estimated withdrawal was 0.4 to 4 acre-feet per day. An estimate of annual pumpage from irrigation and public-supply wells for 1975 is given in table 3.
Table 3--Estimated quantity of water pumped from irrigation and public-supply wells.
| Area | Aquifer | Number of wells |
Acres irrigated |
Population served |
Withdrawal1 in 1975 (acre-feet) |
|---|---|---|---|---|---|
| Pawnee River | Alluvium | 70 | 4,800 | 7,200 | |
| Walnut Creek | Alluvium | 67 | 2,100 | 3,150 | |
| Walnut Creek | Alluvium | 18 | 2,1502 | 480 | |
| Uplands | Ogallala | 7 | 100 | 150 | |
| Uplands | Ogallala | 9 | 8003 | 180 | |
| Uplands | Dakota | 1 | 120 | 180 | |
| TOTAL | 11,340 | ||||
| 1 Assuming: 1.5 feet of water applied annually per acre; 200 gallons daily use per person. 2 Number of persons served in Bazine and Ness City. 3 Number of persons served in Brownell, Ransom, and Utica. |
|||||
Energy for irrigation and public-supply wells is from electricity, LPG (liquefied petroleum gas), diesel, or gasoline. The most common sources of energy in Ness County are electricity and LPG. The amount of electricity or fuel to pump 1 acre-foot of water was determined by measuring the rate of discharge and the amount of electricity or fuel used per unit of time at selected wells.
Electrical records can be obtained from utility companies that maintain records of consumption by month and year. Invoices of other fuels are supplied to purchasers by vendors at the time of purchase. The amount of water pumped per well or area is directly related to the amount of energy consumed. Therefore, a record of the amount of electricity or fuel used for irrigation can be used to estimate the amount of water pumped per month or year.
Electrical-energy input to pump an acre-foot of water is determined by applying the equation:
Ee = [(1.955 X 10⁴) R Kh] / Q te
where
Ee = kilowatt-hours to pump 1 acre-foot of water (Kwhr/acre-ft);
R = revolutions of meter disc in t, seconds;
Kh = constant for each meter (generally stamped on nameplate of the instrument) giving watt-hours represented by one revolution of meter disc;
Q = pump discharge, in gallons per minute;
te = time, in seconds, for the meter disc to make H revolutions.
Example:
R = 10 revolutions in te seconds;
te = 40 seconds;
Kh = 24;
Q = 1,000 gallons per minute;
Ee = (1.955 X 104 X 10 X 24) / 1,000 X 40
= 117 kilowatt-hours per acre-foot,
The amount of fuel-energy input to pump an acre-foot of water is determined by applying the equation:
Ef = [(5.431 X 10³) tf] / Q
where
Ef = gallons of fuel to pump 1 acre-foot of water (gal/acre-ft);
Q = pump discharge in gallons per minute;
tf = gallons of fuel consumed per hour.
The amount of electricity to pump an acre-foot of water in the Pawnee River and Walnut Creek valleys, as measured at 43 wells, ranged from 97 to 416 Kwhr and averaged 160 Kwhr; the amount of LPG fuel, measured at 14 wells, ranged from 14 to 59 gallons and averaged 34 gallons; and the amount of diesel fuel was 12 and 18 gallons, as measured at two wells. Fifty-four gallons of LPG fuel were consumed per acre-foot of water pumped from the Dakota Formation.
The quantity of water pumped from irrigation wells, for which energy-consumption and pump-discharge data are available, is computed from the following equation:
A = Kwhr / Ee
or
A = F / Ef
where
A = water pumped from well during the month or year, in acre-feet;
Kwhr = kilowatt-hours of electrical energy consumed during the month or year (the records generally are available from power company);
F = gallons of fuel energy consumed during the month or year.
Power consumption varies with differences in motor, pump, well efficiency, and total head. Inadequate maintenance and improper operating procedures reduce both the efficiency and the life of pumping equipment.
The water table or potentiometric surface is not stationary, but fluctuates much like the water surface of a lake or reservoir. The water table rises when recharge exceeds discharge and deelines when discharge exceeds recharge. In Ness County, the alluvium and Ogallala aquifers are unconfined ground-water bodies (water table), and the Dakota is a confined groundwater body (artesian).
The principal factors controlling decline are the amount of water drawn from thc ground-water reservoir by transpiration and evaporation, the amount discharged into streams through springs and seeps, and the amount pumped from wells.
The principal factors controlling a rise in water table are direct infiltration of precipitation, seepage of water from streams, and percolation of irrigation water applied to the land. Local rises in the water table may occur near a well or well field after a pumping season as water moves laterally to restore the normal water-table gradient.
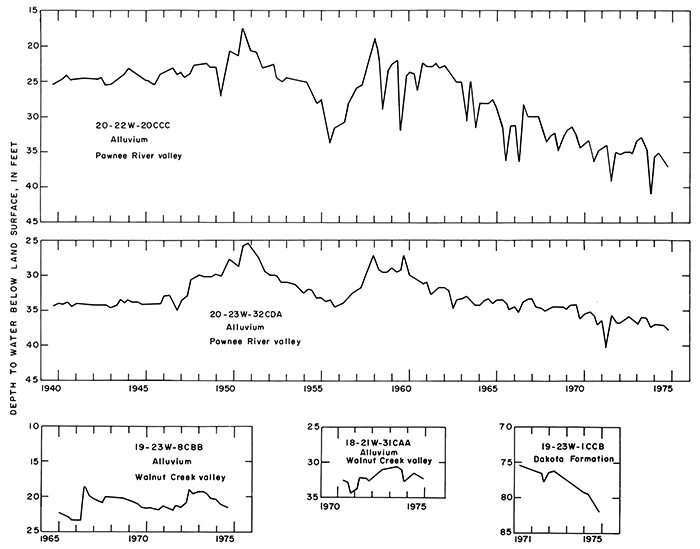
The alluvium in Ness County is recharged by precipitation, by seepage of water from streams, and by infiltration of irrigation water. Residents along the Pawnee River and Walnut Creek valleys reported that at times the streams have flowed continually. This occurs when the water table in the alluvium is higher than the stream, thus contributing a base flow to the stream through springs and seeps. In recent years, the streams are dry much of the time because pump age and evapotranspiration exceed the amount of natural recharge to the system. The hydrographs for wells 20-22W-20CCC and 20-23W-32CDA along the Pawnee River valley, as shown in figure 9, reflect both the effects of precipitation and pumping. Water levels were fairly constant during the 1940's; that is, recharge and discharge were nearly equal. During 1950 and 1951, water levels rose as a result of above-normal precipitation. During 1952-56, water levels declined as more ground water was discharged to streamflow, transpired through plants along the valley, and pumped by wells. Water levels again responded to recharge from abovenormal precipitation in 1958-60, then began a gradual decline of about 0.8 feet per year from 1960 to 1975 with some partial recovery during years of abovenormal precipitation. The continuous development of wells along the Pawnee River, both in Ness County and upstream, has lowered the water table until there is essentially no base flow to the stream.
Figure 9--Hydrographs for selected wells.
During 1975, small pools or sumps were occasionally present in both the Pawnee River and the Walnut Creek streambeds that contained water. However, most of the ground-water contribution, if any, was consumed by evaporation from the water surface of the pools and by transpiration through trees and plants along the stream channels. In reality, the water level in the alluvium was below the streambed; therefore, during any period of streamflow from precipitation, water is lost from the stream to the ground-water reservoir and is a source of recharge to the aquifer. In one respect, lowering the water level is beneficial because it provides space for percolation of excess runoff that occurs during high streamflow and flooding. Thus, stream channels in the alluvial valleys are line sources of recharge when precipitation is great enough to cause runoff.
Wells along Walnut Creek also have practically dried up the base flow, and streamflow occurs only during periods of sufficient precipitation. Hydrographs for observation wells 19-23W-8CBB and 18-21W-31CAA along Walnut Creek valley (fig. 9) indicate that water levels rose in 1967, then declined until 1971-72. Water levels rose again during the 1972-74 period because of above-normal precipitation.
Ground water pumped from the alluvial valleys of Ness County is renewable during periods of abovenormal precipitation; however, pumpage for irrigation is great enough to cause depletions during dry periods.
Gillespie and Slagle (1972) report that recharge from high flows in Walnut Creek and its tributaries can be substantial. High flows produced water-level rises in observation wells in adjacent Hush County of about 6 to 14 feet in 1959, about 2 to 11 feet in 1967, and about 0.5 to 4 feet in 1970.
Declining water levels occur in the alluvium of the tributary valleys and upland draws during extended periods of below-normal rainfall, with subsequent drying up of wells. In addition, because of the relatively shallow depth to water, transpiration by deep-rooted plants during the growing season often results in a decline in water levels.
In contrast to the alluvium, the Ogallala Formation in Ness County receives very little recharge. Annual recharge from precipitation is estimated to be about 0.25 inch or about 1 percent of the average precipitation. The water level in the Ogallala, for the most part, is above the stream valleys. Only small valleys exist in the western part of Ness County where the Ogallala is present. Streams have eroded through the Ogallala into the bedrock, and in this way, act as drains. This has been occurring for a long period of time, so discharge from the Ogallala is about equal to recharge. The amount of ground water draining from the Ogallala to each valley is small, but the amount of water contributed to all tributary valleys could be significant. Field inspections during October and November 1975 revealed only small trickles of less than 0.1 ft3/s from seeps along contacts of the Ogallala with the bedrock. The seepage, which filled sumps along the channel, subsequently was lost through evaporation, transpiration, or seepage into cracks of the bedrock before reaching the principal valleys of the Pawnee River and Walnut Creek in Ness County and the Smoky Hill River in Trego County. The seeps are enough to support tree growth and grass. Very few wells have been drilled into the Ogallala (see table 4) because the saturated material is thin and, to a large part, drained. Therefore, water-level fluctuations are small because discharge and recharge are small.
The Dakota Formation receives no known recharge in Ness County. Nearest areas of recharge are in adjacent counties to the east and south along outcrops and where the alluvium of deep valleys is in contact with the underlying Dakota. The hydrograph (fig. 9) of irrigation well 19-23W-1CCB, which taps the Dakota, indicates that the water level (potentiometric surface) is declining about 1.5 feet per year. This decline probably is the result of ground-water withdrawals at this site because the nearest irrigation well tapping the same aquifer is more than 15 miles.
The greatest potential for future development of ground water in Ness County is from the Dakota Formation. This aquifer is areally extensive and is the only developed aquifer that underlies the entire county. Well 19-23W-1CCB, in 1975, yielded 800 gal/min for irrigation from the Dakota. The performance of the well and fluctuations of water level are shown in figures 6 and 9, respectively. Several irrigation wells tap the Dakota in Hodgeman County, which adjoins Ness County on the south.
The Dakota differs greatly in lithology and degree of cementing. In general, the cementing reduces the hydraulic conductivity of the aquifer. Yields of wells a few hundred feet apart differ by several hundred gallons per minute.
The quality of water available from the Dakota for irrigation use is speculative because the concentration of sodium may be high enough to affect the tilth of calcium soils. This, however, is the only ground water in Ness County that is soft to moderately hard. Extensive tests to monitor the effects of using high sodium water from the Dakota Formation for irrigation in Ness County are being conducted by the Fort Hays Experiment Station at the site of irrigation well 19- 23W-1CCB. Although water from the Dakota may be considered as a supply for industrial, irrigation, and municipal use, its quality should be considered in connection with the economic feasibility of treatment for the intended use.
More studies are needed to test the performance of the Dakota aquifer and its water quality throughout western Kansas. Much interest has been shown in developing a water supply from the Dakota where the Ogallala Formation is missing or inadequate and where additional ground water is needed to supplement existing supplies.
Although the Ogallala in Ness County yields less than 250 gal/min to wells, it probably stores as much or more water than the alluvium because of its greater areal extent. The saturated thickness of the Ogallala decreases toward the edges of the areas of outcrop (see fig. 5), where it is being drained of water along its contact with the underlying bedrock. Likewise, its saturated thickness should be greatest farthest from the outcrops. Therefore, areas such as those along Kansas Highway No. 4, which connects the towns of Utica, Arnold, Ransom, and Brownell, and along the western tier of R. 26 W. in Tps. 18 and 19 S. could be sites for further exploration for water in the Ogallala (see figs. 3 and 5).
The Ogallala could be developed further for industrial, minor irrigation, or municipal use in northern and western Ness County if demands are less than 250 gal/min per well and if good quality water is desired. Generally, industries and municipalities can afford to pay more per unit of water than thc irrigator. Thus, more wells can be constructed to supply these needseven though the wells may yield only 50 to 100 gal/min. Land acquisition and well spacing would be factors in developing water stored in the Ogallala, as construction of wells too near or too far apart may not provide best utilization of the ground-water supply. For ultimate development of the Ogallala aquifer in Ness County, construction of a well on every 10-acre tract might be possible in some areas, but management policy might prohibit this practice.
New wells are being drilled into the alluvium of Pawnee River and Walnut Creek valleys in Ness County to maintain irrigation supplies when well yields decrease late in the season owing to well interference and water-level declines.
The greatest concentration of large-capacity wells, those with yields of 100 gal/min or more, is along the entire length of the Pawnee Hiver reach and in the vicinities of Bazine and Ness City along Walnut Creek (see pl. 1). Water stored in the alluvium is depleted gradually year after year and is replenished only in years of excess precipitation, such as 1950-51 and 1958-60. Since 1961, water levels have declined steadily at the rate of about 0.8 feet per year in response to significant increases in the amount of ground water pumped. Because of the high transmissivity and limited storage capacity of the alluvial aquifer, it can be depleted readily by heavy pumping, as well as recharged when excess precipitation and streamflow occur.
Further development of ground water along these valleys for industrial and municipal use is attractive because of the large well yields that are obtainable from rather shallow wells, but extensive development would impair the rights of current users. Unless management restrictions are imposed, ground-water development in these two major valleys will no doubt continue.
The potential for developing any great amounts of water from alluvium and undifferentiated deposits in tributary creek valleys and draws that overlie the Carlile Shale is not very promising. However, these deposits may contain small amounts of water and serve as local catchment basins to yield small quantities for domestic and stock use. The water in these deposits is reported to be of poorer quality than that from the alluvium of the principal valleys.
Bass, N. W., 1926, Geologic investigations in western Kansas pt. 3, Geologic structure of the Dakota Sandstone of western Kansas: Kansas Geol. Survey, Bull. 11, pt. 3, p. 84-89. [available online]
Beene, D. L., 1974, 1972 Oil and gas production in Kansas: Kansas Geol. Survey, Energy Resources Series 2, 149 p.
Durfor, C. N., and Becker, Edith, 1964, Public water supplies of the 100 largest cities in the United States, 1962: U.S. Geol. Survey, Water-Supply Paper 1812, 364 p. [available online]
Ferris, J. G., Knowles, D. B., Brown, R. H., and Stallman, R. W., 1962, Theory of aquifer tests: U.S. Geol. Survey. Water-Supply Paper 1536-E, 174 p. [available online]
Fischel, V. C., 1952, Ground-water resources of Pawnee Valley, Kansas: Kansas Geol. Survey, Bull. 94, 144 p. [available online]
Gillespie, J. B., and Slagle, S. E., 1972, Natural and artificial ground-water recharge, Wet Walnut Creek, central Kansas: Kansas Water Resources Board Bull. 17, 94 p.
Gutentag, E. D., Lobmeyer, D. H., McGovern, H. E., and Long, W. A., 1972, Ground water in Finney County, southwestern Kansas: U.S. Geol. Survey Hydrol, Inv. Atlas, HA-442. [available online]
Gutentag, E. D., and Stullken, L. E., 1976, Ground-water resources of Lane and Scott Counties, western Kansas: Kansas Geol. Survey, Irrig. Ser. No. 1, 37 p. [available online]
Hattin, D. E., 1975, Stratigraphy and depositional environment of Greenhorn Limestone (Upper Cretaceous) of Kansas: Kansas Geol. Survey, Bull. 209, 128 p. [available online]
Hodson, W. G., 1965, Geology and ground-water resources of Trego County, Kansas: Kansas Geol. Survey, Bull. 174, 80 p. [available online]
Hodson, W. G., and Wahl, K. D., 1960, Geology and groundwater resources of Gave County, Kansas: Kansas Geol. Survey, Bull. 145, 126 p. [available online]
Kansas State Board of Health, 1973, Water quality criteria for interstate and intrastate waters of Kansas: Kansas State Board of Health Regulations 28-16-28, 5 p.
Latta, B. F., 1944, Geology and ground-water resources of Finney and Gray Counties, Kansas: Kansas Geol. Survey, Bull. 55, 272 p. [available online]
Lohman, S. W., and others, 1972, Definitions of selected ground-water terms--revisions and conceptual refinements: U.S. Geol. Survey, Water-Supply Paper 1988, 21 p. [available online]
McClain, T. J., Jenkins, E. D., Keene, K. M., and Pabst, M. E., 1975, Water resources of Gove, Logan, and Wallace Counties, west-central Kansas: U.S. Geol. Survey, Hydrol. Inv. Atlas, HA-521.
McLaughlin, T. G., 1949, Geology and ground-water resources of Pawnee and Edwards Counties, Kansas: Kansas Geol. Survey, Bull. 80, 189 p. [available online]
McNellis, J. M., 1973, Geology and ground-water resources of Rush County, central Kansas: Kansas Geol. Survey, Bull. 207, 45 p. [available online]
Merriam, D. F., 1957, Preliminary regional structural contour map on top of the Dakota Formation (Cretaceous) in Kansas: Kansas Geol. Survey, Oil and Gas Inv. 15, map.
Meyer, W. R, Gutentag, E. D., and Lobmeyer, D. H., 1970, Geohydrology of Finney County, southwestern Kansas: U.S. Geol. Survey, Water-Supply Paper 1891, 117 p. [available online]
Moss, R. G., 1932, Geology of Ness and Hodgeman Counties, Kansas: Kansas Geol. Survey, Bull. 19, 48 p. [available online]
Muilenburg, Grace, and Swineford, Ada, 1975, Land of the post rock: Univ. Press of Kansas, 207 p.
Prescott, G. C., Jr., 1951, Geology and ground-water resources of Lane County, Kansas: Kansas Geol. Survey, Bull. 93, 126 p. [available online]
Stullken, L. E., Weakley, E. C., Gutentag, E. D., and Slagle, S. E., 1974, Hydrogeologic data from Greeley, Wichita, Scott, and Lane Counties, Kansas: Kansas Geol. Survey, Basic Data Series, Ground-Water Release No. 4, 58 p.
U.S. Department of Commerce, 1975, Climatological data (Kansas): U.S. Dept. of Commerce Pub., v. 88, no. 13.
U.S. Geological Survey, 1976, Water resources data for Kansas, Water year 1975: Lawrence, Kans., Water Resources Div., Water-Data Report KS-75-1, 405 p.
U.S. Salinity Laboratory Staff, 1954, Diagnosis and improvement of saline and alkali soils: U.S. Dept. Agriculture Handb. 60, 160 p.
Most of the definitions of hydrologic terms given below are taken from Lohman and others (1972).
Aquifer--Formation, group of formations, or part of a formation that contains sufficient saturated permeable material to yield significant quantities of water to wells and springs.
Aquifer test--Measurements of the effect with time of a discharging well on the water level in tire well and in nearby wells. Data from aquifer tests are used primarily to determine the hydraulic conductivity, transmissivity, and storage coefficient or specific yield of an aquifer.
Artesian--Synonymous with confined. Artesian water is equivalent to confined ground water. The water level in an artesian well stands above the top of the artesian water body it taps. If the water level in an artesian well stands above the land surface, the well is a flowing artesian well.
Confined ground water--Ground water that is under pressure significantly greater than atmospheric, and has as its upper limit the bottom of a bed of distinctly lower hydraulic conductivity than that of the material in which the confined water occurs.
Drawdown--The lowering of the potentiometric surface as a result of pumping. It is the arithmetic difference between the pumping level and the static level of the water surface.
Hydraulic conductivity--If a porous medium is isotropic and the fluid is homogeneous, the hydraulic conductivity of the medium is the volume of water at the existing kinematic viscosity that will move in unit time under a unit hydraulic gradient through a unit area measured at right angles to the direction of flow.
Percolation--Laminar flow of water, usually downward, by tire force of gravity or under hydrostatic pressure, through small openings within a porous material.
Potentiometric surface--A surface that represents the static head. As related to an aquifer, it is defined by the levels to which water will rise in tightly cased wells.
Saturated thickness--The amount (thickness) of aquifer material that contains all the water in interstices that it is capable of holding.
Specific capacity--The rate of discharge of water from a well divided by the drawdown of water level within the well.
Transmissivity--The rate at which water of tire prevailing kinematic viscosity is transmitted through a unit width of the aquifer under a unit hydraulic gradient.
Unconfined ground water--Water in an aquifer that has a water table.
Water table--That surface in an unconfined ground-water body at which the water pressure is atmospheric. It is defined by the levels at which water stands in wells that penetrate the water body enough to hold standing water. The water table is a particular potentiometric surface.
Table 4--Records of selected wells.
| Well number (1) |
Owner or user | Year completed |
Depth of well (2) |
Diameter of casing (inches) |
Geologic unit (3) |
Method of lift and type of power (4) |
Use (5) |
Yield (gallons per minute) (6) |
Specific capacity | Altitude of land surface above mean sea level (feet) (8) |
Depth to water below land surface datum (feet) (9) |
Date of measurement (10) |
Chemical data (11) |
Acres irrigated |
Power consumption per acre-foot |
||
|---|---|---|---|---|---|---|---|---|---|---|---|---|---|---|---|---|---|
| Gallons per minute per foot of drawdown (7) |
Hours | KWH (12) |
Gallons of fuel |
||||||||||||||
| 16-22W-27BAA | City of Brownell | 1953 | 65R | 18 | TO | T,E | PS | 165 R | 47 R | 1953 | |||||||
| 16-24W-15ABB | F. H. Flax | 1956 | 38R | 24 | TO | SUB,E | I,O | 29.9 | 1/1975 | ||||||||
| 16-24W-15ACA | F. H. Flax | 1956 | 41 R | 24 | TO | SUB,E | I | 215 | 44 | 23.7 | 1/1975 | 10 | 149 | ||||
| 16-24W-15ACC | F. H. Flax | 1972 | 84 R | 12 | TO | SUB,E | I | 245 | 20 | 64 R | 1972 | 25 | 100 | ||||
| 16-24W-15ADB | F. H. Flax | 1956 | 42 R | 24 | TO | SUB,E | I | 215 | 35 | 21.5 | 1/1975 | 10 | 193 | ||||
| 16-24W-15DDD | City of Ransom | 1938 | 40 R | 8 | TO | T,E | PS | 150 R | 28.0 | 3/1976 | |||||||
| 16-24W-15DDD2 | City of Ransom | 1938 | 40R | 8 | TO | T,E | PS | 150 R | 28.0 | 3/1976 | |||||||
| 16-24W-15DDD3 | City of Ransom | 1968 | 40 R | 8 | TO | T,E | PS | 150 R | 28.0 | 3/1976 | |||||||
| 16-26W-23ABB | City of Utica | 1956 | 34 R | 18 | TO | T,E | PS | 30 R | 24 R | 1956 | C | ||||||
| 16-26W-35CCD | City of Utica | 1953 | 40 R | 13 | TO | T,E | PS | 40 R | 2568 | 30 R | 1953 | C | |||||
| 16-26W-35CDC | City of Utica | 1953 | 35 R | 18 | TO | T,E | PS | 60 R | 2562 | 25 R | 1953 | ||||||
| 17-25W-7AA | Duane Stutz | 1949 | 35 R | 24 | QA | T,E | I | 120 R | 25 R | 1949 | 5 | ||||||
| 17-25W-7AA2 | Duane Stutz | 1951 | 39 R | 16 | QA | T,E | I | 110 R | 22 R | 1951 | 5 | ||||||
| 17-25W-7AA3 | Duane Stutz | 1970 | 40 R | 16 | QA | T,E | I | 65 R | 25 R | 1970 | 5 | ||||||
| 17-25W-7AA4 | Duane Stutz | 1970 | 45 R | 16 | QA | T,E | I | 35 R | 30 R | 1970 | 5 | ||||||
| 17-25W-7AA5 | Duane Stutz | 1970 | 38 R | 16 | QA | T,E | I | 100 R | 22 R | 1970 | 5 | ||||||
| 17-25W-7AA6 | Duane Stutz | 1970 | 39 R | 16 | QA | T,E | I | 120 R | 20 R | 1970 | 5 | ||||||
| 17-25W-7AA7 | Duane Stutz | 1973 | 40 R | 16 | QA | T,E | I | 200 R | 20 R | 1973 | 5 | ||||||
| 17-25W-8BB | Duane Stutz | 1970 | 25 R | 16 | QA | T,E | I | 140R | 5 R | 1970 | 5 | ||||||
| 17-25W-8BB2 | Duane Stutz | 1973 | 12 R | 16 | QA | T,E | I | 110 R | 5 R | 1973 | 5 | ||||||
| 17-25W-8BB3 | Duane Stutz | 1973 | 35 R | 16 | QA | T,E | I | 65 R | 20 R | 1973 | 5 | ||||||
| 17-26W-2BAA | City of Utica | 1956 | 52 R | 18 | TO | T,E | PS | 40 R | 2562 | 40 R | 1956 | ||||||
| 17-26W-2BAB | City of Utica | 1966 | 40 R | 18 | TO | T,E | PS | 50 R | 2552 | ||||||||
| 18-21W-24ACA | James Seltman | 1974 | 62 R | 16 | QA | T,E | I | 520 | 47 | 2098 | 41.0 | 9/1975 | 50 | 135 | |||
| 18-21 W-24BAC | James Seltman | 1974 | 80 R | 16 | QA | T,E | I | 675 R | 2110 | 45.0 | 11/1974 | 133 | |||||
| 18-21 W-25AAA | Lon Wells, Jr. | 1965 | 50 R | 16 | QA | T,E | I | 350R | 2085 | 30.7 | 11/1974 | 22 | |||||
| 18-21 W-25AAB | Lon Wells, Jr. | 1966 | 50 R | 16 | QA | T,E | I,O | 275 R | 2085 | 28.6 | 11/1974 | 23 | |||||
| 18-21W-27CBC | E. H. Marshall | 1967 | 48 R | 16 | QA | C,E | I | 300 R | 2100 | 32.0 | 11/1974 | 50 | |||||
| 18-21 W-30ACB | Emanuel Kuehn | 1973 | 32 R | 24 | QA | T,G | I | 200 R | 2122 | 20 R | 1973 | 22 | |||||
| 18-21W-31ACA | Glenn Schniepp | 1970 | 52 R | 16 | QA | T,LPG | I | 350 R | 2123 | 27.5 | 12/1974 | 55 | |||||
| 18-21W-31CAA | George Diemer | 44 R | 5 | QA | O | 2122 | 33.8 | 12/1971 | |||||||||
| 18-21W-31CAB | City of Bazine | 1935 | 48 R | 12 | QA | T,E | PS | 150 R | 2126 | ||||||||
| 18-21W-31CAD | City of Bazine | 1950 | 48 R | 12 | QA | T,E | PS | 220 R | 2127 | ||||||||
| 18-21W-31CCA | Reuben Dewald | 1957 | 49 R | 19 | QA | T,T | I | 230 R | 2131 | 35.0 | 11/1974 | 5 | |||||
| 18-21W-31CCC | Reuben Dewald | 1961 | 62 R | 19 | QA | T,E | I | 60 R | 2132 | 42.7 | 11/1974 | 2 | |||||
| 18-21W-31CDBB | Reuben Dewald | 1957 | 49 R | 18 | QA | T,T | I | 330 R | 2129 | 34.9 | 11/1974 | 6 | |||||
| 18-21W-31CDBC | Waldimore Strecker | 1935 | 54 R | 18 | QA | T,T | I | 400 R | 2129 | 35.0 | 11/1974 | 26 | |||||
| 18-21W-31DBA | Glenn Schniepp | 1965 | 36 R | 16 | QA | T,E | I | 175 R | 2118 | 18.1 | 12/1974 | 25 | |||||
| 18-21W-31DBB | Glenn Schniepp | 1971 | 48 R | 16 | QA | T,E | I | 50 R | 2126 | 30.1 | 12/1974 | 25 | |||||
| 18-21W-31DBD | Glenn Schniepp | 1965 | 50 R | 16 | QA | T,E | I | 175 R | 2121 | 32.7 | 12/1974 | 25 | |||||
| 18-22W-13DCC | J. F. Wunder | 1967 | 21 R | 15 | QA | SUB,E | I | 30 R | 2148 | 97.5 | 11/1974 | 7 | |||||
| 18-22W-13DCC2 | J. F. Wunder | 1967 | 21 R | 15 | QA | SUB,E | I | 50 R | 2148 | 7 | |||||||
| 18-22W-13DCC3 | J. F. Wunder | 1967 | 21 R | 15 | QA | SUB,E | I | 75 R | 2148 | 8 | |||||||
| 18-22W-13DCC4 | J. F. Wunder | 1974 | 21 R | 15 | QA | SUB,E | I | 30 R | 2148 | 7 | |||||||
| 18-22W-16ADD | Vernon Schwartz | 1939 | 52 R | 16 | QA | T,LPG | I | 140 | 2204 | 30.8 | 11/1974 | 14 | |||||
| 18-22W-35DCA | Larry Kleweno | 1974 | 55 R | 16 | QA | T,E | I | 440 R | 2142 | 30.8 | 11/1974 | 60 | |||||
| 18-22W-35DCC | Larry Kleweno | 1974 | 53 R | 16 | QA | T,E | I | 31S R | 2142 | 31.5 | 11/1974 | 24 | |||||
| 18-22W-36DCC | Galen Ely | 1956 | 5S R | 18 | QA | T,G | I | 400 R | 2134 | 34.8 | 12/1974 | 26 | |||||
| 18-23W-30BCC | City of Ness City | 1975 | 60 R | 18 | QA | T,E | PS | 125 R | 2240 | 29.0 | 1/1976 | ||||||
| 18-23W-30CBC | City of Ness City | 1969 | 54 R | 16 | QA | T,E | PS | 90 R | 2245 | 38.0 | 1/1974 | ||||||
| 18-23W-30CBD | City of Ness City | 1932 | 51 R | 12 | QA | T,E | PS | 65 R | 2242 | 35.0 | 1/1974 | ||||||
| 18-23W-30CCA | City of Ness City | 1932 | 52 R | 12 | QA | T,E | PS | 50 R | 2245 | 42.0 | 1/1974 | ||||||
| 18-23W-30CCA2 | City of Ness City | 1934 | 52 R | 12 | QA | T,E | PS | 65 R | 2242 | 32.0 | 9/1974 | ||||||
| 18-23W-31ADB | City of Ness City | 1975 | 82 R | 18 | QA | T,E | PS | 125 R | 2240 | 505.0 | 1/1976 | ||||||
| 18-23W-31CAC | City of Ness City | 1947 | 48 R | 16 | QA | T,E | PS | 90 R | 2233 | 31.0 | 1/1974 | ||||||
| 18-23W-31DCB | City of Ness City | 1947 | 48 R | 16 | QA | T,E | PS | 125 R | 2229 | 31.0 | 1/1974 | ||||||
| 18-24W-16DCC | Bert Jones | 1955 | 68 R | 19 | QA | T,E | I | 200 R | 227S | 28.5 | 12/1974 | 25 | |||||
| 18-24W-22CCB | Junior Gabel | 1969 | 67 R | 16 | QA | T,E | I | 250 R | 2279 | 29.4 | 10/1974 | 35 | |||||
| 18-24W-23DCC | Ummel Brothers | 45 R | 18 | QA | T,T | I | 450 R | 2259 | 23.1 | 11/1974 | 37 | ||||||
| 18-24W-23DDC | Ummel Brothers | 45 R | 18 | QA | T,T | I | 450 R | 2259 | 23.2 | 11/1974 | 38 | ||||||
| 18-24W-25ACB | City of Ness City | 1969 | 51 R | 16 | QA | T,E | PS | 135 R | 2250 | 32.0 | 1/1974 | ||||||
| 18-24W-25ADC | City of Ness City | 1967 | 52 R | 16 | QA | T,E | PS | 125 R | 2241 | 32.0 | 1/1974 | ||||||
| 18-24W-25BBA | Glen Pember | 1966 | 54 R | 18 | QA | T,E | I | 95 | 9 | 94 | 2254 | 26.4 | 11/1974 | C | 17 | ||
| 18-24W-25DCA | City of Ness City | 1954 | 56 R | 16 | QA | T,E | PS | 115 R | 2243 | 37.0 | 1/1974 | ||||||
| 18-24W-25DCC | City of Ness City | 1955 | 58 R | 16 | QA | T,E | PS | 40 R | 2251 | 43.0 | 5/1974 | ||||||
| 18-24W-26DAA | Dwaine Radke | 1955 | 18 | QA | T,LPG | I | 350 R | 17.7 | 12/1974 | 35 | |||||||
| 18-24W-26DBC | Dwaine Radke | 1960 | 62 R | 18 | QA | T,D | I | 250 R | 28.5 | 12/1974 | 37 | ||||||
| 18-24W-27ADB | Otto Stoppel | 1967 | 66 R | 18 | QA | T,LPG | I | 300 R | 2270 | 35.1 | 10/1974 | ||||||
| 18-24W-36AAA | City of Ness City | 1975 | 60 R | 18 | QA | T,E | PS | 125 R | 2240 | 35.0 | 1/1976 | ||||||
| 18-24W-36ADB | Keith Parkerson | 1971 | 59 R | 16 | QA | T,LPG | I | 320 | 32 | 2235 | 36.4 | 10/1974 | 40 | ||||
| 18-25W-5ACA | Leonard Norton | 1972 | 70 R | 16 | QA | T,E | I | 400 | 12 | 2376 | 26.6 | 12/1974 | 50 | 145 | |||
| 18-25W-5ACB | Leonard Norton | 1972 | 62 R | 16 | QA | T,E | I | 165 | 5 | 2383 | 26.8 | 12/1974 | 20 | 212 | |||
| 18-25W-33ADC | Chris Dinges | 1965 | 48 R | 20 | QA | T,E | I | 305 R | 2388 | 24 | |||||||
| 18-25W-33BAD | Chris Dinges | 1965 | 48 R | 20 | QA | T,E | I | 485 | 44 | 2393 | 18.8 | 11/1974 | 29 | 97 | |||
| 18-25W-33BBC | Chris Dinges | 1965 | 48 R | QA | T,T | I,O | 350 R | 2402 | 24.2 | 11/1974 | |||||||
| 18-25W-33BCB | Chris Dinges | 1965 | 48 R | 20 | QA | T,E | I | 350 R | 2398 | 22.2 | 11/1974 | 30 | |||||
| 18-25W-33BDB | Chris Dinges | 1965 | 4S R | 20 | QA | T,E | I | 600R | 2392 | 18.4 | 11/1974 | ||||||
| 18-26W-6BAB | C. J. Whipple | 1958 | 12 | QA,TO | SUB,E | I | 2570 | 6.8 | 12/1974 | 13 | |||||||
| 18-26W-6BAB2 | C. J. Whipple | 1958 | 12 | QA,TO | SUB,E | I,O | 2570 | 7.4 | 12/1974 | 13 | |||||||
| 18-26W-6BAB3 | C. J. Whipple | 1958 | 12 | QA,TO | SUB,E | I | 2570 | 3.7 | 12/1974 | 14 | |||||||
| 19-21W-6BBC | Waldimore Strecker | 1967 | 47 R | 19 | QA | T,E | I | 50 R | 2132 | 35.7 | 11/1974 | 14 | |||||
| 19-21W-6BCA | L. A. Strecker | 1956 | 55 R | 16 | QA | T,E | I | 185 | 2132 | C | 9 | ||||||
| 19-21 W-6BCB | L. A. Strecker | 1964 | 52 R | 16 | QA | T,E | I | 450 R | 2132 | 9 | |||||||
| 19-22W-1ACA | Herbert Moore | 1971 | 50 R | 16 | QA | T,E | I | 350 R | 2132 | 36.0 | 11/1974 | 50 | |||||
| 19-22W-1ADA | Herbert Moore | 1971 | 50 R | 16 | QA | T,E | I | 225 R | 2131 | 34.4 | 11/1974 | 50 | |||||
| 19-22W-1BAA | Herbert Moore | 1971 | 50 R | 16 | QA | T,E | I | 300 R | 2133 | 33.8 | 11/1974 | 51 | |||||
| 19-22W-3ACD | Larry Kleweno | 1968 | 47 R | 16 | QA | T,E | I | 85 | 7 | 120 | 2142 | 31.1 | 11/1974 | C | 23 | 338 | |
| 19-22W-3ADC | Larry Kleweno | 1974 | 53 R | 16 | QA | T,E | I | 120 | 7 | 168 | 2141 | 31.5 | 11/1974 | 25 | 416 | ||
| 19-22W-4DCD | A. Elaine Gross | 54 R | 16 | QA | T,E | I | 300 R | 2153 | 28.6 | 11/1974 | 30 | ||||||
| 19-22W-7AAD | George Knotts | 1956 | 59 R | 16 | QA | T,E | I | 135 | 10 | 72 | 2167 | 35.8 | 10/1974 | 57 | 323 | ||
| 19-22W-7ADC | George Knotts | 1958 | 49 R | 16 | QA | T,LPG | I | 250 | 31 | 72 | 2172 | 37.8 | 10/1974 | C | 57 | 43 | |
| 19-22W-7ADD | George Knotts | 1970 | 55 R | 16 | QA | T,E | I | 115 | 23 | 72 | 2170 | 38.1 | 10/1974 | 57 | 230 | ||
| 19-22W-8ABB | Richard Stenzel | 1974 | 56 R | 16 | QA | T,E | I | 400 R | 2160 | 30.3 | 11/1974 | 50 | |||||
| 19-22W-8ADB | Richard Stenzel | 1971 | 52 R | 16 | QA | T,E | I | 300 R | 2163 | 50 | |||||||
| 19-22W-8BCA | Ron Eckels | 1969 | 61 R | 16 | QA | T,LPG | I | 770 | 59 | 2166 | 36.9 | 10/1974 | 50 | 14 | |||
| 19-22W-8BCB | Ron Eckels | 1949 | 58 R | 12 | QA | T,LPG | I | 670 | 61 | 504 | 2168 | 36.0 | 10/1974 | C | 50 | 16 | |
| 19-23W-1CCB | J. R. Clauston | 1970 | 450 R | 16 | KD | T,LPG | I,O | 800 | 9 | 54 | 2214 | 79.5 | 3/1975 | C | 120 | 54 | |
| 19-23W-5BDB | Alvin Langer | 1966 | 65 R | 16 | QA | T,D | I | 355 | 18 | 2222 | 33.6 | 10/1974 | 60 | 12 | |||
| 19-23W-5CCD | City of Ness City | 1971 | 70 R | 16 | QA | T,E | PS | 105 R | 2218 | 30.0 | 1/1974 | ||||||
| 19-23W-5CD | City of Ness City | 1958 | 70 R | 16 | QA | T,E | PS | 95 R | 2218 | 32.0 | 1/1974 | ||||||
| 19-23W-5DCC | City of Ness City | 1958 | 72 R | 16 | QA | T,E | PS | 115 R | 2210 | 36.0 | 1/1974 | ||||||
| 19-23W-6AAA | Alvin Langer | 1974 | 65 R | 16 | QA | T,D | I | 155 | 11 | 2227 | 30.2 | 10/1974 | 32 | 18 | |||
| 19-23W-8CBA | Robert Schniepp | 1970 | 48 R | 16 | QA | T,LPG | I | 260 | 22 | 2222 | 31.9 | 10/1974 | 30 | 21 | |||
| 19-23W-8CBB | Robert Schniepp | 52 R | 1 | QA | N | O | 2220 | 21.3 | 8/1971 | ||||||||
| 19-23W-8CCC | Robert Schniepp | 1944 | 42 R | QA | T,LPG | I | 200 R | 2223 | 27.1 | 10/1974 | 10 | ||||||
| 19-23W-11BBD | George Clauston | 1956 | 44 R | 16 | QA | T,LPG | I | 250 R | 2191 | 26 R | 10/1974 | ||||||
| 19-23W-11BBD2 | George Clouston | 1958 | 44 R | 16 | QA | T,LPG | I | 2191 | 26 R | 10/1974 | |||||||
| 19-23W-14BAD | H. H. Cooper | 1958 | 58 R | 16 | QA | T,LPG | I | 350 R | 2184 | 37.5 | 10/1974 | 17 | |||||
| 19-23W-14DBA | Orville Pfaff | 1964 | 70 R | 18 | QA | T,LPG | I | 350 R | 2177 | 37.8 | 10/1974 | 35 | |||||
| 19-23W-21DA | Ralph Stum | 1975 | 282 R | 4 | KD | T,E | S | 2240 | C | ||||||||
| 19-24W-7CDA | Charles Shauers | 1948 | 34 R | 19 | QA | T,D | I | 450 R | 2330 | 16.4 | 11/1974 | 48 | |||||
| 19-24W-7DBC | M. L. McCoy | 1965 | 60 R | 18 | QA | T,E | I | 350R | 2345 | 43.4 | 11/1974 | 35 | |||||
| 19-24W-8DCC | Art Pember | 1968 | 64 R | 18 | QA | T,E | I | 370 | 30 | 2332 | 36.9 | 11/1974 | 25 | 127 | |||
| 19-24W-17BAA | Art Pember | 1968 | 63 R | 18 | QA | T,E | I | 135 | 14 | 2332 | 36.5 | 11/1974 | 25 | 170 | |||
| 19-24W-17BAA2 | Art Pember | 1968 | 67 R | 18 | QA | T,E | I | 350 | 25 | 2332 | 36.3 | 11/1974 | 25 | 141 | |||
| 19-24W-17BAD | Art Pember | 1969 | 55 R | 18 | QA | T,E | I | 200 | 30 | 2329 | 34.6 | 11/1974 | C | 25 | 113 | ||
| 19-25W-2DBC | W. B. Baldwin | 1953 | 55 R | 14 | QA | T,D | I | 225 R | 2360 | 30 R | 7/1974 | 55 | |||||
| 20-22W-3DDD | Fred Stoecklein | 1974 | 315 R | 5 | KD | CY,W | S | 80 E | 2250 | 135 R | 12/1974 | ||||||
| 20-22W-19CCD | T. F. Brennan | 1940 | 75 R | 18 | QA | T,E | I | 830 | 72 | 2190 | C | 110 | 126 | ||||
| 20-22W-19DDC | T. F. Brennan | 1920 | 75 R | 18 | QA | T,LPG | I | 1000 R | 2195 | 40 | |||||||
| 20-22W-2OCCC | C. L. Whitley | 51 R | 20 | QA | N | O | 2189 | 34.4 | 8/1971 | ||||||||
| 20-22W-20CCC2 | M. A. Whitley | 1935 | 93 R | 16 | QA | T,E | I | 500 | 2189 | 24 R | 8/1945 | 49 | 129 | ||||
| 20-22W-20CCC3 | M. A. Whitley | 1972 | 127 R | 16 | QA | T,E | I | 870 | 41 | 2188 | 33.7 | 10/1974 | C | 49 | 112 | ||
| 20-22W-20DCA | C. G. Holmes | 1964 | 86 R | 18 | QA | T,E | I | 800 R | 2182 | 32.4 | 10/1974 | 97 | |||||
| 20-22W-20DCC | C. G. Holmes | 1964 | 90 R | 18 | QA | T,E | I | 1000 R | 2184 | 32.6 | 10/1974 | 98 | |||||
| 20-22W-21DBB | J. J. Bowman | 1942 | 70 R | 18 | QA | T,E | I | 220 | 10 | 2178 | 38.0 | 10/1974 | C | 40 | 200 | ||
| 20-22W-21DBB2 | J. J. Bowman | 1971 | 70 R | 18 | QA | T,E | I | 220 | 22 | 2180 | 32.5 | 10/1974 | 40 | 133 | |||
| 20-22W-27BCD | Harry Shanks | 1965 | 63 R | 16 | QA | T,E | I | 300 | 30 | 2177 | 34.3 | 10/1974 | 48 | 110 | |||
| 20-22W-27CBB | A. Barricklow | 1947 | 59 R | 16 | QA | T,E | I | 760 R | 2175 | 33.2 | 10/1974 | 48 | |||||
| 20-22W-27DCD | Thelma Stone | QA | T,E | I | 1000 R | 2171 | 33 | ||||||||||
| 20-22W-28AAC | A. Barricklow | 1951 | 65 R | 16 | QA | T,LPG | I | 1000 R | 2178 | 28 R | 1951 | 43 | |||||
| 20-22W-28ACC | A. Barricklow | 1951 | 91 R | 16 | QA | T,E | I | 1180 R | 2172 | 28 R | 1951 | 60 | |||||
| 20-22W-28BCC | Dale Bowman | 1956 | 98 R | 16 | QA | T,E | I | 770 | 77 | 2185 | 37.6 | 10/1974 | C | 70 | 120 | ||
| 20-22W-28CBC | J. L. McFadden | 1933 | 60 R | 18 | QA | T,E | I | 2185 | 53 | ||||||||
| 20-22W-28CCB2 | H. M. McFadden | 1933 | 90 R | 18 | QA | T,E | I | 2185 | 41.9 | 10/1974 | |||||||
| 20-22W-28CCC | Nellie McFadden | 1929 | 60 R | 18 | QA | T,E | I | 2185 | 42.8 | 10/1974 | |||||||
| 20-22W-28DCC | Omar Cook | 1930 | 60 R | 24 | T,E | I | 2181 | 30 R | 1930 | 40 | |||||||
| 20-22W-29ACD | R. F. Uehling | 1955 | 80 R | 14 | QA | T,E | I | 800 R | 2188 | 42.0 | 10/1974 | 115 | |||||
| 20-22W-29BDA | R. F. Uehling | 1974 | 125 R | 16 | QA | T,E | I | 550R | 2190 | 110 | |||||||
| 20-22W-29CBB | Harry Hall | 1966 | 87 R | 16 | QA | T,LPG | I | 600 | 16 | 1 | 2191 | 39.3 | 10/1974 | C | 30 | 18 | |
| 20-22W-29DBB | Harry Hall | 1957 | 108 R | 19 | QA | T,LPG | I | 950 R | 2190 | 41.7 | 10/1974 | 77 | |||||
| 20-22W-30AAB | Harry Hall | 1974 | 81 R | 16 | QA | T,LPG | I | 650 | 17 | 96 | 2189 | 36.9 | 10/1974 | 45 | 25 | ||
| 20-22W-30ABC | Harry Hall | 1943 | 65 R | 19 | QA | T,LPG | I | 1200 R | 2195 | 65 | |||||||
| 20-22W-30BCD | Harry Hall | 1949 | 63 R | 19 | QA | T,LPG | I | 580 | 2198 | C | 138 | 37 | |||||
| 20-22W-30CBA | F. E. Roth | 1935 | 60 R | 19 | QA | T,E | I | 520 | 2195 | 40.0 | 10/1974 | 85 | 155 | ||||
| 20-22W-32AAA | Ervin Koerner | 1946 | 60 R | 18 | QA | T,LPG | I | 275 | 2185 | 42.7 | 10/1974 | C | 20 | 59 | |||
| 20-22W-33ABC | W. D. Barricklow | 1969 | 90 R | 16 | QA | T,LPG | I | 870 | 79 | 2183 | 40.6 | 10/1974 | 70 | 31 | |||
| 20-22W-33BAD | W. D. Barricklow | 1952 | 60 R | 16 | QA | T,E | I | 435 | 73 | 2181 | 41.1 | 10/1974 | 44 | 138 | |||
| 20-22W-33BBA | W. D. Barricklow | 1948 | 60 R | 16 | QA | T,E | I | 750 | 2183 | 40.7 | 10/1971 | 36 | |||||
| 20-22W-33DAD | Ray McFadden | 1924 | 56 R | 18 | QA | T,E | I | 800 R | 2175 | 36.8 | 10/1974 | 14 | |||||
| 20-22W-34ACC | Earl Cure | 1951 | 90R | 18 | QA | T,E | I | 1800 R | 2173 | 155 | |||||||
| 20-22W-34BCC | Wilma McFadden | 1966 | 86 R | 16 | QA | T,E | I | 1600 R | 2181 | 115 | |||||||
| 20-22W-34DCB | Orville Pfaff | 1950 | 80 R | 24 | QA | T,LPG | I | 1200 R | 2171 | 30 R | 1950 | 100 | |||||
| 20-22W-35ACC | T. C. Bowie | 1935 | 78R | 16 | QA | T,LPG | I | 900R | 2166 | 80 | |||||||
| 20-22W-35BCC | Leslie Cox | 1935 | 68 R | 14 | QA | T,E | I,O | 700R | 2168 | 35.4 | 10/1974 | 100 | |||||
| 20-22W-35CCB | Emerson Cox | 1969 | 81 R | 19 | QA | T,E | I | 1000 R | 2171 | 38.2 | 10/1974 | 131 | |||||
| 20-22W-36CCC | Chester Jordan | 1972 | 100R | 16 | QA | T,E | I | 540 | 8 | 2164 | 38.6 | 10/1974 | 80 | 190 | |||
| 20-22W-36DCB | Melvin Murphy | QA | T,E | I | 2155 | 37.6 | 10/1974 | ||||||||||
| 20-23W-23CCD | H. A. Reinert | 1960 | 58 R | 18 | QA | T,E | I | 350 | 44 | 1 | 2215 | 45.4 | 10/1974 | C | 60 | 128 | |
| 20-23W-24DCC | M. A. Whitley | 1935 | 97 R | 16 | QA | T,E | I | 700 R | 2192 | 26.3 | 8/1945 | 65 | |||||
| 20-23W-25ACB | Carl Reinert | 1937 | 65 R | 16 | QA | T,E | I | 297 | 30 | 2201 | 40.2 | 10/1974 | 48 | 132 | |||
| 20-23W-25ADB | Carl Reinert | 1971 | 65 R | 16 | QA | T,E | I | 429 | 61 | 2195 | 41.4 | 10/1974 | 48 | 132 | |||
| 20-23W-25ADC | Carl Reinert | 1933 | 61 R | 19 | QA | T,E | I | 374 | 2201 | 33 R | 1933 | 49 | 137 | ||||
| 20-23W-25BBC | Donald Dansel | 1974 | 30 R | 18 | QA | I | 500 R | 2205 | |||||||||
| 20-23W-25BCC | Donald Dansel | 1964 | 65 R | 18 | QA | T,E | I | 500 R | 2205 | 36.1 | 10/1974 | ||||||
| 20-23W-25CCB | Carl Reinert | 1936 | 113 R | 16 | QA | T,E | I | 445 | 44 | 2208 | 44.5 | 10/1974 | 50 | 134 | |||
| 20-23W-25CCB2 | Carl Reinert | 1945 | 60 R | 16 | QA | T,E | I | 335 | 42 | 2208 | 44.8 | 10/1974 | 50 | 125 | |||
| 20-23W-26ACD | O. J. Marhofer | 1953 | 82 | 18 | QA | T,E | I | 630 | 23 | 2211 | 43.9 | 10/1974 | C | 110 | 154 | ||
| 20-23W-26BDC | O. J. Marhofer | 1948 | 72 R | 18 | QA | T,LPG | I | 400 R | 2209 | 41.2 | 10/1974 | 40 | |||||
| 20-23W-26CAB | Harkness & Benson | 1974 | 90 R | 16 | QA | T,E | I | 535 | 6 | 720 | 2211 | 43.1 | 10/1974 | C | 73 | 167 | |
| 20-23W-26CBD | Harkness & Benson | 1963 | 120 R | 16 | QA | T,E | I | 610 | 2211 | 44.5 | 10/1974 | 72 | 154 | ||||
| 20-23W-26DBC | O. J. Marhofer Est. | 1974 | 85 R | 16 | QA | T,E | I | 565 | 28 | 2212 | 44.2 | 10/1974 | 70 | 131 | |||
| 20-23W-26DCC | O. J. Marhofer Est. | 1945 | 63 R | 19 | QA | T,E | I | 455 | 50 | 2212 | 40.5 | 10/1974 | 70 | 114 | |||
| 20-23W-27DCB | Ethel Edwards | 1969 | 75 R | 16 | QA | T,E | I | 620 | 44 | 480 | 2215 | 38R | 1969 | C | 70 | 160 | |
| 20-23W-27DDC | Parks & Harkness | 1969 | 85 R | 16 | QA | T,E | I | 810 | 115 | 2216 | 41.6 | 10/1974 | 70 | 129 | |||
| 20-23W-28DDA | James Burdett | 1936 | 70 R | 19 | QA | T,E | I | 400 R | 2220 | 35 | |||||||
| 20-23W-32BBC | Marlin Stumm | 1967 | 100 R | 14 | QA | T,LPG | I | 900 | 35 | 2230 | 35. | 6/1975 | C | 212 | 24 | ||
| 20-23W-32CDA | J. E. Ficken | 1934 | 67 R | 19 | QA | T,LPG | I,O | 1000 R | 2233 | 36.4 | 12/1971 | 84 | |||||
| 20-23W-33AAB | E. Jedlicka | 1937 | 60 R | 16 | QA | T,LPG | I | 700 R | 2222 | 43. | 10/1974 | 60 | |||||
| 20-23W-33BCA | Frusher & Frusher | 1940 | 85 R | 16 | QA | T,E | I | 455 | 2225 | 41.5 | 10/1974 | 70 | |||||
| 20-23W-33BCC | Frusher & Frusher | 1965 | 90 R | 16 | QA | T,E | I | 360 | 17 | 2222 | 41.8 | 10/1974 | C | 40 | 163 | ||
| 20-23W-33CBD | Frusher & Frusher | 1971 | 75 R | 16 | QA | T,E | I | 650R | 2225 | 40.6 | 10/1974 | 132 | |||||
| 20-23W-34BAC | Frusher & Frusher | 1972 | 85R | 16 | QA | T,E | I | 600 | 46 | 2215 | 41.1 | 10/1974 | C | 75 | 134 | ||
| 20-23W-34BBA | Frusher & Frusher | 1972 | 105 R | 16 | QA | T,E | I | 305 | 9 | 2216 | 41.8 | 10/1974 | 45 | 185 | |||
| 20-23W-35BBB | A. Reinert | 1961 | 80 R | 18 | QA | T,E | I | 645 | 49 | 2217 | 43.7 | 10/1974 | 100 | 138 | |||
| 20-24W-36BDA | Humburg Ranch Inc. | 1959 | 85 R | 16 | QA | T,LPG | I | 415 | 69 | 2242 | 31.7 | 11/1974 | 107 | 47 | |||
| 20-24W-36CBB | Humburg Ranch Inc. | 1967 | 63 R | 16 | QA | T,LPG | I | 330 | 47 | 2245 | 34.5 | 9/1974 | 53 | 47 | |||
| 20-24W-36CCC | Humburg Ranch Inc. | 1946 | 54 R | 16 | QA | T,LPG | I | 535 | 67 | 2245 | 33.3 | 11/1974 | 150 | 36 | |||
| 20-24W-36CDA | Humburg Ranch Inc. | 1971 | 57 R | 16 | QA | T,E | I | 125 | 25 | 2245 | 36.8 | 9/1974 | C | 15 | 188 | ||
| 20-26W-7BDC | Lyle Davidson | 1970 | 50 R | 16 | QA | T,LPG | I,O | 300 R | 23.8 | 12/1974 | 72 | ||||||
| 20-26W-7BDC2 | Lyle Davidson | 1970 | 50 R | 16 | QA | T,LPG | I | 300 R | 26.4 | 12/1974 | 73 | ||||||
(1) Numbering system described in text.
(2) Depths of wells given in feet below land surface--no letter after number, measured; R, reported.
(3) Geologic unit--QA, Alluvium; TO, Ogallala Formation; KD, Dakota Formation.
(4) Method of lift--C, centrifugal; CY, cylinder; N, none; SUB, submersible; T, turbine. Type of power--D, diesel; E, electric; G, gasoline; LPG, liquid petroleum gas; T, tractor; W, wind.
(5) Use--I, irrigation; N, none; O, observation; PS, public supply; S, stock.
(6) Yield given in gallons per minute--no letter, measured during present study; E, estimated; R, reported.
(7) Specific capacity-gallons per minute per foot of drawdown for the time shown in bours.
(8) Altitude of land surface in feet above mean sea level determined by topographic map.
(9) Depth to water below land surface datum (LSD) in feet-measured depths less than 100 feet are given to nearest 0.1 foot and those greater than 100 feet are given to nearest foot; R, reported. (10) Date of measurement-month and year.
(11) Chemical data--C, complete analysis.
(12) Power consumption--KWH/acre foot, kilowatt hours of electricity per acre-foot of water pumped; gallons/acre-foot, gallons of fuel per acre-foot of water pumped.
Table 5--Chemical analyses of water from selected wells. [Dissolved constituents and hardness given in milligrams per liter. Analyses by Kansas Department of Health and Environment]
| Local well number |
Well depth (feet) |
Geologic source1 |
Date of collection |
Temp. (°C) |
Dissolved silica (SiO2) |
Total iron (Fe) |
Dissolved manganese (Mn) |
Dissolved calcium (Ca) |
Dissolved magnesium (Mg) |
Dissolved sodium (Na) |
Dissolved potassium (K) |
Carbonate (CO3) |
Bicarbonate (HCO3) |
Dissolved sulfate (SO4) |
Dissolved chloride (Cl) |
Dissolved fluoride (F) |
Dissolved nitrate (NO3) |
Dissolved solids calculated |
Hardness | Sodium adsorption ratio |
Specific conductance (microhhos at 25 °C) |
pH | |
|---|---|---|---|---|---|---|---|---|---|---|---|---|---|---|---|---|---|---|---|---|---|---|---|
| (Ca, Mg) | Non- carbionate |
||||||||||||||||||||||
| 16-26W-2ABB | 34 | TO | 12-23-1975 | 9.5 | 54 | 18 | 20 | 5.3 | 0 | 124 | 49 | 78 | .3 | 2.0 | 297 | 208 | 106 | .6 | 540 | 7.5 | |||
| 16-26W-35CCD | 40 | TO | 12-23-1975 | 36 | 104 | 18 | 20 | 6.6 | 0 | 349 | 33 | 28 | .3 | 28 | 446 | 334 | 48 | .5 | 710 | 7.7 | |||
| 18-24W-25BBA | 54 | QA | 7-18-1975 | 15.0 | 43 | .16 | 160 | 21 | 33 | 7.0 | 0 | 324 | 140 | 89 | .2 | 16 | 666 | 480 | 214 | .7 | 1080 | 7.5 | |
| 19-21W-6BCA | 55 | QA | 5-22-1975 | 41 | .00 | .00 | 200 | 16 | 41 | 6.5 | 0 | 444 | 209 | 55 | .2 | 7.4 | 794 | 565 | 201 | .8 | 1160 | ||
| 19-22W-3ACD | 47 | QA | 7-17-1975 | 17.0 | 37 | .08 | .00 | 126 | 14 | 67 | 7.5 | 0 | 310 | 186 | 43 | .6 | 17 | 650 | 372 | 118 | 1.5 | 1020 | 7.5 |
| 19-22W-7ADC | 49 | QA | 5-7-1975 | 15.0 | 42 | .05 | .00 | 149 | 22 | 45 | 7.2 | 0 | 359 | 124 | 81 | .4 | 19 | 666 | 462 | 168 | .9 | 1030 | 7.5 |
| 19-22W-8BCB | 58 | QA | 5-7-1975 | 14.5 | 41 | .05 | .00 | 179 | 23 | 31 | 7.0 | 0 | 329 | 168 | 112 | .4 | 16 | 739 | 541 | 271 | .6 | 1170 | 7.4 |
| 19-23W-1CCB | 450 | KD | 7-17-1975 | 19.0 | 8.6 | .03 | .00 | 9.6 | 3.9 | 240 | 5.8 | 0 | 244 | 132 | 161 | 2.4 | .9 | 684 | 40 | 0 | 17 | 1220 | 7.7 |
| 19-23W-21DA | 282 | KD | 8-25-1975 | 8.1 | .11 | .20 | 16 | 5.8 | 510 | 9.8 | 0 | 390 | 240 | 30 | 5.2 | .1 | 1420 | 64 | 28 | 2470 | 8.0 | ||
| 19-24W-17BAD | 55 | QA | 6-20-1975 | 38 | .09 | .00 | 72 | 13 | 45 | 5.5 | 0 | 310 | 52 | 20 | .5 | 6.1 | 404 | 233 | 0 | 1.3 | 641 | 7.7 | |
| 20-22W-19CCD | 75 | QA | 5-7-1975 | 14.0 | 39 | .03 | .00 | 136 | 16 | 32 | 8.5 | 0 | 342 | 146 | 26 | .2 | 13 | 585 | 406 | 126 | .7 | 890 | 7.5 |
| 20-22W-20CCC3 | 127 | QA | 5-15-1975 | 41 | .00 | .00 | 112 | 16 | 43 | 8.5 | 0 | 339 | 121 | 32 | .6 | 1.7 | 543 | 346 | 68 | 1.0 | 830 | 7.6 | |
| 20-22W-21DBB | 70 | QA | 6-17-1975 | 51 | .02 | .00 | 130 | 13 | 30 | 6.0 | 0 | 349 | 101 | 37 | .6 | 7.4 | 548 | 378 | 92 | .7 | 840 | 7.5 | |
| 20-22W-28BCC | 98 | QA | 6-17-1975 | 43 | .02 | .00 | 112 | 42 | 40 | 11 | 0 | 346 | 201 | 38 | .3 | .2 | 658 | 452 | 168 | .8 | 980 | 7.7 | |
| 20-22W-29CBB | 87 | QA | 5-9-1975 | 14.5 | 42 | .27 | .00 | 178 | 18 | 15 | 6.5 | 0 | 388 | 158 | 33 | .1 | 25 | 667 | 518 | 200 | .3 | 1000 | 7.5 |
| 20-22W-30BCD | 63 | QA | 5-15-1975 | 44 | .02 | .00 | 179 | 25 | 31 | 8.2 | 0 | 268 | 254 | 86 | .3 | 28 | 550 | 330 | .6 | 1160 | 7.4 | ||
| 20-22W-32AAA | 60 | QA | 5-8-1975 | 13.5 | 25 | .06 | 141 | 12 | 15 | 4.5 | 0 | 346 | 8.8 | 26 | .2 | 32 | 524 | 402 | 118 | .3 | 820 | 7.5 | |
| 20-23W-23CCD | 58 | QA | 5-8-1975 | 14.5 | 30 | .11 | .00 | 120 | 9.8 | 20 | 4.5 | 0 | 273 | 76 | 42 | .2 | 37 | 474 | 340 | 116 | .5 | 760 | 7.5 |
| 20-23W-26ACD | 82 | QA | 5-16-1975 | 41 | .02 | .00 | 179 | 17 | 37 | 9.0 | 0 | 368 | 233 | 40 | .3 | 10 | 748 | 516 | 214 | .7 | 1090 | 7.6 | |
| 20-23W-26CAB | 90 | QA | 5-8-1975 | 14.5 | 44 | .06 | .00 | 142 | 17 | 33 | 7.2 | 0 | 322 | 164 | 37 | .5 | 7.8 | 611 | 424 | 160 | .7 | 920 | 7.4 |
| 20-23W-27DCB | 75 | QA | 5-8-1975 | 14.0 | 41 | .06 | 163 | 21 | 25 | 8.2 | 0 | 310 | 204 | 53 | .3 | 6.4 | 675 | 493 | 239 | .5 | 1010 | 7.5 | |
| 20-23W-32BBC | 100 | QA | 6-18-1975 | 35 | 1.3 | .00 | 126 | 15 | 27 | 7.0 | 0 | 310 | 140 | 30 | .3 | 4.3 | 537 | 376 | 122 | .6 | 810 | 7.7 | |
| 20-23W-33BCC | 90 | QA | 6-18-1975 | 39 | .02 | .00 | 120 | 13 | 19 | 6.2 | 0 | 305 | 93 | 30 | .3 | 7.8 | 478 | 353 | 103 | .5 | 740 | 7.6 | |
| 20-23W-34BAC | 85 | QA | 5-22-1975 | 40 | .02 | .00 | 133 | 9.7 | 19 | 5.0 | 0 | 310 | 85 | 41 | .3 | 18 | 503 | 372 | 118 | .4 | 770 | 7.8 | |
| 20-24W-36CDA | 57 | QA | 6-19-1975 | 32 | .02 | .00 | 168 | 17 | 56 | 7.2 | 0 | 381 | 162 | 86 | .2 | 22 | 738 | 489 | 177 | 1.1 | 1160 | 7.6 | |
1. Geologic units abbreviated as follows: KD, Dakota Formation; TO, Ogallala Formation; QA, Alluvium.
Kansas Geological Survey
Placed on web July 18, 2013; originally published in 1977.
Comments to webadmin@kgs.ku.edu
The URL for this page is http://www.kgs.ku.edu/Publications/Bulletins/IRR3/index.html