Kansas Geological Survey, Computer Contributions 50, originally published in 1970
University of Nottingham
Originally published in 1970 as Kansas Geological Survey Computer Contributions 50.
The development and operation of a program to simulate the formation of a shingle spit is described. This includes a detailed account of action of the subroutines that simulate the four major processes that are thought to act on the spit. The simulation relies on stochastic techniques and the program is concerned with building a spit in a 50-row by 60-column matrix so that the results of the process are graphically displayed. The example illustrating use of the program is the Hurst Castle spit on the Hampshire coast of England.
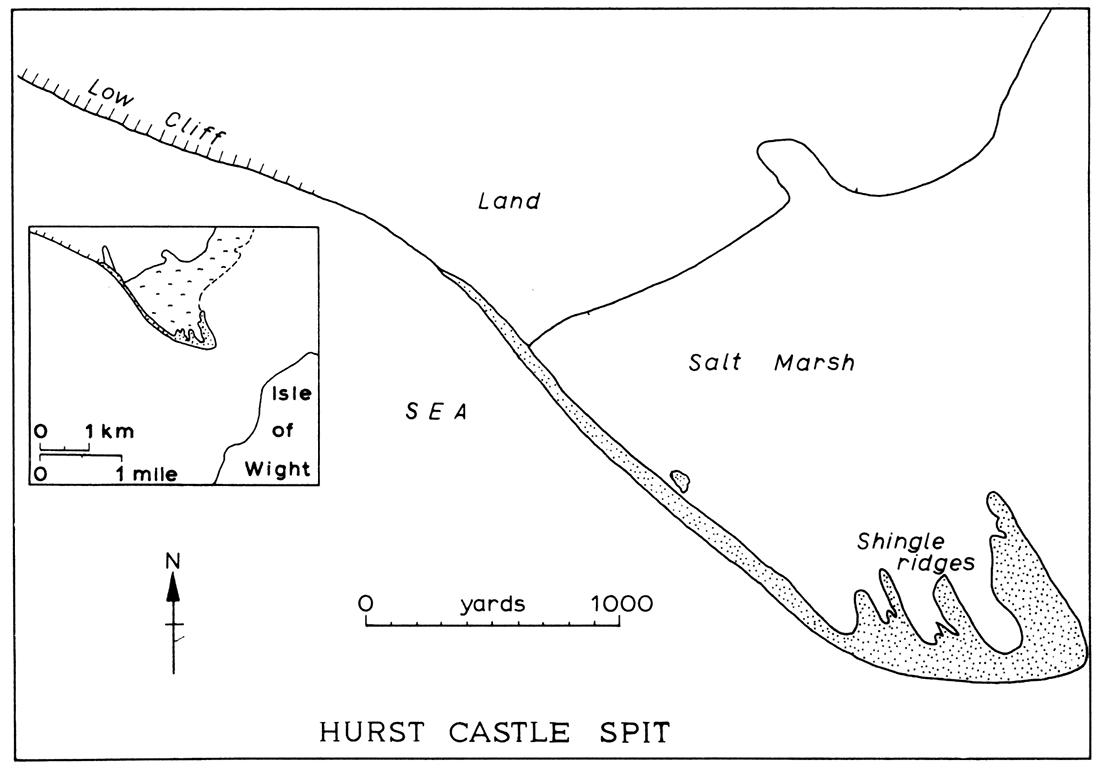
Hurst Castle spit lies on the south coast of England, developed partly in the shelter of the Isle of Wight. The spit is about 2 km long (Fig. 1). It extends straight in a southeasterly direction before gradually turning east-west. One main feature of the spit is a series of recurves that join the main ridge at an acute angle. The recurves face northeast, normal to the elongation of the Solent, an open stretch of water separating the Isle of Wight from the Hampshire mainland. The number and length of the recurves are greater towards the distal end of the spit. Shingle [loose and waterworn flattened gravel and pebbles] is the predominant material forming the spit, and this is important in considering the processes that are meaningful in its growth.
Figure 1—Location of Hurst Castle spit.
Formation of the spit has been studied by Lewis (1931, 1938). He showed that the spit was dependent upon the action of several distinct wave types and that other factors entered into its formation. For these reasons this particular spit was thought to be suitable for developing a computer simulation model. The computer program simulates the dominant wave processes and takes into account the other factors important in determining the form of the spit.
Because the spit consists predominantly of shingle, the most permanent features are formed by the action of storm waves. The storm waves, although they comb much shingle offshore from the beach, throw material above the reach of normal waves to form the major ridge that determines the form of the spit. The action of storm waves is one process that is simulated in the program. The available material that the storm waves build into more permanent ridges is derived from the west. The longest fetch to which the root section of the spit is exposed is on a southwesterly direction. The storm waves also come from this direction. This accounts for alignment of the root section of the spit, as storm waves tend to build shingle features that are aligned normal to their direction of approach.
The next largest waves, coming from the open Atlantic, are generated by the prevalent westerly winds and have a component that induces beach drifting along the spit from the west. The action of these waves, which are important in building the spit because they supply the bulk of material from which it is formed, also are simulated in the program. A storm by the action of the oblique waves throws material derived from the west up onto the back of the beach to form the storm ridge. At the same time they denude the foreshore by their destructive action. This material must be replaced before the spit can grow longer.
The major bend of large radius of curvature along the spit probably is due to the effect of wave refraction. As the spit extends away from the land it enters deeper water. The storm waves coming from the southwest, together with westerly waves, will suffer increasing refraction, progressively turning more to approach the shore from the south rather than southwest. Therefore, the effect of refraction also must be allowed in the model. This is achieved by insertion of a mechanism that allows jumps to occur as the spit grows across the matrix.
Another important effect of the increase of depth offshore is the slowing of the easterly growth of the spit with time. As the water becomes deeper, more and more shingle is needed for each unit of growth. This factor also is allowed for in the program. Its main effect on the form of the spit is to increase the length and frequency of recurves towards the distal end of the spit. The real spit has few recurves along its proximal portion. This may be due partly to their burial in the salt marsh that is growing in the shelter of the spit, but also to the more rapid growth eastwards of the spit where the water is shallower near the coast.
The material forming the recurves must move along the spit and pass northwards around its sharp angle when waves come from a southerly or southeasterly direction. The fetch is short in these directions owing to the presence of the Isle of Wight. The waves would be short and little refracted. They therefore would be able to move the shingle along the spit in a northerly direction. Being fairly small the waves would not build large or permanent features, but could supply the material of which the recurves are formed. The sharp angle of the spit also is due to the Isle of Wight, which prevents large waves coming from the southeast.
The recurves face northeast along the Solent. The ridges are built by the waves generated by northeasterly winds blowing along the long stretch of open water in this direction. The recurves thus represent the action of waves coming from a direction almost diametrically opposite the storm waves that form the main spit ridge. This accounts for the small angle of 30° separating the alignment of the proximal part of the main ridge and the recurves. Thus four different types of waves are simulated in the program as well as the effects of refraction and increasing depth. The form of the spit depends essentially on these variables.
The development of the computer simulation model is based on the operation of fixed processes which follow one by one in a random fashion, although over the completely built spit there is a fixed proportion of operation of each process. The mainline program calculates random numbers in the range 0 to 100, and then matches the numbers with the fixed proportions of the total range allocated to each process routine. The split of the range might be for the WEST routine to be called if the random number falls between 0 and 40, STORM if between 41 and 55, SEPERP 56 to 73, and NOBLE 74 to 100. All values are variable as input and by variation of the numbers, the growth of the spit can be altered. The process routines WEST, STORM, SEPERP, and NOBLE are interactive in that the result of one will affect another, and all routines use a common indexing system.
To understand the marker system employed it is first necessary to consider what features the process routines will build. A typical small simulated spit in the early stages of growth and exhibiting all possible printing features for all the process routines is shown.
| Col 1 | Col 2 | Col 3 | Col 4 | Col 5 | Col 6 | Col 7 | Col 8 | |
|---|---|---|---|---|---|---|---|---|
| Row 45 | 7 | |||||||
| Row 46 | 9 | 7 | ||||||
| Row 47 | 3 | |||||||
| R6w 48 | 1 | |||||||
| Row 49 | 2 | 2 | 2 | 1 | 1 | 1 | 1 | 1 |
| Row 50 | 1 | 1 | 1 | 1 | 1 |
The action of WEST is indicated by a 1, a completed STORM by a 2, a SEPERP by 1, and a NOBLE by 3, 7 and 9. Markers are needed in the program to store the row and column numbers of the ends of all features. For instance, a marker is needed to store the position of the 2 in column 3; as this column marks the point before which STORM wi II have no effect. Similarly the SEPERP action represented by a 1 in row 48 column 7 is noted, as is the end of the oblique recurve created by routine NOBLE which is marked with a 7 in row 45 column 4.
A previous simpler version of the program did not use as many markers to indicate the position of the features of the spit and CPU time was about 2 minutes. With a more complicated program using the marker system as much as possible, CPU time is only about 1 minute (of which compilation, organization and relocation take about 35 seconds). The program deck also is shorter.
Read the PDF version (3.9 MB)
Kansas Geological Survey
Placed on web Sept. 3, 2019; originally published 1970.
Comments to webadmin@kgs.ku.edu
The URL for this page is http://www.kgs.ku.edu/Publications/Bulletins/CC/50/index.html