Kansas Geological Survey, Computer Contributions 49, originally published in 1970
Information and Computing Centres Canada
Originally published in 1970 as Kansas Geological Survey Computer Contributions 49.
A FORTRAN IV program is described for simulating geologic processes involved in the development of oil traps. Deposition, diastrophism, compaction and erosion can be defined mathematically and the structural highs within the three-dimensional model located.
The geology of the model area is gridded manually into a regular pattern and described in algebraic terms. Time is segmented by defining basement topography and then the geologic events as they are believed to have occurred. Experimentation with different hypotheses may be required to approximate the observed geology.
Visual displays can be specified at any time during the model development, permitting analysis of results before continuing with succeeding events. Displays include listings of geologic columns, structural elevations, and isopachous intervals and CALCOMP-plotted stratigraphic cross sections.
It is possible to define and visualize individual geologic events by traditional field methods. The effects of combinations of events could produce results, however, that would be difficult to visualize if considering each event or geological process as an entity. A mathematical method is described for imitating or simulating some geologic processes and events which are important in the development of structural, erosional and sedimentary facies-type oil traps. The geologic processes are imitated by successive evaluations of equations and decision-making operations which are incorporated into computer programs. The computer programs can he Ip reconstruct the geologic history of an area by allowing experimentation with different hypotheses. Several assumptions can be allowed and the variables embodied within the assumptions can be modified to make the results obtained with the simulation program agree with observed geology. The goal is not solely to match the observed geology, but also to explore the adjustments in the assumptions that are needed to obtain a reasonable match. This technique of simulation can give valuable insight into complex relationships of geologic processes. It might be possible to extrapolate knowledge gained from simulating an oil field into other areas of potential oil accumulations within the same basin.
The geologic processes which can be simulated by the computer program are: (1) deposition of lithologic units, (2) erosion, (3) diastrophism represented by the upward or downward movement of the basement rocks and overlying sedimentary strata, and (4) compaction of shale. Testing for structural highs as possible sites of oil accumulation also is possible. Geologic variables, such as permeability, are difficult to define over a wide area. However, the variables used in this simulation program are simple and obtained from direct observations of the geology or by experimentation. The parameters studied are: (1) structural elevation at various points in geologic time, (2) amount of erosion, (3) rock type, thickness and porosity of the rock units, and (4) amount of diastrophic movement of the basement rocks.
The simulation program described is a post-depositional model concerned with geological development of an area from the time a rock unit is deposited. The sedimentary factors of source, transportation and site of deposition are not involved in the modeling. The simulated process of erosion does not keep account of the eroded material. Assumptions are made in testing for structural highs as possible sites of oil accumulation. Porous sandstone and limestone are considered as the only possible reservoir rocks. Permeability parameters and pressures are not used in calculating the trap locations.
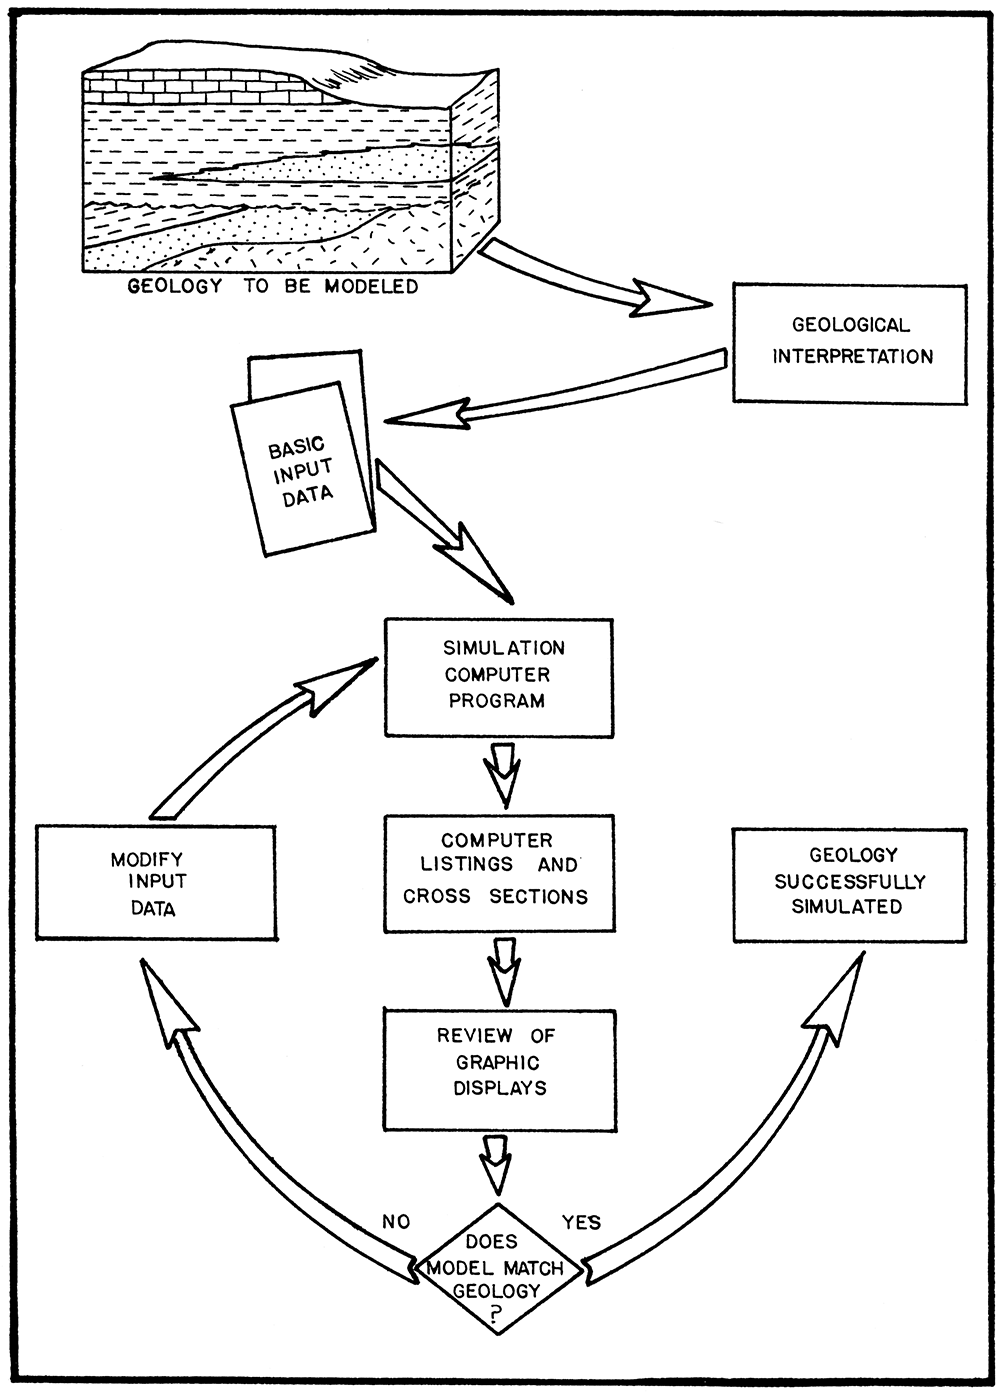
Figure 1 is a graphical representation of the procedure followed in modeling an area with the simulation program. The geological interpretation of the area is described in terms of mathematical variables and input as the basic data to the simulation computer program. Graphic displays in the form of cross sections and listings are output at specified points to check the geological development of the simulated model. If the geology of the simulated model does not agree satisfactorily with the observed geology, the basic data are modified until the observed geology has been simulated successfully.
Figure 1—Graphical representation of steps followed in modeling with computer program.
Scale models have helped in the study of many hypotheses on folding, faulting and salt dome formation. The problem with scale modeling is the difficulty in finding substances to duplicate the behavior of rock materials and geologic time. A mathematical model is a representation of a physical model that uses mathematical variables, parameters and constants to define materials, forces and events. Mathematical simulation techniques overcome some problems inherent in scale modeling. It is possible to vary and define closely the parameters which simulate some natural processes and features.
Geologists only recently have begun to use digital computers for modeling. Harbaugh (1966) wrote a paper on the mathematical simulation of marine sedimentation with computers. He successfully duplicated the development of delta formation within a sedimentary basin by imitating the behavior of sediment as it is transported and deposited. Harbaugh and Merriam (1968) describe methods for simulating sedimentary processes with computer models.
This report is condensed from a doctoral dissertation submitted to Stanford University (Ojakangas, 1967). I am indebted to John W. Harbaugh, Stanford University, who supervised the research and offered several suggestions to the original study. Valuable comments were received from Thomas D. Mueller, Standard Oil Company of California and Stanford University, Stanley N. Davis, University of Missouri, and Arvid M. Johnson of Stanford University. The writer was employed by Standard Oil Company of California during this research period and Standard Oil Company of California provided the computer and plotter time. Information and Computing Centres Canada Limited assisted in the preparation of this manuscript.
Read the PDF version (10.5 MB)
Kansas Geological Survey
Placed on web Sept. 11, 2019; originally published 1970.
Comments to webadmin@kgs.ku.edu
The URL for this page is http://www.kgs.ku.edu/Publications/Bulletins/CC/49/index.html