Kansas Geological Survey, Computer Contributions 42, originally published in 1970
Kansas Geological Survey
Originally published in 1970 as Kansas Geological Survey Computer Contributions 42.
The geological maze (algorithm) as described by Griffiths (1966) illustrates a procedure for problem solving in the geosciences. The researcher collects data, transforms it to normal, classifies, correlates, factors, rotates, separates populations and plots results. Physically, considering the large volumes of data usually involved, it would be difficult to manipulate the analysis with pencil and pad. The digital computer has provided a rapid and precise means of data analysis for the modern researcher. Computer programs have been written separately for correlation, factor analysis and varimax rotation, and are provided at many computer centers.
The objectives of this computer contribution are: (1) to provide the researcher with a multivariate systems program package containing correlation, factor analysis (both R- and Q-modes) and varimax rotation linked together in a single program with a minimum of required parameter cards and computer runs; and (2) to produce a program capable of analyzing large numbers of variables (100) and which to a large extent is machine independent. Computer Contribution 30 (Griffiths and Ondrick, 1968) provided the first stage in statistical data analysis, namely logarithmic transformation, classification and regression analysis of data. The program described here provides a means for accomplishing the second stage in the geological algorithm-multivariate statistical analysis.
CORFAN is a composite of four computer programs (COREL, FAN, QMOD, and VROT) originally written in FORTRAN II for the IBM 7074 computer. We express our thanks to The Pennsylvania State University Computation Center staff for the base programs from which this program was constructed. We also wish to thank Prof. John C. Griffiths for reading the manuscript and giving helpful suggestions. The FORTRAN IV program was tested in the GE 635 at the University of Kansas Computation Center.
The general layout of CORFAN is illustrated in the flow diagram of Figure 1. Program dimensions provide intercorrelations between a maximum of 100 variables (5050 correlation coefficients), R-mode factor analysis with a maximum computation of 100 factors, of which up to 60 may be rotated (Kaiser, 1958), and analysis of an unlimited number of samples.
Figure 1—Generalized flow diagram for CORFAN
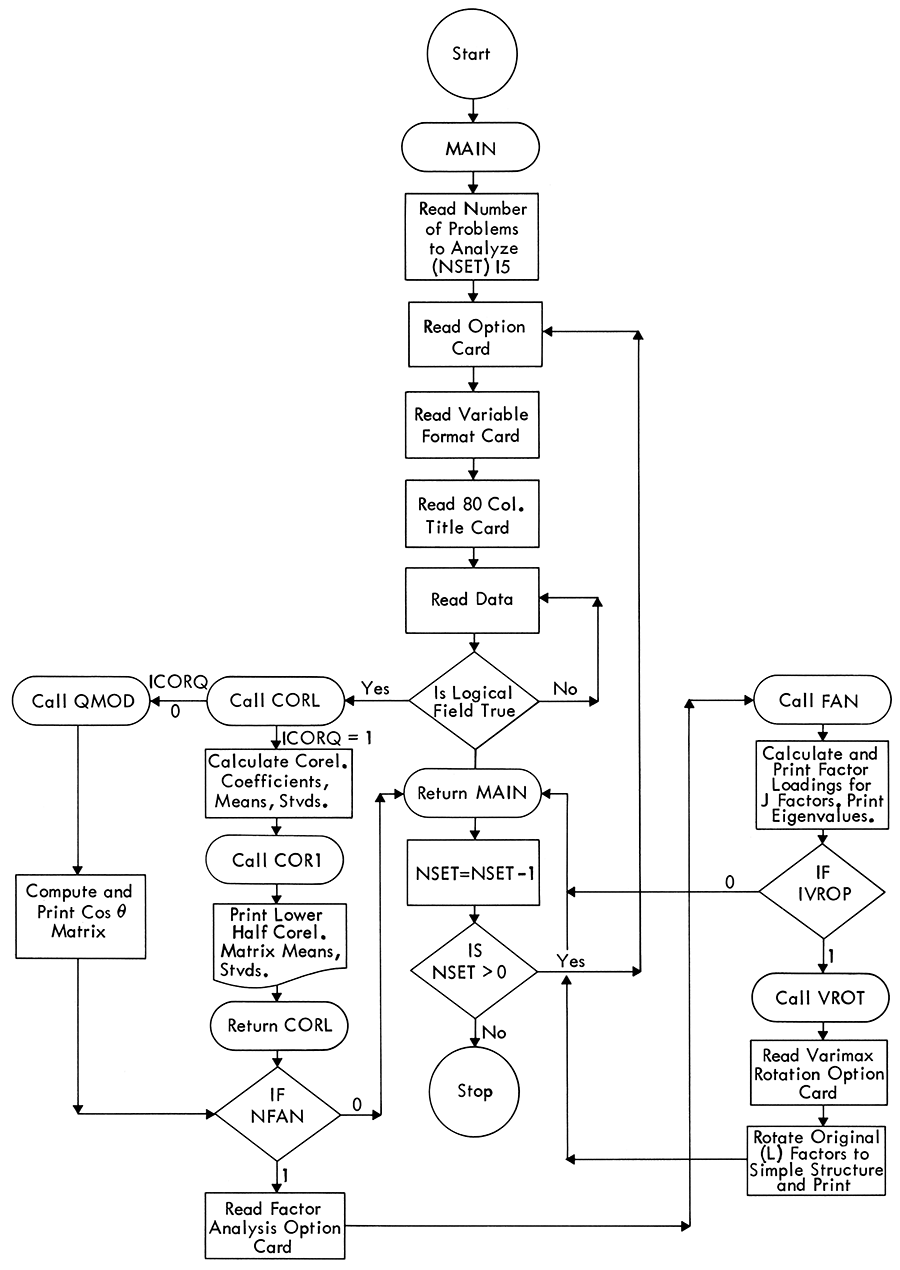
In Q-mode factor analysis the samples become the variables and the variables the samples, therefore the program dimensions provide for analysis of 100 samples. A value COS θ (Imbrie and Purdy, 1962} is calculated for each pair of sample vectors and represents the input into factor analysis. Output from the Q-mode option includes IN (input matrix), DIV (divided matrix), and COS (Cos e matrix) for each sample. The dimension restriction may be changed in statements MAIN 40, 45, and 91 to fit the core size required for a particular run. Card reader, printer and punch have been assigned variable names and their numerical designation may be altered in all subroutines by changing statements MAIN 80, 85, and 90 as desired.
There are 5 major options provided in this program: (1) correlation (including means and standard deviations); (2) correlation–R-mode factor analysis; (3) correlation–R-mode factor analysis, varimax rotation; (4) Q-mode factor analysis; and (5) Q-mode factor analysis–varimax rotation. Additional options incorporated within the program are to punch correlation coefficients, alter diagonal elements of the correlation matrix, punch factor loadings, and bivariate plotting of input data or loadings of one factor against another, original or rotated. The "Hamburger Stand Option" (one with everything to go) produces a symmetrical correlation matrix of input variables and plots each variable against the other, calculates R-mode factor analysis for n factors, plots the factor loadings of each factor against the other, rotates J factors of the original factor matrix to "simple structure", and yields plots of the factor loadings of each rotated factor against the other. The number plotted on the output graph shows the number of points at that position, e.g. the number 2 indicates 2 points.
Read the PDF version (7.7 MB)
Kansas Geological Survey
Placed on web Sept. 12, 2019; originally published 1970.
Comments to webadmin@kgs.ku.edu
The URL for this page is http://www.kgs.ku.edu/Publications/Bulletins/CC/42/index.html