Kansas Geological Survey, Computer Contributions 28, originally published in 1968
1Control Data Corporation, 2Atlantic-Richfield Company, and 3Kansas Geological Survey
Originally published in 1968 as Kansas Geological Survey Computer Contributions 28.
Geologic trend-surface analysis, as defined by Grant (1957)and developed by Krumbein (1956, 1959) and his associates (Peikert, 1963; Whitten, 1963) is a special application of multiple regression. Trend analysis has been widely and successfully applied in geologic research and exploration, and is perhaps the most extensively used computer technique in the earth sciences. Geologists are intuitively attracted to these methods which produce and analyze map features, and are finding increasing uses for "four-dimensional" variations of the technique (Harbaugh, 1964; Smith and Harbaugh, 1966; Davis, 1967a). Although most trend-surface applications are not amenable to statistical testing, an increasing number of other geologic problems are be ing analyzed as multivariable regressions.
The program described in this publication is an outgrowth of Geological Survey research in trend analysis, and incorporates features of several previous~y published programs. The matrix of regression coefficients contains 35 variables that may be combined in a number of different polynomial expansions. For example, a curvilinear regression on one independent variable may be computed up to X35, a trend surface may be computed up to the seventh order, a "four-dimensional" trend may be computed up to the fourth order, or multivariate linear and curvilinear regressions may be calculated using up to 35 independent variables.
A number of options have been written into this program to make it as versatile as possible. Individual coefficients, for example, may be deleted or incorporated as desired on successive runs. Residuals may be listed or printed on maps. Contour maps, of specified scale and contour interval, may be prepared for trend surfaces or "4-D" trends, including "slice-maps" at any specified coordinate through the solid defined by the independent variables.
Information useful for statistical testing also is produced. These include various sums of squares, the correlation coefficient, an F-value with associated degrees of freedom, and partial regression coefficients and standardized partial regression coefficients. If desired, regression of specified order may be performed on the residuals from a previous regression, as an aid in the search for correlation among residuals.
Numerical methods for computing trend surfaces have been described in detail in earlier publications in this series (Harbaugh, 1963; Good, 1964; Sampson and Davis, 1966, 1967; O'Leary, Lippert, and Spitz, 1966) and in recent textbooks on mathematical geology (Krumbein and Graybill, 1965, Ch. 13; Harbaugh and Merriam, 1968, Ch. 5). In general, they consist of expanding the desired linear regression into a matrix of normal equations, which then is solved by inversion, giving coefficients of the regression. A variety of schemes exist for inverting matrices; this program uses simple Gaussian elimination. However, the matrix is pretreated by an averaging process so that exponents of entries are centered around zero. This minimizes rounding effects created by extremely large entries but allows rapid solution of the matrix.
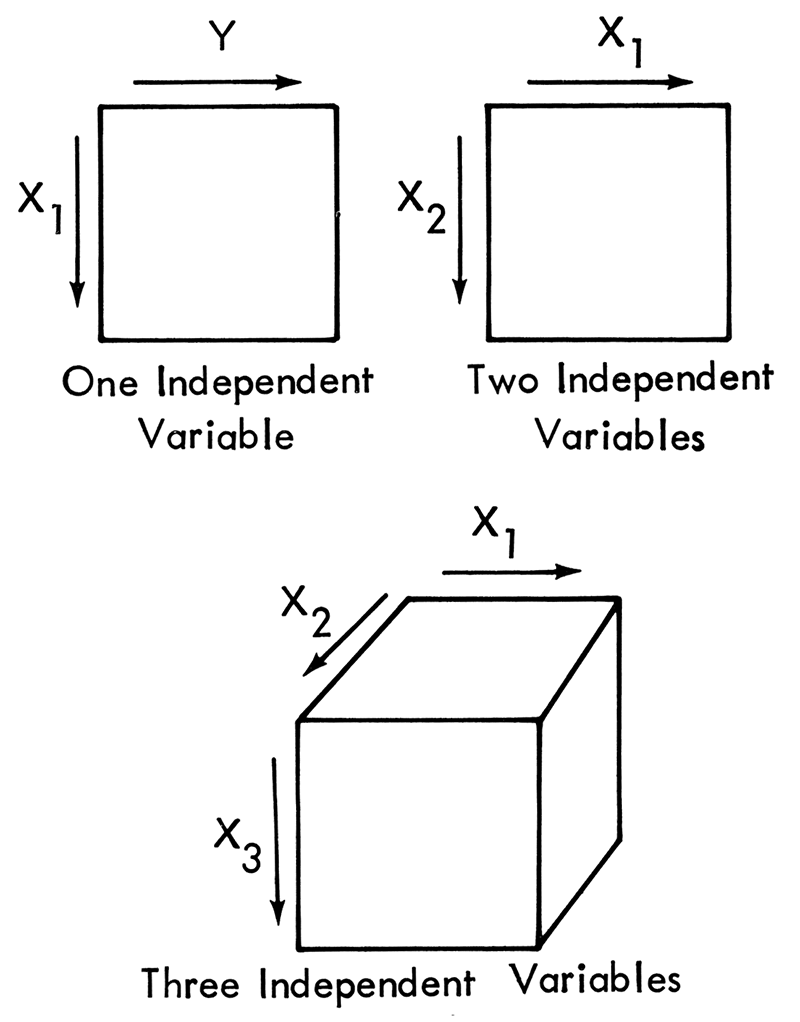
Coefficients of the matrix are printed out as a numbered list where each number corresponds to an entry in the linear equation Y = C1 + C2X1 + C3X2+ ... C36X35. The first coefficient is the value of the regression at the origin. Successive coefficients depend upon the number of independent variables used and the power of the polynomial equation. Table 1 lists variables, powers, and cross-products for coefficients in the various polynomial expansions. Orientation of geographic variables for trend and "4-D" maps is shown on Figure 1.
Figure 1—Orientation of graphic output from KWIKR8, showing orientation of variable axes. Values increase positively in directions shown by arrows.
Read the PDF version (10.2 MB)
Kansas Geological Survey
Placed on web Sept. 6, 2019; originally published 1968.
Comments to webadmin@kgs.ku.edu
The URL for this page is http://www.kgs.ku.edu/Publications/Bulletins/CC/28/index.html