Kansas Geological Survey, Bulletin 96, part 4, originally published in 1952
Originally published in 1952 as Kansas Geological Survey Bulletin 96, part 4. This is, in general, the original text as published. The information has not been updated.
Mine run salt from three underground workings, raw brine, and some prepared salt products were examined spectrochemically for elements occurring in trace amounts. One mineral was isolated and determined to be a potassium-bearing mineral, tentatively identified as polyhalite (K2SO4·MgSO4·2CaSO4·2H2O). This mineral has not been reported previously from samples of commercially mined Kansas salt. One other mineral was isolated and identified as celestite (SrSO4). This mineral occurs with anhydrite in the ratio of 1:0.129 (CaSO4 x 0.129=SrSO4). The red color sometimes found in commercially mined rock salt usually accompanies the celestite but has not been directly associated with the celestite. This red material has been shown not to be Fe2O3, as might be suggested by the color.
Extremely small amounts of Si, Al, V, Ti, Mn, Cr, Cu, Sn, Pb, Zn, and Ag were noted. These elements occurred as spectrographic traces with an estimated percentage of from 0.001 to about 0.0000001 or less. Large percentages of elements occurring in shale are not considered in the above list.
The salt industry is one of the older mineral industries in Kansas, starting in 1887. The present-day modern plants are producing nearly a million tons of salt annually. This study was made to determine, by use of scientific equipment unknown during the early history of the industry, if there were elements or compounds that occurred in trace amounts in the rock salt. Such detailed information might be of value to the salt industry and possible future users of Kansas salt because certain compounds, if found to be present in Kansas rock salt, might be an added source of revenue. Furthermore if any element or compound found to be present in trace amounts is determined to be deleterious for either present or potential future uses then these basic data would aid the industry by supplying them with advance information for planning removal methods. It should be immediately pointed out that no harmful element or compound has been found in Kansas salt and on the basis of this work it seems extremely unlikely that any will be found in the future. This statement is made in spite of the more than 2,000 basic uses of salt and the increasing complications and precision of modern industry (Taft, 1946). A few of many uses of salt in industry, agriculture, homemaking, and in medicines are shown in Table 1.
Table 1--Principal uses of salt, 1950, short tons (U.S. Bureau of Mines Mineral Industry Surveys, Mineral Market Report No. 2039).
| Use | Evaporated | Rock | Brine | Total |
|---|---|---|---|---|
| Chlorine, bleaches, chlorates | 419,000 | 739,000 | 2,731,000 | 3,889,000 |
| Soda ash | 6,379,000, | 6,379,000 | ||
| Dyes and organic chemicals | 68,000 | 81,000 | 149,000 | |
| Soap (precipitant) | 53,000 | 11,000 | 64,000 | |
| Other chemicals | 102,000 | 599,000 | 701,000 | |
| Textile processing | 29,000 | 99,000 | 128,000 | |
| Hides and leather | 112,000 | 143,000 | 255,000 | |
| Meat packing | 339,000 | 376,000 | 715,000 | |
| Fish curing | 34,000 | 12,000 | 46,000 | |
| Butter, cheese and other dairy products |
71,000 | 5,000 | 76,000 | |
| Canning and preserving | 138,000 | 25,000 | 163,000 | |
| Other food processing | 219,000 | 20,000 | 239,000 | |
| Refrigeration | 54,000 | 128,000 | 182,000 | |
| Livestock, agriculture and general farm use |
670,000 | 286,000 | 956,000 | |
| Highways, railroads, dust, and ice control |
12,000 | 554,000 | 566,000 | |
| Table and other household uses | 527,000 | 95,000 | 622,000 | |
| Water treatment | 278,000 | 270,000 | 548,000 | |
| Metallurgy | 28,000 | 65,000 | 93,000 | |
| Other uses | 177,000 | 419,000 | 263,000 | 859,000 |
| Total | 3,330,000 | 3,927,000 | 9,373,000 | 16,630,000 |
The remainder of this report describes the work of sampling and spectrographic analysis for trace constituents. Special thanks are extended to the salt-producing companies of Kansas who have cooperated fully with the Geological Survey in this work.
The samples used in this study were collected from the mine faces of several underground salt mines in Kansas. One brine sample was collected from the brine wells of the Carey Salt Company (sample 50-148).
Some preliminary work on the rock salt samples (Table 2) was necessary so that some of the elements present in very small amounts would be detected by the spectrograph. Each sample was subjected to a treatment which depended upon the solubility of the chemical compounds which were present. In general the following procedure was used. About 50 grams of the coarsely crushed sample was placed in a 250-ml beaker, and 200 ml of distilled water was added. The mixture was stirred intermittently, and allowed to stand for several hours, preferably over night. Because the solubility of salt is about 36 gm per 100 ml of water at room temperature, most of the halite and other compounds of comparable solubility would have dissolved in this time. The solution was then filtered and reserved for further treatment. The residue was washed sparingly with distilled water and allowed to dry. The residue, comprising the first concentrate to be used in the spectrographic study, was designated as the "insoluble fraction."
Table 2--Descriptions of salt samples discussed
| Sample no. |
Company, place, and year sampled |
Description |
|---|---|---|
| RES-1 | Carey Salt Company Lyons, Kans., 1943 |
Mine floor, 1,027 feet below top of shaft, shaly salt |
| RES-2 | Just above floor | |
| RES-3 | 3 feet above floor | |
| RES-4 | 6 feet above floor | |
| RES-5 | 6.75 feet above floor | |
| RES-6 | 8 feet above floor | |
| RES-7 | 10 feet above floor | |
| RES-8 | 12 feet above floor | |
| ELS-1 | Morton Salt Company Kanopolis, Kans., 1943 |
0 to 2.5 feet above mine floor, west face |
| ELS-2 | 2.5 to 5.0 feet above mine floor, west face | |
| ELS-3 | 5.0 to 7.8 feet above mine floor, west face | |
| ELS-4 | 7.8 to 8.0 feet above mine floor, west face | |
| ELS-5 | 0 to 2.5 feet above mine floor, east face | |
| ELS-6 | 2.5 to 5.0 feet above mine floor, east face | |
| ELS-7 | 5.0 to 8.0 feet above mine floor, east face | |
| ELS-8 | Spot sample from test pit, salt bed 60 feet below workings. | |
| C-41-1 | Carey Salt Company Hutchinson, Kans., 1942 |
Top 12 inches next to ceiling |
| C-41-2 | 12 to 30 inches below ceiling | |
| C-41-3 | 30 to 40 inches below ceiling | |
| C-41-4 | 40 to 58 inches below ceiling | |
| C-41-5 | 58 to 82 inches below ceiling | |
| C-41-6 | 82 to 100 inches below ceiling | |
| C-41-7 | 100 to 121 inches below ceiling | |
| C-41-8 | Spot sample from former ceiling, 40 inches below C-41-1 | |
| 50-35 | Carey Salt Company Hutchinson, Kans., 1950 |
0 to 2 feet from mine floor |
| 50-36 | 2 to 4 feet from mine floor | |
| 50-37 | 4 to 6 feet from mine floor | |
| 50-38 | 6 to 8 feet from mine floor | |
| 50,-39 | 8 to 10 feet from mine floor | |
| 50-148 | Raw brine from brine wells | |
| 50-29 | No. 2 rock salt, Carey Salt Company | |
| 50-29R | Selected parts from 50,-29 | |
| 50-29C | Selected parts from 50-29 | |
| 50-29B | Selected parts from 50-29 | |
| 50-459 | Polyhalite crystals selected microscopically from 50-36 |
The solution from the sample was evaporated on a steam bath or hot plate until the first crystals of solids formed. The solution was then decanted from the crystals and again reserved. The crystals were allowed to dry, and were stored for analysis as the "least soluble fraction" of the original soluble materials.
The remaining solute consisted mostly of sodium chloride, which had to be removed from the other materials present. It was assumed that almost all the other compounds present would remain in solution during continued evaporation, while the bulk of the sodium chloride would be deposited.
The evaporation of the solution was continued, and the crystals of salt which formed were crushed to release occluded solute and were discarded by decanting the solution into another beaker. Finally, when only a few drops of solution remained (less than 1 ml), it was taken to dryness and the residue was reserved as containing the "most soluble fraction" of the compounds present in the original sample.
In review, the samples were separated into the following fractions: (a) the insoluble fraction, (b) the least soluble fraction, and (e) the most soluble fraction. Although the method is by no means quantitative, any trace element present in the original sample should be found in much greater concentration in at least one of these fractions.
The spectrographic equipment and the film processing have been described in a previous paper (Reed, 1950, pp. 31-32). The film exposures were of 60 seconds duration, and the average intensity of the light emitted from the samples was limited by using a rotating sector which was opened to pass 30 percent of the maximum light energy. The samples were excited by volatilizing them from graphite crater electrodes with center posts in a D.C. are of 9.5 amperes; the electrodes were separated by a gap of 3 mm. The graphite counterelectrodes were of the platform-with-center-post shape, so as to prevent the are from creeping up the side of the electrode during the exposure. Magnetic rotation of the arc was used to insure the most even burning of the sample.
The spectrograms were examined on the densitometer-comparator for the presence of all elements listed on the master plate of the comparator. The relative light intensities of the elements were estimated visually according to an arbitrary scale which was based on previous spectrographic experience. These estimated relative intensities were recorded as "index numbers" to the concentrations of the elements present. They may be used to compare concentrations of one element present in different samples, but no comparison of different elements should be attempted either in the same sample or in different samples. The "index numbers" are, roughly, functions of the logarithms of the mass concentration of elements. For instance the index number 5 stands for 0.0001 percent or less of the element. The detectable limit of the spectrograph is estimated at 0.00000001 percent and the index numbers of 1 or below are of that magnitude. The numbers above 5 therefore are from 0.0001 to 1.0 percent. Table 3 shows the estimated relative intensities of the elements found in all samples studied.
Table 3--Elements observed spectrographically in Kansas salt*
| Part A--Insoluble fraction | ||||||||||||||||||
|---|---|---|---|---|---|---|---|---|---|---|---|---|---|---|---|---|---|---|
| Sample | B | Si | Fe | Al | V | Ti | Mn | Cr | Cu | Sn** | Pb** | Zn** | Ag | Na | K | Mg | Ca | Sr |
| RES-1 | 1 | 10 | 10 | 10 | 8 | 8 | 10 | 6 | 9 | 4 | 6 | 1 | 1 | 9 | 10 | 12 | 10 | 2 |
| RES-2 | 4 | 7 | 7 | 7 | 8 | 6 | 5 | — | 8 | 8 | 7 | 1 | 2 | 6 | 3 | 8 | 13 | 8 |
| RES-3 | 7 | 7 | 9 | 7 | 5 | 5 | 7 | — | 8 | 9 | 7 | 1/2 | 6 | 7 | 4 | 9 | 12 | 8 |
| RES-4 | 2 | 7 | 6 | 8 | 7 | 6 | 8 | 1 | 8 | 10 | 7 | <1/2 | 2 | 11 | 9 | 9 | 10 | 2 |
| RES-5 | — | 7 | 5 | 6 | 6 | 6 | 5 | — | 7 | 5 | 6 | 2 | 3 | 4 | — | 7 | 13 | 6 |
| RES-6 | 1 | 9 | 10 | 8 | 6 | 7 | 13 | 6 | 9 | 8 | 7 | 1/2 | 4 | 8 | 8 | 13 | 11 | 5 |
| RES-7 | 2 | 8 | 10 | 8 | 7 | 7 | 9 | 2 | 9 | 7 | 7 | — | 8 | 7 | 4 | 10 | 13 | 7 |
| RES-8 | 3 | 8 | 5 | 8 | 8 | 6 | 8 | 2 | 9 | 10 | 8 | 1/2 | 1 | 11 | 10 | 9 | 10 | 9 |
| ELS-1 | — | 6 | 8 | 7 | 5 | 5 | 6 | 1 | 7 | 6 | 8 | 1 | 4 | 3 | 3 | 8 | 13 | 9 |
| ELS-2 | — | 7 | 10 | 7 | 6 | 6 | 7 | 2 | 8 | 6 | 9 | 5 | 6 | 5 | 5 | 9 | 13 | 9 |
| ELS-3 | — | 7 | 7 | 7 | 7 | 6 | 6 | 1/2 | 7 | 7 | 8 | 3 | 3 | 4 | 2 | 7 | 12 | 6 |
| ELS-4 | — | 8 | 8 | 7 | 8 | 7 | 9 | 4 | 7 | 5 | 8 | 1 | 2 | 6 | 7 | 12 | 11 | 4 |
| ELS-5 | — | 5 | 6 | 6 | 5 | 4 | 4 | 1/2 | 7 | 7 | 8 | 1 | 7 | 4 | 1 | 7 | 12 | 7 |
| ELS-6 | — | 6 | 8 | 7 | 9 | 6 | 6 | 2 | 8 | 8 | 9 | 4 | 6 | 6 | 4 | 9 | 13 | 6 |
| ELS-7 | — | 5 | 7 | 7 | 6 | 5 | 5 | 1 | 7 | 7 | 6 | 1 | 5 | 5 | 3 | 8 | 13 | 5 |
| ELS-8 | — | 5 | 5 | 6 | 7 | 3 | 7 | — | 7 | 7 | 7 | 1 | 1/2 | 4 | 1/2 | 11 | 11 | 6 |
| C-41-1 | 1/2 | 5 | 4 | 6 | 5 | 3 | 5 | 1/2 | 6 | 3 | 2 | — | — | 9 | 7 | 7 | 10 | 6 |
| C-41-2 | — | 6 | 5 | 6 | 4 | 2 | 6 | — | 6 | 4 | 3 | — | — | 10 | 6 | 7 | 10 | 5 |
| C-41-3 | — | 8 | 9 | 6 | 3 | 4 | 8 | 4 | 6 | 3 | 1 | — | — | 4 | 3 | 12 | 9 | 5 |
| C-41-4 | 1/2 | 6 | 4 | 5 | 5 | 4 | 4 | — | 6 | 3 | 1/2 | — | — | 2 | 1 | 6 | 12 | 8 |
| C-41-5 | — | 5 | 2 | 5 | 6 | 1 | 2 | — | 5 | 2 | <1/2 | — | — | 10 | 1/2 | 6 | 12 | 9 |
| C-41-6 | — | 6 | 3 | 5 | 7 | 3 | 1 | — | 6 | 3 | 1/2 | — | — | 8 | — | 5 | 13 | 8 |
| C-41-7 | — | 6 | 4 | 6 | 7 | 3 | 2 | 1/2 | 6 | 4 | — | — | — | 3 | — | 6 | 13 | 6 |
| C-41-8 | — | 7 | 8 | 7 | 5 | 4 | 7 | — | 6 | 3 | 1/2 | 2 | — | 5 | 3 | 10 | 11 | 7 |
| 50-35 | — | 5 | 5 | 5 | 4 | 3 | 4 | 2 | 5 | 2 | — | — | — | — | — | 6 | 12 | 6 |
| 50-36 | — | 6 | 6 | 6 | 5 | 2 | 4 | 1 | 6 | 3 | — | — | — | 1 | — | 5 | 12 | 7 |
| 50-37 | 4 | 4 | 8 | 6 | 3 | 6 | 5 | 1 | 5 | 4 | 3 | — | — | 2 | — | 6 | 10 | 6 |
| 50-38 | 5 | 5 | 10 | 6 | 5 | 7 | 7 | 3 | 4 | 1 | 2 | — | — | 4 | — | 8 | 10 | 5 |
| 50-39 | 7 | 7 | 12 | 7 | 4 | 8 | 7 | 3 | 6 | — | 3 | — | — | 5 | — | 9 | 9 | 5 |
| Part B--Least soluble fraction | ||||||||||||||
|---|---|---|---|---|---|---|---|---|---|---|---|---|---|---|
| Sample | B | Si | Fe | Al | V | Ti | Cr | Cu | Ag | Na | K | Mg | Ca | Sr |
| RES-1 | 1/2 | 4 | 5 | 6 | 5 | 1/2 | 6 | 1/2 | — | 11 | 1/2 | 9 | 12 | 7 |
| RES-2 | — | 3 | 3 | 5 | 3 | — | — | 5 | 1/2 | 11 | — | 8 | 9 | 6 |
| RES-3 | — | 3 | 3 | 3 | 6 | 2 | — | 3 | — | 8 | — | 6 | 6 | 5 |
| RES-4 | 1/2 | 4 | 3 | 4 | 1/2 | — | — | 4 | — | 10 | — | 8 | 7 | 5 |
| RES-5 | — | 2 | 4 | 3 | — | — | — | 5 | — | 9 | — | 7 | 6 | 5 |
| RES-6 | — | 4 | 4 | 3 | 1/2 | — | — | 4 | — | 9 | — | 7 | 6 | 5 |
| RES-7 | — | 5 | 5 | 5 | 1 | — | — | 5 | — | 8 | — | 7 | 7 | 5 |
| RES-8 | — | 2 | 2 | 5 | 5 | 1 | — | 5 | — | 9 | — | 7 | 7 | 5 |
| ELS-1 | — | 4 | 4 | 4 | 4 | 1 | — | 4 | — | 9 | — | 8 | 7 | 5 |
| ELS-2 | — | 3 | 3 | 3 | 5 | 2 | — | 4 | — | 9 | — | 8 | 6 | 5 |
| ELS-3 | — | 3 | 2 | 5 | 6 | 2 | — | 3 | — | 8 | — | 7 | 6 | 4 |
| ELS-4 | — | 2 | 2 | 6 | 5 | 2 | — | 4 | 2 | 9 | — | 8 | 10 | 7 |
| ELS-5 | — | 4 | 3 | 6 | 3 | 2 | — | 6 | — | 7 | — | 7 | 7 | 5 |
| ELS-6 | — | 3 | 3 | 2 | 6 | 4 | — | 4 | — | 9 | — | 8 | 7 | 5 |
| ELS-7 | — | 4 | 3 | 6 | 3 | 1/2 | — | 5 | 1/2 | 10 | — | 9 | 8 | 5 |
| ELS-8 | — | 3 | 2 | 4 | 2 | — | — | 3 | — | 9 | — | 8 | 8 | 5 |
| C-41-1 | — | 3 | 5 | 4 | 6 | 3 | — | 6 | — | 10 | — | 7 | 7 | 6 |
| C-41-2 | — | 3 | 3 | 3 | 6 | 4 | — | 6 | — | 9 | — | 6 | 6 | 5 |
| C-41-3 | — | 2 | 3 | 6 | 3 | 1 | — | 4 | — | 10 | — | 7 | 7 | 6 |
| C-41-4 | — | 2 | 2 | 5 | 5 | 1 | — | 4 | — | 8 | — | 6 | 6 | 5 |
| C-41-5 | — | 2 | 2 | 4 | 7 | 2 | — | 5 | — | 10 | 2 | 8 | 7 | 7 |
| C-41-6 | — | 4 | 3 | 4 | 7 | 5 | — | 5 | — | 10 | 3 | 8 | 8 | 7 |
| C-41-7 | — | 2 | 2 | 3 | 6 | — | — | 5 | — | 10 | — | 7 | 7 | 5 |
| C-41-8 | — | 2 | 3 | 3 | 8 | 6 | — | 6 | — | 12 | — | 9 | 10 | 8 |
| 50-35 | — | 4 | 1 | 2 | 5 | 4 | 1/2 | 2 | — | 9 | — | 4 | 10 | 5 |
| 50-36 | — | 3 | 1/2 | 1/2 | 4 | 3 | — | 2 | — | 8 | — | 5 | 9 | 5 |
| 50-37 | — | 4 | 1 | 2 | 5 | 3 | — | 3 | — | 10 | — | 6 | 10 | 5 |
| 50-38 | — | 5 | 2 | 4 | 4 | 4 | — | 3 | — | 7 | — | 5 | 10 | 5 |
| 50-39 | — | 3 | 1 | 1 | 3 | 4 | — | 2 | — | 10 | — | 4 | 10 | 5 |
| 50-148 | 1 | 4 | 2 | — | 5 | 1 | — | 4 | — | 7 | — | 5 | 10 | 3 |
| Part C.-Most soluble fraction | ||||||||||||||||||
|---|---|---|---|---|---|---|---|---|---|---|---|---|---|---|---|---|---|---|
| Sample | B | Si | Fe | Al | V | Ti | Mn | Cu | Ag | Na | K | Mg | Ca | Sr | ||||
| RES-1 | 3 | 1 | 1 | 3 | 3 | 1 | — | 2 | — | 10 | 5 | 9 | 7 | 1 | ||||
| RES-2 | — | 2 | 1 | 2 | 3 | 2 | — | 4 | — | 12 | 1/2 | 8 | 9 | 5 | ||||
| RES-3 | — | 3 | 2 | 4 | 2 | 1/2 | — | 4 | — | 11 | 1/2 | 8 | 10 | 7 | ||||
| RES-4 | — | 2 | 1/2 | 1 | 1 | 1/2 | — | 4 | — | 9 | — | 7 | 7 | 4 | ||||
| RES-5 | — | 2 | 2 | 1 | 4 | 1 | — | 5 | — | 12 | — | 9 | 9 | 4 | ||||
| RES-6 | — | 1 | 1 | 2 | 2 | 1 | — | 3 | — | 10 | 1/2 | 8 | 10 | 4 | ||||
| RES-7 | — | 1 | 1 | 1 | 3 | 2 | — | 5 | — | 11 | 1/2 | 8 | 9 | 4 | ||||
| RES-8 | — | 1 | 1 | 1 | 1 | 1/2 | — | 6 | — | 10 | — | 7 | 7 | 4 | ||||
| ELS-1 | — | 3 | 1 | 1 | 1/2 | 1/2 | — | 2 | — | 9 | — | 8 | 6 | 6 | ||||
| ELS-2 | — | 2 | 1 | 2 | 3 | 1 | — | 3 | — | 10 | 1 | 8 | 7 | 7 | ||||
| ELS-3 | — | 1 | 1 | 1/2 | 4 | 3 | — | 5 | — | 11 | 1/2 | 9 | 8 | 7 | ||||
| ELS-4 | — | 2 | 2 | 1 | 3 | 2 | — | 2 | — | 9 | 1/2 | 8 | 7 | 4 | ||||
| ELS-5 | — | 2 | 1/2 | 1/2 | — | 1/2 | — | 4 | — | 10 | — | 9 | 8 | 5 | ||||
| ELS-6 | — | 2 | 1 | 3 | 2 | 3 | — | 3 | — | 9 | 1/2 | 8 | 7 | 5 | ||||
| ELS-7 | — | 3 | 1 | 4 | 1 | 1 | — | 4 | — | 11 | 1 | 9 | 9 | 5 | ||||
| ELS-8 | — | 3 | 1 | 1 | 1 | 1/2 | — | 5 | — | 12 | 1/2 | 10 | 9 | 6 | ||||
| C-41-1 | — | 1 | 3 | 1 | 4 | 3 | — | 3 | — | 10 | <1/2 | 7 | 9 | 6 | ||||
| C-41-2 | <1/2 | 1 | 2 | 1 | 2 | 1/2 | — | 4 | 1 | 12 | 1/2 | 8 | 8 | 5 | ||||
| C-41-3 | <1/2 | 2 | 1 | 3 | 1 | 1/2 | — | 3 | — | 9 | 1 | 7 | 9 | 7 | ||||
| C-41-4 | — | 1 | 2 | 2 | 5 | 1 | — | 4 | 1 | 13 | 3 | 10 | 9 | 7 | ||||
| C-41-5 | — | 1/2 | 1 | 3 | 3 | 1/2 | — | 4 | — | 8 | 7 | 6 | 7 | 6 | ||||
| C-41-6 | — | 3 | 2 | 5 | 4 | 1 | — | 4 | — | 10 | 7 | 10 | 10 | 7 | ||||
| C-41-7 | — | 2 | 1/2 | 2 | 2 | 1 | — | 2 | — | 9 | 1 | 7 | 9 | 5 | ||||
| C-41-8 | 1/2 | 2 | 1/2 | 1/2 | 5 | 2 | — | 3 | — | 9 | 1/2 | 8 | 8 | 5 | ||||
| 50-35 | — | 4 | 3 | — | 4 | 4 | — | 5 | — | 9 | — | 6 | 9 | 4 | ||||
| 50-36 | — | 4 | 1 | — | 1/2 | 1/2 | — | 5 | — | 9 | 5 | 8 | 8 | 5 | ||||
| 50-37 | 3 | — | 4 | 2 | 6 | 2 | — | 5 | 2 | 8 | — | 6 | 7 | 5 | ||||
| 50-38 | 5 | 6 | 3 | 5 | 7 | 5 | — | 6 | 5 | 8 | — | 7 | 10 | 5 | ||||
| 50-39 | 2 | 4 | 4 | 4 | 8 | 6 | — | 5 | 4 | 9 | — | 7 | 9 | 5 | ||||
| 50-148 | 3 | 2 | 3 | 1 | 4 | 2 | 1/2 | 3 | — | 10 | 2 | 7 | 7 | 2 | ||||
| *The numbers in the table represent approximately the following percentages: 10, 1.0 or more; 9, 0.1; 8, 0.01; 7, 0.001; 6, 0.0001; 5, 0.00001; 4, 0.000001; 3, 0.0000001; 2, 0.00000001; 1 and 1/2, less than 0.00000001. **Sn, Pb, and Zn probably derived from plant equipment. |
||||||||||||||||||
Samples for which a dash (—) is recorded for any element either did not contain the element, or the element was present in indetectable concentration. Also, elements not listed may occur in indetectable amounts. Many elements, notably the halogens (F, Cl, Br, I), oxygen, and nitrogen, are not detectable with the available spectrographic equipment. Sulfur is also not detectable with this equipment, but tests for sulfate were conducted chemically. Chemical analyses for the halogens were not made because semiquantitative tests for Br and I were made by the State Geological Survey in 1943 on the RES sample suite, and the concentrations of Br and I were found to be negligible if present at all.
Although sodium, calcium magnesium, and strontium were present in more than trace amounts, they were listed as a means of estimating the degree of separation of the other elements from the original sample.
The insoluble, residues (Table 3, Part A) consisted primarily of sodium chloride, calcium and strontium sulfates, and shale. These materials might have been the sources of some of the elements found in the other two fractions. Some general observations may be made. (1) Elements more abundant in the least soluble fraction than in the most soluble fraction are Si, Fe, Al, V, Ti, and Ag. (2) Elements more abundant in the most soluble fraction than in the least soluble fraction are B and K. (3) Elements remaining nearly constant in both of the fractions are Cu, Na, Mg, Ca, and Sr. These observations indicate that the waste liquors of a commercial salt-refining process using fractional crytallization are probably enriched in boron and potassium as compared with the original salt.
The actual percentage concentrations of most of the elements listed, other than Na, Ca, Mg, and Sr, may be estimated from the spectrographic data, aside from those elements present in the shale. Perhaps the most noteworthy element detected was potassium.
Although potassium occurs in appreciable concentrations in the insoluble residues, most of this could be attributed to the water insoluble potassium in the shale. However, fairly high concentrations of potassium appeared in the most soluble fraction, as compared with the least soluble fraction. There was apparently a source of water-soluble potassium present in the original samples, such as the mineral polyhalite. This mineral, if present, could release potassium into the solution in much greater quantities than could be expected from the shale. Chemical and petrographic studies for the detection and identification of some potassium-bearing mineral were indicated. Additional data pointing toward a potassium mineral such as polyhalite (K2SO4·MgSO4·2CaSO4·2H2O) was the correlation between the increase in the potassium concentration and a similar increase in calcium, magnesium, and strontium concentrations. The first samples to be suspected were No. 2 rock salt from Carey's Hutchinson mine and selected red pieces from the No. 2 salt. Similar small increases were then looked for and detected in many of the mine face samples.
The occurrence of potash minerals such as polyhalite in company with calcium and strontium sulfate in evaporites has been substantiated by other workers (Rankama and Sahama, 1950, p. 481).
The occurrence of potash as a complex sulfate suggests that with the relatively low solubility of sulfates and with an as yet unknown irregularity in deposition potash could escape detection. This would explain the infrequent report of small percentages of potash detected in Kansas salt (Taft, 1946, pp. 236, 257) and the lack of potash in many other analyses run on a brine-soluble basis rather than a true water-soluble basis. Table 4 shows chemical analyses made in the Carey Salt Company laboratory on a routine basis and by the Geological Survey in 1943. Table 5 shows special partial analyses made in the Survey geochemistry laboratory in 1950. These partial analyses were made using an average of 800 ml of water for a 1 gram sample.
Table 4--Analyses of mine face salt.
| Sample | Acid insoluble |
Iron oxide |
CaSO4 | CaCl2 | MgSO4 | MgCl2 | Na2SO4 | NaCl | Water insoluble |
Moisture as received |
|---|---|---|---|---|---|---|---|---|---|---|
| 50-25* | 0.005 | 0.003 | 3.020 | 0.008 | 0.126 | 98,838 | 1.678 | 0.031 | ||
| 50-36* | 0.066 | 0.007 | 2.279 | 0.509 | 0.154 | 96.985 | 0.934 | 0.069 | ||
| 50-37* | 0.032 | 0.005 | 3.582 | 0.105 | 0.125 | 96.151 | 2.119 | 0.062 | ||
| 50-38* | 0.264 | 0.034 | 3.047 | 0.420 | 0.382 | 95.852 | 2.026 | 0.088 | ||
| 50-39* | 0.319 | 0.034 | 2.084 | 0.025 | 0.288 | 94.250 | 1.505 | 0.089 | ||
| No. 2 (white)* | 0.009 | 0.001 water soluble (0.00010) |
8.143 | 0.017 | 0.043 | 99.787 | 0.018 | 0.023 | ||
| No. 2 (red)* | 0.030 | 0.030 water soluble (0.00008) |
9.671 | 1.926 | 1.450 | 86.919 | 4.639 | 0.031 | ||
| No. 2 (black)* | 1312 | 0.081 | 4.945 | 0.089 | 0.880 | 92.693 | 5.964 | 0.157 | ||
| No. 2 rock (average)* |
1.32 | 0.01 | 5.61 | 0.21 | 0.18 | 92.67 | 4.24 | 0.07 | ||
| RES-2** | 2.18 | 0.21 | 0.01 | 96.63 | 0.84 | 0.09 | ||||
| RES-3** | 1.84 | 0.64 | 95.82 | 1.48 | 0.20 | |||||
| RES-4** | 0.93 | 0.20 | 0.21 | 97.08 | 0.18 | 1.40 | ||||
| RES-5** | 2.16 | 0.02 | 96.00 | 1.63 | 0.18 | |||||
| RES-7** | 2.41 | 0.05 | 0.05 | 95.71 | 1.53 | 0.27 | ||||
| RES-8** | 2.07 | 95.83 | 2.02 | 0.07 | ||||||
| RES-Am** Composite of American Mine, Lyons, Kans. |
2.06 | 0.01 | 0.10 | 95.94 | 1.68 | 0.18 | ||||
| Lyons† | Insoluble residue 0.17 |
1.20 | 0.51 (one sample) |
0.06 | 0.64 | 98.03 | ||||
| Kingman‡ | Insoluble residue 0.10 |
0.11 (one sample) |
0.55 | 0.09 | 0.42 | 98.94 | ||||
| Analyses by C. W. Jobes, analyst (Paul V. Imes, chief chemist), Carey Salt Company, Hutchinson, Kansas. Analyses by Raymond Thompson, State Geological Survey, 1943. †Bailey, 1902, p. 73, rock salt, average sample. ‡Bailey, 1902, p. 73, average rock salt (3 analyses). |
||||||||||
Table 5--Partial analyses of Kansas salt
| Sample no. |
Acid insoluble |
Fe2O3 | SO3 | CaO* | SrO | MgO | K2O | H2O 105° to 110°C. |
NaCl calculated |
|---|---|---|---|---|---|---|---|---|---|
| 50-29 | 0.28 | 0.02 | 4.31 | 2.76 | 0.49 | 0.21 | 0.40 | ||
| 50-29R | 0.06 | 0.024 | 6.42 | 4.10 | 0.76 | 0.53 | 1.77 | ||
| 50-459 | 27.11 | 7.67 | 3.26** | 47.10t | |||||
| 50-35 | 2.07 | 1.79 | 0.04 | 0.027 | 96.06 | ||||
| 50-36 | 1.89 | 1.28 | 0.05 | 0.069 | 96.63 | ||||
| 50-37 | 1.81 | 1.47 | 0.06 | 0.058 | 96.56 | ||||
| 50-38 | 1.34 | 1.11 | 0.13 | 0.051 | 97.08 | ||||
| 50-39 | 0.74 | 0.72 | 0.06 | 0.0688 | 98.06 | ||||
| *Strontium oxide not separated unless shown in next column. **Loss of weight recorded after heating to 400° centigrade. †Determined by titration with standard silver nitrate. |
|||||||||
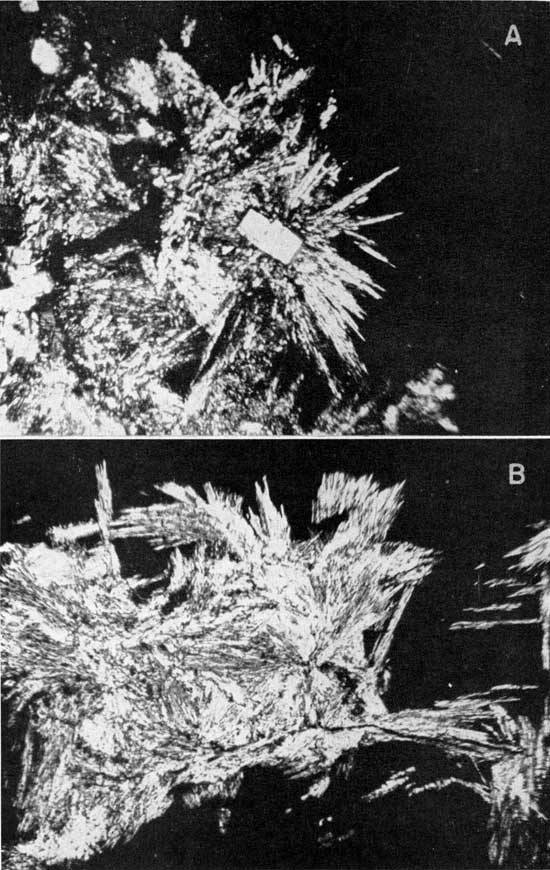
These first few facts were later substantiated by petrographic and X-ray diffraction analyses of selected pieces from No. 2 salt and from selected pieces in the 2 to 4 foot section of the Carey mine. Sample 50-459 is from this section; it was obtained by selecting pieces of polyhalite under a microscope. The partial analysis (petrographic and chemical) showed about 50 percent of the material to be polyhalite, or a very similar potash mineral. Analyses of picked red and opaque pieces from Carey's No. 2 salt (50-29R) showed about 11.3 percent of the mineral calculated from the K2O content while the No. 2 rock salt (50-29) showed 2.6 percent. Photomicrographs of the mineral from 50-29R are shown in Plate 1. Examination of a core from the Hutchinson salt member showed two 4-foot zones that contained 5.8 and 8.7 percent polyhalite. These zones occur about 100 feet above the beds being mined for salt.
Plate 1--Polyhalite in No. 2 rock salt (50-29R). A, Rectangular-appearing crystals of high index of refraction are calcium sulfate; halite is black background; magnification 100x, crossed nicols. B, Black background is halite. Magnification 200x, crossed nicols. [Note: image larger and magnifications recalculated for web presentation.]
Calcium and strontium were determined by precipitation as the combined oxalates (Hillebrand and Lundell, 1946, pp. 486-505), ignited to the oxides, and weighed. These oxides were then carefully converted to the sulfates with H2SO4, ignited, and reweighed. Simultaneous equations were then used to calculate the amount of calcium and strontium. This method for the determination of CaO and SrO without actually separating them is thought to be as accurate as the usual method provided the weight of precipitate is large enough to weigh and very careful separation as combined oxalates is conducted. ne ratio of SrSO4 to CaSO4 in the No. 2 rock salt was found to be 0.129 to 1.
Iron and copper were examined more extensively than the other minor elements because of their possible deleterious effects in processes using commercial salt products. Copper is suspected of being a catalyst which causes rancidity of animal or vegetable oils in prepared foods. Iron is suspected of causing discoloration of hides in the tanning processes used by the meat packing industry.
Both iron and copper were determined spectrographically by means of an adaptation of the so-called "total energy method" (Marks and Hall, 1946, p. 7). This method is based on the fact that the total radiant energy emitted from an element in a sample which is excited by thermal or electrical means is directly proportional to the mass of the element present in the sample. The spectral lines are photographed as a spectrogram, and the mass of the element sought is determined indirectly from the blackness or opacity of a selected photographed spectral line of this element (Reed, 1950, pp. 25-26).
Copper--Table 3 indicates that there is a sharp decrease of copper between the insoluble residues and the two soluble fractions of the salt samples. It is apparent that a major part of the copper in the original salt formation is not water soluble, and is rejected with other insoluble impurities during brining operations. Consequently, the total copper present in the original salt and the copper which is water soluble and which would remain in refined salt products are quite different. Several salt samples representing different commercial products were obtained to be used as typical refined salt products, and were analyzed for their copper content by comparing them with synthetic standard samples.
Synthetic spectrographic standard samples were required to be used as comparison standards in the copper analyses. Copper was removed from a quantity of granulated sodium chloride by precipitation in acid solution with hydrogen sulfide (Hillebrand and Lundell, 1946, pp. 55-194). A qualitative spectrographic analysis showed this salt to contain copper in no greater amount than that already present in the spectrographic graphite electrodes. This standardized salt was used to prepare samples containing 0.001, 0.0001, 0.00001, 0.000001, and 0.0000001 percent by weight of copper. The unknown salt samples were compared spectrographically with these standards; the copper concentration in seven grades of refined salt was found to range from 0.000001 to less than 0.00000001 percent copper. No definite concentrations have been assigned, because the copper concentrations were found to vary widely even within the same sample. The range of concentrations is believed to provide reasonable estimates of the copper in typical salt products.
Iron--No. 2 crushed rock salt was assumed to be typical of the salt generally used in preparing brines for use, in hide tanning. The No. 2 crushed rock salt from the Carey mines contains a mixture of three different colorations of salt: colorless, red or pink, and black (shaly), the colorless salt predominating. Because these three colorations might release, iron into solution in different amounts, crystals of each color were separated by hand from a representative sample of No. 2 crushed rock salt. The insoluble materials in each color of salt were removed by dissolving and filtering, the solutions then being taken to dryness.
The samples were analyzed spectrographically for iron by comparison with samples analyzed previously by chemical means. From the comparisons, these approximate spectrographic analyses were made: colorless crystals, 0.00007 percent Fe2O3; black crystals, 0.0002 percent Fe2O3; and red crystals, 0.007 percent Fe2O3. Chemical analyses for total iron show 0.024 percent Fe2O3 in the red crystals and 0.020 percent Fe2O3 in the original No. 2 crushed rock salt.
Chemical tests for brine-soluble iron oxide were performed but the concentrations of iron were so low that volumetric methods ordinarily used were not sensitive enough for usual accuracy. The results were: 0.00025 percent Fe2O3 for the original No. 2 rock salt; 0.000086 percent for red pieces; 0.00030 percent for colorless pieces; and 0.000074 percent for black pieces. The results obtained colorimetrically by the Carey Salt Company in their laboratory (Table 4) agree as to the order of magnitude of brine-soluble iron.
The values given above indicate that although there is a range of Fe2O3 content among the different colors of No. 2 rock salt, the overall value of 0.02 percent total ferric oxide is much less than should be expected if all the red coloration were due to ferric oxide. Both polyhalite and celestite are noted for a red to pink coloration. This coloration in Kansas salt seems to be associated with these two minerals.
A number of other elements were detected in the salt in spectrographic traces. These elements are not of any importance commercially but are interesting. Undoubtedly a part of these elements entered the samples by contamination. It is our opinion, however, that most of the elements detected were in the salt. One exception is small amounts of tin, lead, and zinc found in the insoluble fractions. These, elements are due to solder or something similar from handling equipment. If these three elements were deposited with the salt we would expect to, find at least zinc in the other fractions. As zinc was not detected in the other two fractions it seems probable that very minute particles of solder have contaminated the samples.
Also as mentioned previously the shale minerals found in the rock salt could contribute, some of the trace elements found in the various fractions. This is true of silver, chromium, titanium, and vanadium. It is also true of silica, alumina, and iron. Copper and boron are common trace elements found in shale as well as manganese. It is interesting to note from Table, 3 that manganese appeared only in the insoluble fraction and that copper decreases sharply from the ' insoluble fraction to the least soluble fraction and again in the most soluble fraction.
Another observation that can be made from Table 3 is the comparison of sample 50-148 (which is raw brine from a brine well) with the rock salt samples. Since there was no insoluble material in the brine it is included only in the last two fractions. This raw brine contained all the observed elements in rock salt except chromium and silver. The absence of these elements and the extremely low aluminum concentration suggests that colloidal-size material was carried over in our samples from one fraction to another. Otherwise the, raw brine acted essentially the same as the rock salt. It is interesting to note that boron, sodium, potassium, and magnesium seem to increase in the most soluble fraction while calcium and strontium decrease. Copper, vanadium, and silica also decrease.
Mine run salt from the Wellington formation in Kansas has been found to contain small percentages of polyhalite (K2SO4·MgSO4·2CaSO4·2H2O) and celestite (SrSO4), in addition to the known amounts of anhydrite (calcium sulfate) and shale. Only extremely small amounts of other elements were detected. These elements are shown in Table 3. No commercial value could be assigned to any of the minor elements detected except potassium (occurring as the mineral polyhalite). This mineral, if found in a minable thickness, would have value as a potash source. Additional studies by the geochemistry laboratory are in progress toward this end. It is our opinion that no deleterious elements or compounds exist in the Kansas salt or that if considered to be deleterious the concentration of all these minor elements is far below any critical concentration.
Bailey, E. H. S. (1902) Special report on mineral waters: Univ. Geol. Survey of Kansas, vol. 7, pp. 1-343, pls. 1-38.
Hillebrand, W. G., and Lundell, G. E. F. (1946) Applied inorganic analysis: John Wiley & Sons, Inc., New York, 9th prtg., pp. 1-929, figs. 1-40.
Marks, G. W., and Hall, H. T. (1946) A method for the spectrochemical determination of germanium, tin, and lead in ore samples: U. S. Bur. Mines, Rept. Investi. 3965, pp. 1-38, figs. 1-24.
Rankama, Kalervo, and Sahama, Th. G. (1950) Geochemistry: Univ. Chicago Press, pp. 1-912, figs. 1.0-44.2.
Reed, A. C. (1950) Spectrographic analysis for vanadium in Kansas clays: Kansas Geol. Survey, Bull. 86, pt. 2, pp. 21-40, figs. 1-2. [available online]
Taft, Robert (1946) Kansas and the nation's salt: Kansas Acad. Sci. Trans., vol. 49, no. 3, pp. 223-272, figs. 1-14.
Kansas Geological Survey, Oil Shale in Kansas
Placed on web Jan. 15, 2009; originally published in March 1952.
Comments to webadmin@kgs.ku.edu
The URL for this page is http://www.kgs.ku.edu/Publications/Bulletins/96_4/index.html