Kansas Geological Survey, Bulletin 70, pt. 5, originally published in 1947
Originally published in 1947 as of Kansas Geological Survey Bulletin 70, pt. 5. This is, in general, the original text as published. The information has not been updated. This publication is also available as an Acrobat PDF file (4 MB). Plates are available separately.
A magnetic survey of southeastern Crawford County was undertaken in an attempt to develop a technique by means of which geologic structures could be mapped in detail over large areas so that exploration can be conducted for a northward extension of the Tri-State zinc and lead mining district in Kansas.
The magnetometer was used successfully to map the location and trend of significant structures in southeastern Crawford County. It is indicated that, in this area, magnetic anomalies probably bear an inverse relationship to structural elevation.
Structures which might be favorable for the localization of lead and zinc mineralization are indicated to exist in the area studied. Therefore, exploratory drilling for the purpose of locating ore bodies would be justified, especially along minor structural highs inferred from the magnetic survey.
The accelerated war-time production of zinc and lead ores has caused a marked depletion in the known reserves of the TriState district, which includes southeastern Kansas. As a result, the State Geological Survey of Kansas has received numerous requests for aid in exploring for possible extensions of the TriState district in Kansas.
During the summer of 1941, the State Geological Survey of Kansas, in cooperation with the Tri-State Zinc and Lead Ore Producers' Association, made extensive geophysical investigations in the Tri-State zinc and lead mining district (Jakosky, Dreyer, and Wilson, 1942). These investigations included the use of magnetic, resistivity, natural potential, gravity, geochemical, and geothermal prospecting techniques over known structures and known ore bodies in an attempt to ascertain whether any combination of geophysical methods could be used (a) in prospecting directly for zinc and lead ores or (b) in prospecting for geologic structures which might be favorable for the localization of ore bodies. These studies indicated that there is little hope in direct prospecting for zinc and lead ores in the Tri-State district by geophysical techniques, but that .certain techniques might be successfully used for mapping regional and local structures.
In the light of the studies mentioned, it has seemed that the greatest contribution to ore exploration could be made by attempting to develop a geophysical method for detailed mapping of geologic structures over large areas. A knowledge of geologic structure is a prerequisite in prospecting for lead and zinc as well as for oil and coal. It was hoped, therefore, that a geophysical survey might furnish a speedy method of determining detailed geologic structure as an aid to general subsurface exploration for a northward extension of the zinc fields as well as an aid in exploring for coal and oil.
Magnetic surveying was selected not only because it is the speediest of the regional geophysical prospecting methods, but also because both the 1941 survey and a recent aero-magnetic survey of the Tri-State district by the U. S. Geological Survey showed the presence of large magnetic irregularities in the southeastern Kansas area.
The southeastern quarter of Crawford County was selected as the site for this magnetic survey because (1) it is directly north of known lead and zinc deposits in the Tri-State area, (2) it is an area of active coal mining, (3) it is an area in which petroleum production has been very small in spite of some indications that more production might be expected, (4) it has not been covered by a previous geophysical survey, and (5) most of the area is covered by a structural map (Pierce and Courtier, 1937, Pl. 5) showing the general location of a major structural feature, the Pittsburg anticline, and several minor structures.
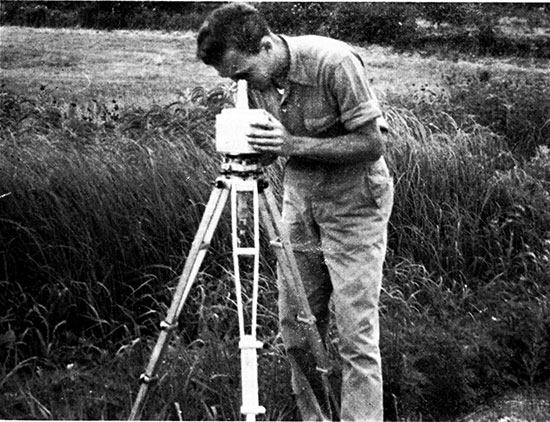
The magnetic survey under discussion was made during June and July 1947 using a thermally compensated Ruska vertical magnetometer (Pl. 3) capable of reading a variation of one gamma in the vertical magnetic intensity. Corrections were made for latitude, longitude, and diurnal variations. Stations were placed at quarter-mile intervals along all section line roads except in urban areas. The base was an assumed value of 42 gammas at the junction of the Crawford-Cherokee County line with the Missouri border. This value corresponds to the vertical intensity obtained at that point on 0. recent detailed survey by the Missouri Geological Survey.
Plate 3--Taking a magnetometer reading in Crawford County.
The help given by Mr. Victor Rakowsky of Joplin, Dr. George E. Abernathy of the State Geological Survey of Kansas, and Mr. Julian Hawes of Tulsa, as well as the advice given by Mr. George M. Fowler and Mr. D. R. Stewart of Joplin is gratefully acknowledged. It likewise is a pleasure to acknowledge the excellent services of my fiield assistants, G. L. Campbell, R. A. Hartenberger, and E. L. Suagee.
The geologic section of southeastern Crawford County is composed of about 1700 feet of Paleozoic sedimentary rocks which overlie the pre-Cambrian basement rocks and which dip very gently to the northwest. The Pennsylvanian Cherokee shale crops out over most of this area. The Cherokee consists of about 400 feet of shales, coals, and numerous impure sandstones. According to G. E. Abernathy (personal communication) many of the sandstones in the Cherokee group have a high magnetite content. Lying disconformably beneath the Cherokee is about 400 feet of Mississippian limestone below which is several hundred feet of Ordovician and Cambrian sedimentary rocks-largely dolomites. Beneath the sedimentary strata are igneous and possibly metamorphic rocks composing the basement.
Pierce and Courtier (1937, Pl. 5) have indicated the structure of southeastern Crawford County by means of structure contours drawn on the Weir-Pittsburg coal seam. This map was prepared on the basis of geologic field mapping and a study of drill records. Part of this structural map has been adapted for reproduction here as Plate 2. The structure contour elevations of the original map have been reduced by 220 feet (Pierce and Courtier, p. 54) so that the contours shown on Plate 2 give the approximate elevation of the surface of the Mississippian limestone.
The most prominent structural feature is the Pittsburg anticline, which is described by Pierce and Courtier (p. 53) as follows.
It has a maximum structural relief of about 70 feet and ranges in width from 4 miles in the southeastern part to 2 miles in the northwestern part. The anticline extends for an undetermined distance in Missouri. It enters Kansas near the southeast corner of T. 30 S., R. 25 E., trends northwestward to Capaldo and then swings west-northwest to Girard. In T. 30 S., R. 25 E., the crest of the anticline plunges to the northwest, but beyond Capaldo it rises again and the anticline is a narrow, slightly domed fold which has a minimum closure of about 20 feet.
Closed depressions from 10 to 20 feet in depth are not uncommon in the area. These may be due in part to compaction phenomena. Others, however, are of much greater depth and are probably attributable to some other cause--perhaps to solution of the Mississippian limestone, with subsequent sinking of the overlying Cherokee shale.
According to Abernathy (personal communication), a stratigraphic re-interpretation of available drill records indicates that the exact location and trend of some of the structures shown on the reproduced structural map (Pl. 2) are somewhat inaccurate. This conclusion is substantiated by the magnetic survey-especially as regards those parts of the structure contours shown by dashed lines.
The intensity of the magnetic field of a body decreases rapidly as the distance from the body increases. In general, igneous and metamorphic rocks are more magnetic than sedimentary rocks. Among the sedimentary rocks, clastic deposits (such as sandstones and shales) generally are more magnetic than organic and chemical precipitates (such as limestones and dolomites). The magnetic irregularities at the earth's surface resulting from the varying magnetic intensity of the rocks are called magnetic anomalies.
Since the stratigraphic section below the Cherokee shale and above the igneous basement consists largely of limestones and dolomites having relatively low magnetic properties, any large magnetic anomalies observed in this area presumably are caused by magnetic substances in the near-surface clastic sediments of the Cherokee (such as sandstones which, in some places, contain considerable magnetite) or in the igneous rocks of the pre-Cambrian basement.The marked coincidence in location of the axis of the Pittsburg anticline with consistent magnetic lows and the occurrence of structural lows where high magnetic anomalies are found indicate that, in this area, the magnetic intensities generally are inversely proportional to the structural elevation of the rock formations. It is on this basis that the structural trends have been indicated on the magnetic map (Pl. 1). The magnetic field is shown on the magnetic map by contours connecting points of equal vertical magnetic intensity at intervals of 20 gammas.
As has been stated, the magnetic anomalies may arise either from the basement rocks or from the Cherokee. If the anomalies arise primarily from the basement rocks, the basement rocks must have a negative polarity to account for the inverse relationship between anomalies and structure. If the anomalies arise primarily from the Cherokee, there should be magnetic lows where the Cherokee is thinnest-namely, over structural highs. Studies of the magnetic susceptibility and remnant magnetism of several of the Cherokee sandstones indicate that some of these sandstones have a magnetic field of an order of magnitude sufficiently large to account for the observed anomalies.
If the anomalies are caused by the Cherokee, and if the basement rocks have positive polarity, it may be expected as a corollary to the inverse relationship noted above that, when a magnetometer survey extends from an area in which the Cherokee shale cover is absent into one where the shale cover is present, the relation between magnetic anomalies and structure should change. Three combinations of conditions are suggested. (1) Where the relatively magnetic Cherokee shale is absent, high magnetic readings may be interpreted to mean that the relatively magnetic basement rock is closer to the surface. In this case, structural and magnetic highs would coincide. (2) Where the Cherokee is present and of substantial thickness, the magnetic effect of the pre-Cambrian basement rocks probably would be masked by the magnetism of the Cherokee. Then magnetic lows would be expected to coincide with thinner areas of the Cherokee. Thus magnetic lows would coincide with structural highs and an inverse relation between magnetic intensity and structure would exist, as was indicated in the area covered by the current survey. (3) Conditions intermediate between the extremes described above would be found, for example above structural lows, where the Cherokee is only thick enough to mask the low magnetic values resulting from the crystalline basement rocks, but not thick enough to yield magnetic highs. Conversely, in areas where the Cherokee cover is thin, the magnetic highs resulting from a structurally high position of the basement rocks would be partly masked by the decrease in magnetism ascribable to the diminished thickness of the Cherokee. Therefore, if the anomalies are caused by the Cherokee and if the basement rocks have positive polarity, then, in areas in which the Cherokee cover is thin, magnetometer surveys might not give satisfactory results because the geophysicist might be unable to distinguish magnetic effects originating in the basement rocks from those originating within the Cherokee.
If the anomalies are caused by the basement rocks, these rocks must have a negative polarity to account for the inverse relationship between magnetic anomalies and structure. In this case, the inverse relationship would persist in areas where no Cherokee cover is present although the anomalies would be magnified by the presence of the Cherokee.
The major structure in this area is the Pittsburg anticline, which trends northwestward across the area through Pittsburg. Because of buried steel conduits, it was not possible to utilize magnetic readings in Pittsburg and Frontenac for geophysical survey purposes. Consequently the trend of the central part of the Pittsburg anticline on the magnetic map (indicated by dashed lines on Pl. 1) is largely conjectural. The northwestern and southeastern parts of the anticline correspond to marked magnetic lows. As shown on Plate 1, the trend and location of the southeastern part of the structure correspond closely with that shown on the structural map prepared from geologic studies (Pl. 2). The magnetic contours indicate that the southeastern part of the anticline probably plunges northwestward. A marked magnetic low, which covers the northwestern part of the anticline, is about parallel to and one-half mile south of the corresponding structural high indicated on Plate 2. The latter is shown tentatively as a closed structure that reaches a crest 3lh miles east of the west edge of the map. However, the magnetic survey indicates that the structure probably is not closed within the area studied, but rather that the crest rises steeply northwestward and becomes steeper and more pronounced at the point where it leaves the. northwestern corner of the map. Limitation in the time available for field work made it impossible to follow the anticline northwestward during the present survey.
East of the Pittsburg anticline, the magnetic anomalies indicate the probable existence of a syncline trending northwestward at its south end and then running northward, passing east of Pittsburg, Frontenac, and Franklin. The northern part of the syncline inferred from the magnetic survey coincides closely with the trend and location of a syncline shown on the structural map. The central part of the syncline indicated on the magnetic map lies onehalf mile west and on the downthrown side of a fault shown on Plate 2. This fault is now regarded, however, as a synclinal axis (G. E. Abernathy, personal communication}. The magnetic survey indicates that the northern part of the syncline plunges southward and the southern part plunges northward into a basin occupying parts of secs. 9, 10, 15, and 16, T. 30 S., R. 25 E.
A third structure, a north and northeast-striking southward plunging anticline, is inferred from the magnetic data in the northeastern corner of the area. No similar structure is shown on the structural map (Pl. 2).
A northwestward-trending syncline is inferred from the magnetic data to occur 4 to 5 miles southwest of the Pittsburg anticline, to which it is roughly parallel. In fact, this and other inferred structures in the southwestern part of the area covered show a striking parallelism with the Pittsburg anticline.
Southwest of and closely paralleling the inferred syncline last mentioned, the magnetic contours indicate the probable presence of a northwest-trending anticline which parallels and lies about one-half mile southwest of a corresponding but somewhat vague anticline on the structural map. A westward-trending anticlinal spur seems, from the magnetic map, to join this inferred anticline in the SE sec. 32, T. 30 S., R. 24 E. This anticlinal spur, indicated by marked magnetic lows on the magnetic map, coincides with a small structural high on the structural map. The magnetic survey indicates that this anticlinal spur may be a larger structure than is shown on Plate 2 and that it may have some closure.
Southwest of and closely paralleling the anticline to which this spur is attached, a northwestward-trending synclinal axis is inferred from magnetic readings. The synclinal axis runs north of Cherokee in conformity with, but about one-half mile northeast of, a similar fold shown on the structural map (Pl. 2).
The zinc and lead ore bodies of the Tri-State district are found in zones of intense brecciation adjacent to lines of structural deformation. The present magnetic survey, as well as earlier structural mapping, indicates the presence in this area of lines of both major and minor structural deformation. Therefore, the southeastern quarter of Crawford County may prove to be favorable structurally for the localization of ore. The fact that an area may be structurally favorable does not, however, insure the occurrence of ore. Exploratory drilling must determine the possibilities of ore occurrence in each such structurally favorable area. It seems especially desirable to drill some of the minor structural highs that are inferred from the magnetic map.
Careful consideration of geologic structure is as essential in exploring for oil as in searching for metallic ores. The structural map of southeastern Crawford County (Pl. 2) shows a closed structure at the northwestern end of the Pittsburg anticline. The magnetic survey, however, indicates that this structure probably is not closed within the area mapped. If the fold does have closure to the northwest, it warrants further consideration for petroleum exploration. At any rate, a magnetic survey of the northwestward extension of the Pittsburg anticline is highly desirable.
Jakosky, J. J., Dreyer, R. M., and Wilson, C. H., 1942, Geophysical investigations in the Tri-State zinc and lead mining district: Kansas Geol. Survey, Bull. 44, pp. 1-151, figs. 1-55, pis. 1-2. [available online]
Pierce, W. G., and Courtier, W. H., 1937, Geology and coal resources of the southeastern Kansas coal field: Kansas Geol. Survey, Bull. 24, pp. 1-122, figs. 1-13, pis. 1-12. [available online]
Kansas Geological Survey, Magnetic Survey of Southeastern Crawford County, Kansas
Placed on web Nov. 25, 2013; originally published Dec. 15, 1947.
Comments to webadmin@kgs.ku.edu
The URL for this page is http://www.kgs.ku.edu/Publications/Bulletins/70_5/index.html