Kansas Geological Survey, Bulletin 38, pt. 12, originally published in 1941
Department of Petroleum Engineering, University of Kansas
Originally published in 1941 as part of Kansas Geological Survey Bulletin 38, pt. 12. This is, in general, the original text as published. The information has not been updated. An Acrobat PDF version (11 MB) is also available.
The Otis gas and oil pool is located in central Kansas, in Rush and Barton counties, and embraces about twenty-three square miles. Production is obtained from the Lamotte sandstone of Late Cambrian age. The reservoir is estimated to have contained originally 207,900 million cubic feet of gas and 5,913,400 barrels of oil, both quantities expressed at standard surface conditions. As of May 1, 1941, a total of 93,100 million cubic feet of gas had been produced, of which 31,900 million cubic feet had been vented to the air in the production of oil, and the testing and blowing of wells; 1,411,386 barrels of oil had been marketed as of the same date.
Two elements of waste exist in the pool: (1) oil production with excessively high gas-oil ratios, and (2) premature decline in the reservoir pressures. Unless the oil is produced prior to the time when the static reservoir pressure becomes so low that operating pressure gradients sufficient to move the oil to the wells efficiently cannot be established, a large part of the otherwise recoverable oil will be left in the reservoir as underground waste.
In order to prevent such waste it is suggested (1) that the oil wells be allowed to produce at a rate sufficient to deplete the reservoir of its recoverable oil content before the withdrawal of too much gas for pipe-line sales, and (2) that the production of gas with the oil be prohibited unless such gas be recompressed and returned to the reservoir. The most feasible plan for such action lies in the unitization either of the entire pool or at least of that portion containing oil.
A tabulated summary of information pertaining to the Otis pool follows:
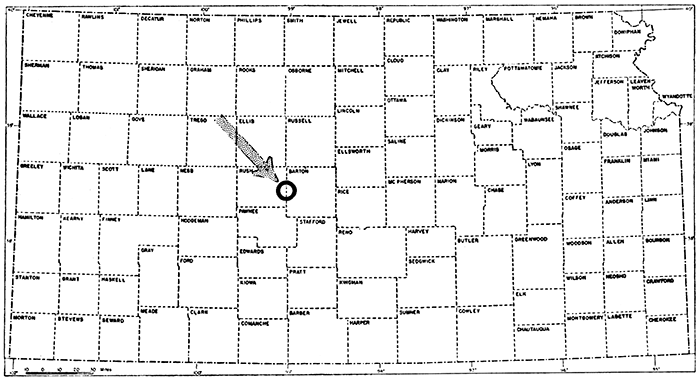
The Otis gas and oil pool is situated in west-central Kansas, partly in eastern Rush county and partly in western Barton county (fig. 1). The areal extent of the pool is approximately twenty-three square miles, and its wells are located in secs. 1, 2, 4, 5, 8-16, 21-27, 35, 36, T. 18 S., R. 16 W., and in secs. 15-21, 27-33, T. 18 S., R. 15 W.
Figure 1--Index map of Kansas, showing location of Otis pool.
Valuable assistance in the acquisition of pertinent information was rendered by T. A. Morgan, Director of the Conservation Division of the State Corporation Commission and by J. H. Page, chief gas engineer for the Conservation Division. Special appreciation is expressed to the U.S. Bureau of Mines and the Kansas State Corporation Commission for permission to use and quote from a confidential report entitled "Data Report on the Otis Field", by R. E. Heithecker, C. F. McCarroll, and W. F. Kreuger, to whom acknowledgment is also made. This report was based primarily upon field work done by these men in May and June, 1937, and it was published jointly in mimeographed form by the U.S. Bureau of Mines and the Kansas State Corporation Commission.
Generous cooperation was afforded to us by the Northern Natural Gas Company, by Morgan, Cobb, and Flynn, and by employees of these companies, particularly J. M. Fields, Jr., and John Hanley. Employees of other companies operating in the field gave freely of their time and of such information as they had acquired during their intimate contact with the unique problems of drilling, completion, reconditioning, and production.
The manuscript has been read critically by R. C. Moore, Director of the State Geological Survey, and by R. H. King and T. G. Payne, all of whom have made helpful and constructive suggestions.
The first study of the Otis pool by the authors was made in July, 1937, and a second more comprehensive examination was carried out in January, 1941, at the request of the Kansas State Corporation Commission. The pool has also been used as a field laboratory for four years, by students in Petroleum Engineering from the University of Kansas. The information obtained as of January, 1941, was used to forecast reservoir conditions as of May 1, 1941, but during the interim the engineers for the Commission completed the 1941 pressure survey of the pool. The calculations of the present paper have been thoroughly reviewed in the light of the last Commission survey (fig. 17), and some of the original computations have been slightly altered. No fundamental modifications have been necessary, however.
The Otis pool is predominantly a gas pool; however, it yields a small but significant quantity of oil on its southwest flank. Oil was discovered after the pool had produced gas for several years.
The Kansas proration regulations, which distribute the total state production among pools on the basis of the total potential of the wells in each pool, achieve their purpose admirably among most pools of the state, inasmuch as these pools have approximately similar characteristics. The Otis pool, however, differs radically from other Kansas pools. The energy which drives the oil to the well-bore is free gas rather than gas in solution in oil or the more customary water drive. Furthermore, the gas pressure has been steadily depleted by removal of gas for sale to the gas pipelines and by the production of gas along with the oil from oil wells. Considerable expense has been sustained by the oil-producing companies in efforts to lower the gas-oil ratios of their wells, but results have been only temporarily successful. Practically all the gas produced with oil has been reduced to approximately atmospheric pressure in the production process and has then been allowed to escape to the atmosphere.
The purpose of this report is to present all of the available information concerning the Otis pool, so that it may provide a working basis for the development of improved means of operation and regulation.
The discovery well in the Otis pool, the Milmac Oil Company No. 1 Eitel Estate well, located in the cen. NW sec. 11, T. 18 S., R. 16 W., was completed on March 26, 1930. The well had an initial open-flow capacity of 16,500,000 cubic feet of gas per day from a total depth of 3,507 feet. The initial rock pressure in this well was not ascertained, but other near-by gas wells completed soon afterward had maximum pressures of 1,064 pounds per square inch (absolute) at the well-head.
Oil was first produced from the Mid-Kansas Oil and Gas Company (Ohio Oil Company) No. 1 J. B. Mohr well, located in the NW sec. 10, T. 18 S., R. 16 W. This well was completed July 20, 1934, and had an initial production of 12,000,000 cubic feet of gas and 153 barrels of oil per day from a depth of 3,536 feet; the rock pressure at the well-head was reported to be 1,010 pounds per square inch. No other oil wells have been completed in the northern portion of the Otis pool. On February 16, 1936, oil was discovered in what is now the southern edge of the pool, by the completion of the Schermerhorn-Winton Company No. 1 Maneth-Brackley well, located in the NE sec. 22, T. 18 S., R. 16 W. This well had an initial production of 700 barrels of oil and 6,000,000 cubic feet of gas per day from a depth of 3,566 feet.
Table 1--Well Performance Data. Schermerhorn-Winton No.2 Maneth-Brackley, SE NE sec. 22, T. 18 S., R. 16 W. (U.S. Bureau of Mines)
| Date | Test no. |
Choke1 size inches |
Pressure, lbs. per sq. in. gauge | Delivery rate per 24 hrs. | Gas-oil ratio, cu. ft. per bbl. |
Gravity | ||||||
|---|---|---|---|---|---|---|---|---|---|---|---|---|
| Separator | Casing | Pressure drop in casing |
Tubing | Pressure drop in tubing |
Oil, gross bbls. at 60°F. |
Gas, M cu. ft. 60°F. Base 14.4 lbs. |
Oil A.P.I. at 60°F |
Gas Air = 1 |
||||
| May 25, 1987 | 1 | (1) | 187 | 711 | 118 | 149 | 690 | 36.6 | 1,225 | 33,470 | 34.5 | .6652 |
| Average for 8 hours after flowing 11 hours | ||||||||||||
| June 2, 1937 | 7 | 7/64 | 104 | 727 | 112 | 665 | 174 | 31.4 | 1,315 | 41,900 | 34.6 | .6792 |
| Average for 10 hours after flowing 11 hours | ||||||||||||
| June 3, 1937 | 8 | 15/64 | 106 | 671 | 168 | 593 | 246 | 50.7 | 1,680 | 33,100 | 34.9 | .6772 |
| Average for 11 hours after flowing 11 hours | ||||||||||||
| June 4, 1937 | 9 | 25/64 | 111 | 562 | 277 | 446 | 898 | 94.7 | 2.130 | 22,490 | 35.1 | .6882 |
| Average for 11 hours after flowing 13 hours | ||||||||||||
| June 5, 1937 | 10 | 35/64 | 106 | 470 | 369 | 317 | 522 | 131 | 2,400 | 18,320 | 35.3 | .6672 |
| Average for 10 hours after flowing 12 hours | ||||||||||||
| June 6, 1987 | 11 | 2 1/23 | 57 | 342 | 497 | 145 | 694 | 182 | 2,760 | 15,160 | 34.4 | .6702 |
| Average for 12 hours after flowing 12 hours | ||||||||||||
| May 26, 1937 | 2 | (4) | 134 | 587 | 252 | 658 | 181 | 37.4 | 1,285 | 34,360 | 34.7 | .6814 |
| Average for 8 hours after flowing 14 hours | ||||||||||||
| May 27, 1937 | 3 | - | 150 | 512 | 327 | 628 | 211 | 84.3 | 1,695 | 20,100 | 36.2 | .6744 |
| Average for 8 hours after flowing 16 hours | ||||||||||||
| May 29, 1937 | 4 | - | 135 | 346 | 493 | 360 | 479 | 151.7 | 2,415 | 15,920 | 35.2 | .68014 |
| Average for 8 hours after flowing 16 hours | ||||||||||||
| May 30, 1937 | 5 | - | 132 | 194 | 645 | 266 | 573 | 223 | 2,710 | 12,150 | 35.2 | .6784 |
| Average for 9 hours after flowing 14 hours | ||||||||||||
| May 31, 1937 | 6 | - | 58 | 91 | 748 | 137 | 702 | 230 | 3,090 | 13,440 | 34.4 | .69054 |
| Average for 8 hours after flowing 16 hours | ||||||||||||
| June 8, 1937 | 8895 | 6985 | Shut-in pressures (after flow tests) | |||||||||
| 1 First tubing flow through 9/32-inch bottom-hole choke set at 3,450 feet. 2 Flowing through 2 1/2-inch tubing. 3 Full open choke. 4 Casing flow; controlled by regulating gate valve on flow line. 5 Highest pressure recorded in tubing was 698 pounds, but in calculating pressure drop in tubing during tests, a value of 839 pounds was used. |
||||||||||||
Table 2--Well Performance Data. Morgan, Flynn-Cobb No. B-1 Koriel, NW SW sec. 23, T. 18 S., R. 16 W. (U.S. Bureau of Mines). Well producing through casing.
| Date | Test no. |
Choke1 size inches |
Pressure, lbs. per sq. in. gauge | Delivery rate per 24 hrs. | Gas-oil ratio, cu. ft. per bbl. |
Gravity | ||||
|---|---|---|---|---|---|---|---|---|---|---|
| Separator | Casing | Pressure drop in casing |
Oil, gross bbls. at 60°F. |
Gas, M cu. ft. 60°F. Base 14.4 lbs. |
Oil A.P.I. at 60°F |
Gas Air = 1 |
||||
| 0 | 0 | 8413 | 0 | 0 | 0 | - | - | - | ||
| May 25, 1937 | 1 | 1/2 | 108 | 647 | 194 | 189.8 | 3,031 | 15,970 | 37.2 | 0.672 |
| Average for 8 hours after flowing 14 hours | ||||||||||
| May 25, 1937 | 2 | 3/4 | 189 | 478 | 363 | 641.3 | 6,385 | 9,960 | 35.9 | 0.668 |
| Average for 4 hours after flowing 5 hours | ||||||||||
| May 26, 1937 | 3 | 1-5/8 | 176 | 248 | 593 | 1,165.7 | 8,861 | 7,600 | 35.0 | 0.667 |
| Average for 7 hours after flowing 10 hours | ||||||||||
| May 26, 1937 | 4 | 3 | 89 | 146 | 695 | 1,303.0 | 10,116 | 7,750 | 34.9 | 0.691 |
| Average for 5 hours after flowing 2 hours | ||||||||||
| May 27, 1937 | 52 | 3./4 | 124 | 491 | 350 | 590.4 | 6,524 | 11,050 | 35.5 | 0.671 |
| Average for 5 hours after flowing 10 hours | ||||||||||
| May 28, 1937 | 62 | 1/2 | 89 | 661 | 180 | 167.8 | 2,844 | 16,950 | 35.3 | 0.676 |
| Average for 12 hours after flowing 12 hours | ||||||||||
| 1 Approximate opening. 2 Pinching back after wide open flow. 3 Casing pressure recorded June 4, 1937. Pressure before tests 836. |
||||||||||
Table 3--Well Performance Data. Morgan, Flynn-Cobb No. B-2 Koriel, SE NE SW sec. 23, T. 18 S., R.16 W. (U.S. Bureau of Mines). Well producing through casing.
| Date | Test no. |
Choke1 size inches |
Pressure, lbs. per sq. in. gauge | Delivery rate per 24 hrs. | Gas-oil ratio, cu. ft. per bbl. |
Gravity | ||||
|---|---|---|---|---|---|---|---|---|---|---|
| Separator | Casing | Pressure drop in casing |
Oil, gross bbls. at 60°F. |
Gas, M cu. ft. 60°F. Base 14.4 lbs. |
Oil A.P.I. at 60°F |
Gas Air = 1 |
||||
| May 28, 1937 | 1 | 45/64 | 67 | 742 | 96 | 44.2 | 7,590 | 171,720 | 37.8 | .673 |
| Average for 12 hours after flowing 4 hours | ||||||||||
| May 29, 1937 | 2 | 66/64 | 96 | 708 | 130 | 58.3 | 10,290 | 176,500 | 37.6 | .6695 |
| Average for 11 hours after flowing 12 hours | ||||||||||
| May 30, 1937 | 3 | 85/64 | 90 | 539 | 299 | 136 | 19,380 | 142,500 | 35.6 | .685 |
| Average for 14 hours after flowing 9 hours | ||||||||||
| May 31, 1937 | 4 | 118/64 | 96 | 381 | 459 | 205.5 | 26,080 | 126,910 | 35.2 | .685 |
| Average for 12 hours after flowing 12 hours | ||||||||||
| June 2, 1937 | 8382 | Shut-in pressures (after flow tests) | ||||||||
| 1 Approximate opening. 2 Shut-in pressure, May 27, 1937, 827 lbs. (before flow tests). |
||||||||||
Table 4--Well Performance Data. Carter Oil Company No. A-1 Schroeder, NW SW SE sec. 23, T. 18 S., R. 16 W. (U.S. Bureau of Mines). Well producing through casing.
| Date | Test no. |
Choke1 size inches |
Pressure, lbs. per sq. in. gauge | Delivery rate per 24 hrs. | Gas-oil ratio, cu. ft. per bbl. |
Gravity | ||||
|---|---|---|---|---|---|---|---|---|---|---|
| Separator | Casing | Pressure drop in casing |
Oil, gross bbls. at 60°F. |
Gas, M cu. ft. 60°F. Base 14.4 lbs. |
Oil A.P.I. at 60°F |
Gas Air = 1 |
||||
| May 25, 1937 | - | - | - | 8442 | 0 | |||||
| May 27, 1937 | 1 | - | 50 | 731 | 113 | 64.5 | 10,480 | 162,480 | 35.4 | .6733 |
| Average for 10 hours after flowing 11 hours | ||||||||||
| May 28, 1937 | - | 2 | 45 | 618 | 226 | 137.2 | 17,200 | 125,360 | 33.8 | .672 |
| Average for 10 hours after flowing 13 hours | ||||||||||
| May 29, 1937 | 3 | - | 52 | 451 | 393 | 231.0 | 24,160 | 104,590 | 33.4 | .677 |
| Average for 10 hours after flowing 15 hours | ||||||||||
| May 30, 1937 | 4 | - | 64 | 126 | 718 | 361.0 | 30,540 | 84,600 | 32.6 | .675 |
| Average for 11 hours after flowing 12 hours | ||||||||||
| May 30, 1937 | 5 | - | 5$ | 794 | 347.0 | 32,9003 | 94,800 | 31.2 | .684 | |
| Average for 8 hours after flowing 2 hours | ||||||||||
| 1 Flow controlled by pinching casing gate, well not equipped with choke. 2 Shut-in pressure, June 1, 1937, 827 lbs, (after flow tests). 3 Gas measurement by closed pitot-tube method. |
||||||||||
Table 5--Well Performance Data. Morgan, Flynn-Cobb No. B-1 Schroeder, SW NW SE, sec. 23, T. 18 S., R. 16W. (U.S. Bureau of Mines). Well producing through casing. Pressures and deliveries not stabilized during 24 hours.
| Date | Test no. |
Choke1 size inches |
Pressure, lbs. per sq. in. gauge | Delivery rate per 24 hrs. | Gas-oil ratio, cu. ft. per bbl. |
Gravity | ||||
|---|---|---|---|---|---|---|---|---|---|---|
| Separator | Casing | Pressure drop in casing |
Oil, gross bbls. at 60°F. |
Gas, M cu. ft. 60°F. Base 14.4 lbs. |
Oil A.P.I. at 60°F |
Gas Air = 1 |
||||
| June 2, 1937 | 1 | 20/64 | 37 | 726 | 118 | 99 | 3,530 | 35,660 | 34.8 | .665 |
| Average for 9 hours after flowing 15 hours | ||||||||||
| June 3,1937 | 2 | 45/64 | 42 | 712 | 132 | 147 | 6,700 | 45,580 | 35.2 | .677 |
| Average for 9 hours after flowing 15 hours | ||||||||||
| June 4, 1937 | 3 | 78/64 | 71 | 570 | 274 | 411 | 14,060 | 34,210 | 34.8 | .671 |
| Average for 7 hours after flowing 18 hours | ||||||||||
| June 5, 1937 | 4 | 100/64 | 68 | 448 | 396 | 605 | 19,730 | 32,610 | 34.6 | .669 |
| Average for 10 hours after flowing 13 hours | ||||||||||
| June 6, 1937 | 8442 | Shut-in pressures (after flow tests) | ||||||||
| 1 Approximate opening. 2 Shut-in pressure, June 1, 1937, 827 lbs. (before flow tests). |
||||||||||
On May 1, 1941, the pool included a total area of 14,760 acres, classified as proven gas territory; of this 3.09 per cent is productive of both oil and gas and the remainder of gas alone. On May 1, 1941, the field had 53 gas-producing wells and 17 oil wells, from which 58,853,599 cubic feet of gas (measured at 16.4 pounds per square inch and 60° F.) and 1,411,386 barrels of oil had been marketed.
All the wells of the Otis pool produce from the Lamotte sand or from the "granite wash" where these rocks lie directly upon the top of the granite. The pool seems to represent a structural trap, bounded on the southwest by a topographically high portion of the pre-Cambrian granite surface. Definite proof of this is found in the line of dry holes that define the southwest edge of the pool. These dry holes encountered the granite at considerably less depth than adjacent producing wells. The producing zone rises northeastward to a point in the northeast part of the pool, where the zone is 70 to 80 feet higher than in the southwest portion.
Evidence pertaining to sand thickness is at best somewhat meager. Information from three sources is available-logs from the Kansas Well Log Bureau, records given in the U.S. Bureau of Mines (1938) Report to the Corporation Commission, and the electrical logs of four oil wells. These thicknesses are shown in table 6. In calculating average sand thickness the electrical logs were not utilized due to the fact that the electrical log may not show exact thickness of consolidated rocks; an average was taken of the thicknesses reported by the U.S. Bureau of Mines and the Kansas Well Log Bureau. Thus calculated, the average thickness of the oil pay zone is 13.7 feet and that of the gas pay is 30 feet. Very little information concerning the Lamotte sand is available from well cores. Only three cores in the sand have been taken and analyzed, and of the three wells from which these were obtained, one is unproductive and outside the oil-producing area, another produces only a very small amount of oil, and the third is a well of average production in the oil zone. The core from the non-productive well was not considered. The average porosity of the oil zone was calculated on the basis of the two remaining cores and determined to be 12.5 per cent (table 7).
Table 6--Thickness of the oil-bearing portion of the Lamotte sandstone in the Otis pool.
| Well | Location, sec., T. S., R. W. | Depths of top and bottom of sand and thickness, in feet. | |||
|---|---|---|---|---|---|
| Kansas well log bureau |
U.S. Bur. Mines (1937), drillers' logs |
Schlumberger logs (Morgan, Flynn, Cobb) |
Thickness used by authors |
||
| Crowell 2 | NE 23-18-16 | 3541-3555 (14) | 14 | ||
| Koriel A-1 | C NW 23-18-16 | 3525-3540 (15) | 15 | ||
| Koriel A-2 | SW NW 23-18-16 | ||||
| Koriel A-3 | C S2 S2 NW 23-18-16 | ||||
| Koriel A-4 | SE SE NW 23-18-16 | 3527-3538 (11) | 3527-3538 (11) | 11 | |
| J. Schroeder A-1 | NW SW SE 23-18-16 | 3522-3539 (17) | 3522-3539 (16) (less 1 ft. shale) |
3541-3543 (2) | 16 |
| O. Schroeder B-1 | SW NW SE 23-18-16 | 3523-3538 (15) | 3523-3538 (15) | 3534-3544 (10) | 15 |
| O. Schroeder B-2 | NW NW SE 23-18-16 | 3510-3514 (4) | 4 | ||
| Woodward 1 | SE SE SE 23-18-16 | 3536-3550 (14) | 3529-3550 (21) | 14 | |
| Maneth-Brackley 1 | C NE 22-18-16 | 3548-3566 | 3548-3566 (18) | 18 | |
| Maneth-Brackley 2 | SE NE 22-18-16 | 3542-3550 (8) | 3542-3550 (8) | 8 | |
| Koriel B-1 | NW SW 23-18-16 | 3535-3539 (4) | 3536-3539 (3) | 4 | |
| Koriel B-2 | SE NE SW, 23-18-16 | 3533-3549 + | 3533-3549 (16) | 16 | |
| Koriel B-3 | C N2 SW 23-18-16 | 3534-3550 (16) | 3533-3550 (17) | 3535-3546 (11) | 16 |
| Koriel B-4 | NE NE SW 23-18-16 | (3498-3509) (17) (3544-3550) |
17 | ||
| Moore 1 | NW NW NW 25-18-16 | 3534-3556 (22) | 22 | ||
| Brack 2 | Location? | 11 | |||
| Average of column | 14.0 | 8.3 | 13.4 | ||
| Average thickness = (14.0 + 13.4) / 2 = 13.7 | |||||
Table 7--Porosity of the oil-bearing sand in the Otis pool.
| Well and Location | Cored selection, depth in feet |
Oil pay depth an thickness, feet |
Average porosity of pay, in feet |
Product, porosity times thickness |
|---|---|---|---|---|
| J. Schroeder A-1 NW SW SE, 23-18-16 (casing set at 3521) |
3519-3530 | 3522-3530 (8) | 18.8 | 150.4 |
| 3531-3539 | 3531-3539 (8) | 10.1 | 80.8 | |
| Woodward 1 SW SW SE, 23-18-16 |
3487-3509 | |||
| 3523-3550 | 3536-3550 (14) | 10.1 | 141.4 | |
| Total | (30) | 372.6 | ||
| Computation of weighted average porosity-Sum of porosity times: thickness (372.6) divided by total thickness (30) equals weighted average porosity (12.44). Figure for porosity used in computations is 12.5. | ||||
Requisites for engineering study.-The basic information needed for a precise engineering study of an oil field is not available in the case of the Otis pool. The operation of an oil pool on a sound engineering basis is dependent on such comprehensive materials and investigations as the following:
The acquisition of materials and information of the above types makes .it possible to calculate the total quantities of oil or gas, or both, in a reservoir even before the precise boundaries of the pool have been ascertained, and thus facilitates determination of the efficiency of the production practices employed.
Fundamental data of the character indicated above are most readily procured when a pool is operated as a unit, a plan which, as already demonstrated, is also more likely to lead to greater ultimate recovery of oil and gas, lower average development cost, and lower operating expense ( as well as increased revenue to the royalty owners) than can be achieved under such practices of development and operation as accompany competitive production.
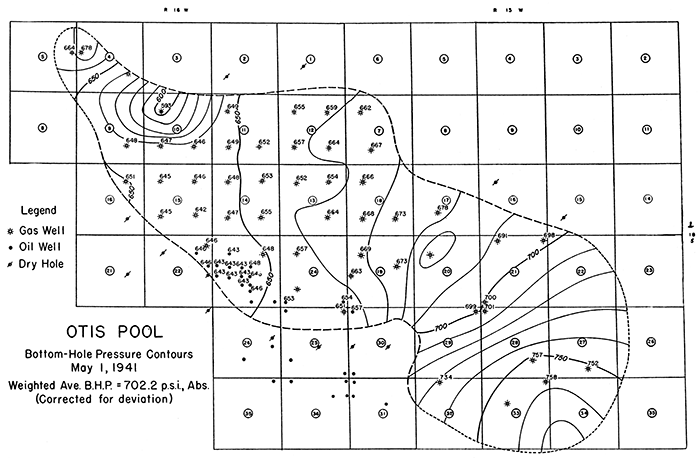
Casing head pressures have been measured at intervals throughout the life of the Otis pool, for the purpose of allocating the gas production. These pressures have been converted to bottom-hole pressure figures (referred to a datum plane of 1,600 feet below sea level) by means of the tables published by the U.S. Bureau of Mines (Rawlins and Schellhart, 1935). The resulting bottom-hole pressure data are plotted on figures 9 to 17 inclusive, and contoured at intervals of 10 pounds per square inch. From these maps the weighted average bottomhole pressure was obtained.
The method outlined by the U.S. Bureau of Mines is based on computation of the weight of the column of gas in the well, which, when added to the casing-head. pressure, gives the bottom-hole pressure. The tables published by the Bureau are based on the premise that ideal gas laws are applicable under the actual pressure conditions. The ideal gas laws are known to be inapplicable at high pressures, however, and therefore the average bottomhole pressure as determined from the contour maps has been corrected for deviation from the ideal gas laws (Brown, 1941).
The bottom-hole pressures of each well as of May 1, 1941, calculated from casing-head pressures and corrected for deviation is shown on figure 17. The weighted average pressure of the field was determined directly from this map.
Table 8--Weighted average casinghead and bottom-hole pressures in the Otis pool, based on field tests reported by the Kansas State Corporation Commission (text figs. 8 to 17). (Pressure expressed as pounds per square inch absolute)
| Date | Weighted average casing head pressure |
Weighted average bottom-hole pressure, uncorrected for deviation |
Weighted average bottom-hole pressure, corrected for deviation |
|---|---|---|---|
| 1930 | 1064.0 | 1157.0 | 1178.0 |
| Sept. 1, 1936 | 955.4 | 1039.0 | 1057.0 |
| June 1, 1937 | 924.0 | 1000.5 | 1015.2 |
| Jan. 1, 1938 | 865.6 | 941.5 | 955.2 |
| June 1, 1938 | 855.6 | 930.6 | 943.3 |
| Oct. 1, 1938 | 827.8 | 900.4 | 912.7 |
| May 1, 1939 | 781.7 | 850.2 | 861.2 |
| Oct. 1, 1939 | 759.9 | 826.5 | 837.1 |
| May 1, 1940 | 682.1 | 741.9 | 749.7 |
| May 1, 1941 | 702.2 |
The pipe-line sales of gas are published monthly by the State Corporation Commission. These figures are based on the volume metered at pipe-line pressures, approximately 350 pounds per square inch, and calculated at a base pressure of 16.4 pounds per square inch and a temperature of 60° F. No correction is made for deviation from the ideal gas laws in the published figures.
The cumulative totals of pipe-line gas sales at dates corresponding to those of the pressure surveys of the field are tabulated in table 9 (column 1), and are presented graphically in figure 6. The appropriate factor required to correct for deviation from the ideal gas laws has been applied to obtain the true volume of the metered gas, which is shown in table 9 (column 2) .
For the purpose of calculating the over-all gas-oil rations, the reserves and other desirable quantities, it was necessary to estimate the amount of gas vented to the air prior to September 1, 1936, but of which no accurate record had been kept. After consultation with production men in the field, and comparison of various figures submitted by them, it seemed reasonable to assume that 3,000 million cubic feet had been vented in efforts to obtain commercial oil from wells that originally produced only small quantities. Estimates of the amount of gas vented during drillingin and well-testing operations (590 million cubic feet) were also available (table 9, column 3) and were utilized in the calculations.
Table 9--Gas production of the Otis pool, as reported periodically by the Kansas State Corporation Commission. (The dates used correspond to those of the various pressure surveys made by the Conservation Division of the Commission. Quantities expressed as million cubic feet).
| Date | (1) | (2) | (3) | (4) | (5) | (6) | (7) |
|---|---|---|---|---|---|---|---|
| Sept. 1, 1936 | 19,625 | 20,406 | 590 | 20,996 | 3,000 | 23,996 | A-L |
| June 1, 1937 | 25,397 | 26,408 | 822 | A-C | |||
| Jan. 1,1938 | 29,563 | 30,740 | 1,125 | A-D | |||
| June 1, 1938 | 33,295 | 34,620 | 1,739 | A-E | |||
| Oct. 1, 1938 | 34,094 | 35,451 | 2,037 | A-F | |||
| May 1, 1939 | 39,791 | 41,375 | 2,188 | A-G | |||
| Oct. 1,1939 | 41,568 | 43,222 | 2,314 | A-H | |||
| May 1, 1940 | 50,342 | 52,356 | 2,440 | A-J | |||
| May 1, 1941 | 58,854 | 61,196 | 2,800 | A-W | |||
| (1) Cumulative pipe-line sales (measured at 350 p.s.i., absolute, and 60° F., corrected to 16.4 p.s.i., absolute, and 60° F., with deviation factor ignored). (2) Cumulative pipe-line sales, cor-rected for deviation factor. (3) Estimated operating losses, cumulative. (4) Pipe-line sales plus operating losses, cumulative. (5) Estimated vented gas (waste). (6) Total gas removed from reservoir. (7) Data in column (2) referred to points on fig. 2. The quantities indicated can be calculated by measuring along. the base line of the graph the horizontal distance between the points noted; each large-scale unit represents 10 billion cubic feet of gas. |
|||||||
All pipe-line runs of oil are reported monthly by the State Corporation Commission. These have been tabulated (table 10) semi-yearly, and for certain other specific dates utilized in the calculations, and are shown graphically (fig. 7). The figures are based on volumes in the stock tank, corrected to 60° F. Where reservoir displacement was computed, these volumes have also been corrected for expansion to the bottom-hole temperature. The solution of gas in the oil would also appreciably increase the volumes, but inasmuch as the effects of this solution factor on the oil in the Otis pool are unknown, the correction has been omitted from the calculations.
The total oil production from the Otis pool, as of May 1, 1941, is 1,411,386 barrels. The maximum rate of production was reached during the second half of 1938, although the rate for the ensuing six months was nearly the same. The average daily rate of production during the second half of 1938 was 88.6 barrels per well, for an average of 17 wells. At the present time the wells are producing at the statutory limiting rate of 15 barrels per well per day.
Table 10--Oil production of the Otis pool, compiled from reports issued periodically by the Kansas State Corporation Commission. (Quantities expressed as barrels of stock tank oil).
| Date | Average monthly production for semi-annual period |
Semi-annual production |
Cumulative production |
|---|---|---|---|
| Dec. 31, 1934 | 523 | 523 | 523 |
| June 30, 1935 | 289 | 1,733 | 2,256 |
| Dec. 31, 1935 | 127 | 760 | 3,016 |
| June 30, 1936 | 1,618 | 9,707 | 12,723 |
| Sept. 1, 1936 | 18,894 | ||
| Dec. 31, 1936 | 4,857 | 29,141 | 41,864 |
| June 30, 1937 | 12,560 | 75,361 | 117,225 |
| Dec. 31, 1937 | 19,522 | 117,134 | 234,359 |
| June 30, 1938 | 16,687 | 100,119 | 334,478 |
| Dec. 31, 1938 | 45,697 | 274,184 | 608,662 |
| May 1, 1939 | 801,325 | ||
| June 30, 1939 | 45,297 | 271,780 | 880,442 |
| Dec. 31, 1939 | 34,882 | 209,294 | 1,089,736 |
| May 1, 1940 | 1,198,216 | ||
| June 30, 1940 | 25,271 | 151,623 | 1,241,359 |
| Dec. 31, 1940 | 23,118 | 138,706 | 1,380,065 |
| May 1, 1941 | 1,411,386 |
Table 11--Monthly oil production of the Otis pool, and volume of gas produced with the oil in 1940, as reported by the Kansas State Corporation Commission. [The figures for gas produced with oil are approximately 45 per cent of the amount computed on the basis of the decline in reservoir pressure. The differences may be due to errors in the measurement of gas, gas retained in solution in the oil, or imperfect separation of gas and oil, or other unknown causes.]
| 1940 | Monthly gas production, M cu. ft. |
Monthly oil production, barrels |
Calculated gas-oil ratio |
|---|---|---|---|
| Jan. | 270,488 | 33,309 | 8,120 |
| Feb. | 202,651 | 27,681 | 7,320 |
| Mar. | 172,586 | 27,039 | 6,382 |
| Apr. | 141,670 | 20,451 | 6,927 |
| May | 164,446 | 21,225 | 7,747 |
| June | 201,735 | 21,918 | 9,204 |
| July | 240,336 | 26,396 | 9,105 |
| Aug. | 254,658 | 25,604 | 10,161 |
| Sept. | 244,322 | 25,627 | 9,534 |
| Oct. | 248,086 | 28,701 | 8,644 |
| Nov. | 187,072 | 23,672 | 7,903 |
| Dec. | 54,349 | 8,706 | 6,243 |
| Totals | 2,382,399 | 290,329 | Average 8,206 |
In the case of gas pools, estimates of recovery must take cognizance of the deviation of gases from ideal behavior, and must also recognize some average well-head pressure which marks the end of economically profitable operating conditions. In order that the effects of different final well-head pressures on the ultimate recovery may be shown, two such abandonment pressures have been assumed for use in the calculations,one of 350 pounds per square inch (gauge) and the other of 50 pounds per square inch (gauge). The volumes of pipe-line gas, gas not recovered from the reservoir and other quantities computed on the basis of these pressures, are compared in detail in tables 13 and 14, with appropriate references to points on a graph (fig. 2).
Table 12--Pipe-line gas sales, operating losses, gas vented and unaccounted for, current gas reserves (all as of May 1, 1941), and original gas content of Otis pool. (Bottom-hole pressure as of May 1, 1941, 702 p.s.i., at 109° F.)
| Million cubic feet of gas | Read on fig. 2 (see table 9, note 7) |
||
|---|---|---|---|
| At 16.4 p.s.i., and 60° F (from fig 2) |
At 1178 p.s.i., and 109° F (Column 1 / 78.07) |
||
| Pipe-line runs | 61,200 | 784 | U-W |
| Operating losses of gas wells, plus gas vented prior to oil production |
5,800 | 74 | X-Y |
| Gas vented with oil and unaccounted for during period, Sept. 1, 1936 to May 1, 1941 |
26,100 | 334 | W-x |
| Gas present in reservoir, as of May 1, 1941 |
114,800 | 1,471 | Y-Z |
| Total | 207,900 | 2,663 | R-M |
Table 13--Estimates of recoverable gas in the Otis pool for various operating conditions, based on an assumed abandonment pressure of 350 p.s.i. (gauge at casing-head) or 397 p.s.i. (absolute bottom-hole pressure).
| Million cubic feet of gas | Read on fig. 2 (see table 9, note 7) |
||
|---|---|---|---|
| At 16.4 p.s.i., and 60° F (from fig 2) |
At 1178 p.s.i., and 109° F (Column 1 / 78.07) |
||
| Original recoverable gas volume |
144,800 | 1,855 | T-M" |
| Original unrecoverable gas volume |
63,100 | 808 | M"-Z |
| Total operating losses of gas wells |
9,500 | 122 | N"-M" |
| Ultimate pipe-line runs at past rate of venting |
86,000 | 1,102 | T-P" |
| Ultimate pipe-line runs if no more gas is vented with oil production |
110,700 | 1,418 | T-O" |
| Remaining recoverable gas at past rate of venting |
24,800 | 318 | W-P" |
| Remaining recoverable gas if no more gas is vented with oil production |
49,500 | 634 | W-O" |
| Total volume of gas that would be vented if past rate of venting were to be maintained |
50,800 | 651 | P"-N" |
| Gas which will have been vented with oil production if venting ceases May 1, 1941 |
26,100 | 334 | O"-N" |
Table 14--Estimates of recoverable gas in the Otis pool for various operating conditions, based on an assumed abandonment pressure of 50 p.s.i. (gauge at casing-head) or 70 p.s.i. (absolute bottom-hole pressure).
| Million cubic feet of gas | Read on fig. 2 (see table 9, note 7) |
||
|---|---|---|---|
| At 16.4 p.s.i., and 60° F (from fig 2) |
At 1178 p.s.i., and 109° F (Column 1 / 78.07) |
||
| Original recoverable gas volume |
197,500 | 2,530 | S-M' |
| Original unrecoverable gas volume |
10,400 | 133 | M'-Z |
| Total operating losses of gas wells |
10,400 | 133 | N'-M' |
| Ultimate pipe-line runs at past rate of venting |
114,300 | 1,464 | S-P' |
| Ultimate pipe-line runs if no more gas is vented with oil production |
161,000 | 2,062 | S-O' |
| Remaining recoverable gas at past rate of venting |
53,100 | 680 | W-P' |
| Remaining recoverable gas if no more gas is vented with oil production |
99,800 | 1,278 | W-O' |
| Total volume of gas that would be vented if past rate of venting were to be maintained |
72,800 | 932 | P'-N' |
| Gas which will have been vented with oil production if venting ceases May 1, 1941 |
26,100 | 334 | O'-N' |
| Pipe-line runs as of Sept. 1, 1936 |
20,406 | 261 | U-V |
| Pipe-line runs as of May 1, 1941 |
61,196 | 784 | U-W |
| Gas vented and unaccounted for between May 1, 1939, and May 1, 1940 |
7,700 | 98 | |
The estimates of future recoverable gas range from 24,800 million cubic feet (table 13, column 1, line 6) to 99,800 million cubic feet (table 14, column 1, line 7), dependent on operating conditions and on the abandonment pressures used as the economic limit. The first of the above estimates is based on an abandonment pressure of 350 pounds per square inch (gauge) at the well-head and the assumption that venting of gas with oil will continue at the same rate as in the past. The second estimate is based on an abandonment pressure of 50 pounds per square inch (gauge) at the wellhead and the assumption that no gas will be vented after May 1, 1941.
If no water drive exists, the total original quantity of gas in a reservoir may be estimated by plotting graphically the average static bottom-hole pressures of the reservoir, divided by the appropriate deviation factors, against cumulative gas removed at the date the pressure survey was made. This results in a straight line when the points are plotted on cartesian coordinates, the equation for which is as follows.
(P1 / Z1) - (P2 / Z2) = m (Q2 - Qt)
where P = bottom-hole pressure, lbs. per sq. inch
Z = deviation factor, applicable to the specific pressure
Q = quantity of gas reserve, billions of cu. ft. (at 16.4 lbs. per sq. inch and 60° F.)
m = the slope of the line.
or, as designated in figure 2:
(Pa / Za) - (P1 / Z1) = m (Qq + 3,590,000,000 - Qr)
The subscripts refer to the points on figure 2, and 3,590,000,000 represents gas lost, in cubic feet. The total original reserve could then be expressed by the following equation:
Qt = {(Pa / Za) / [(Pa / Za) = (Pa / Za)]} (Qq + 3,590,000,000)
This relation may also be stated as follows: The original or total gas content of the reservoir equals (1) total quantity of gas produced since discovery, multiplied by (2) the original bottomhole pressure (corrected for deviation), divided by (3) the decline in bottom-hole pressure (similarly corrected), during the production of the quantity of gas above.
The line A-L-M of figure 2 is based on the above equations. The quantity indicated along the horizontal scale of the graph, under A-M (or R-M) represents the original content of the pool. A-M' (or S-M') shows the quantity that could have been recovered from the reservoir had it been operated solely as a gas pool to an abandonment pressure of 50 pounds per square inch (gauge) at the well-head. Experience with many other fields has demonstrated that such an abandonment pressure may be reasonably anticipated, although it will be necessary to install additional compressor units in the field in order to boost the pressure at the wells to suitable line pressure. Such installations must precede the decline of working well-head pressures to the pipe-line pressure, which is approximately 350 pounds per square inch.
Figure 2--Graphs used in estimation of gas reserves, Otis pool, May 1, 1941.
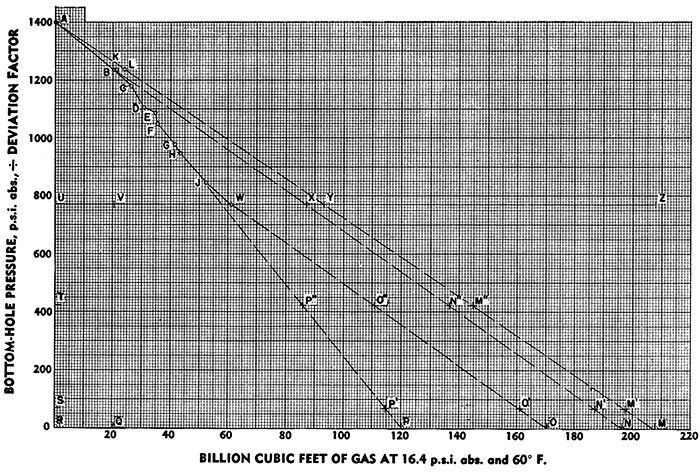
Several other significant features are portrayed by figure 2 (also table 12) , as follows.
In general, the divergence of the two lines B-N' and B-P' represents the continual increase in the proportion of gas lost by venting with oil, as compared with the quantity that could have been produced in the past or might be produced in the future if the operations were based on engineering principles.
In many instances it is essential to know the volume of gas (measured at surface or standard conditions) required to form a cubic foot of gas at the pressure and temperature of the reservoir. This computation can be made readily if the reservoir pressure and temperature are known, together with the composition or the gravity of the gas, so that the deviation from ideal gas laws can be given proper consideration (Brown, 1940).
In the case of the Otis pool, the initial bottom-hole pressure was 1,178 p.s.i., absolute, and the temperature according to a Schlumberger electrical log was 109° F., and the gas had a specific gravity of 0.669, compared with air as unity. The deviation factor under these conditions is 0.841. By following the method of computation outlined by Brown, it is found that 78.07 cubic feet of gas measured at 60° F., and 16.4 p.s.i., would have a volume of one cubic foot under the initial conditions in the reservoir.
Inasmuch as all the oil wells have been under restricted rates of output for the greater part of their lives, it is not possible to estimate their future production by the use of any of the various types of decline curves. Neither can the dependable methods based on the "material balance" procedures be used, owing to the lack of basic engineering information essential for such computations. Hence it has been necessary to rely on the method based primarily on the porosity and thickness of the sand, together with the areal extent of the oil-bearing portion of the reservoir. A summary of the results obtained by this method is shown in table 15, which also makes use of other data presented in tables 6 and 7.
Table 15--Original oil content of the Otis reservoir, oil produced, and oil recoverable.
| Cu. ft.,1 at 109° F. |
Barrels at 109° F. |
Cu. ft.1 at 60° F. |
Barrels at 60° F. |
|
|---|---|---|---|---|
| Space originally occupied by oil in the reservoir (43,560 x 455 x 13.7 x .125)2 |
33,941,408 | 6,045,205 | 33,201,485 | 5,913,419 |
| Estimated total amount recoverable (50 per cent) |
16,970,704 | 3,022,602 | 16,600,742 | 2,956,709 |
| Oil production as of May 1, 1941 | 8,100,963 | 1,442,839 | 7,924,362 | 1,411,386 |
| Estimated remaining amount recoverable as of May 1, 1941 |
8,869,741 | 1,579,763 | 8,676,380 | 1,545,323 |
| Oil produced during period Sept. 1, 1936, to May 1, 1941 |
7,992,315 | 1,423,488 | 7,818,083 | 1,392,456 |
| Oil produced during period May 1, 1939, to May 1, 1940 |
2,278,045 | 405,736 | 2,228,384 | 396,891 |
| 1One cubic foot of oil at 109° F., = 0.9782 cu. ft. of oil with an A.P.I. gravity of 35 degrees at 60° F. (National Standard Petroleum Oil Tables, U.S. Bureau of Standards, Circular C410, p. 43, 1936.) 2 Based on assumptions that (1) no gas is dissolved in the oil, (2) no connate water is present, and (3) no shrinkage of oil takes place due to escape of gas from solution. |
||||
The total quantity of oil originally present in the Otis pool is estimated to have been 5,913,409 barrels, expressed as stock tank oil, of which 50 per cent is considered to be recoverable. Of the latter amount, 1,411,386 barrels had been recovered by May 1, 1941; this leaves 1,545,323 barrels remaining to be recovered. All the above calculations and estimates ignore the presence of connate water in pore spaces of the rock and of dissolved gas in the oil. If either or both of these factors should be taken into consideration the volume of oil expressed as stock tank barrels would be reduced. The estimates of recoverable oil purposely ignore the great difficulty that will accompany efforts to produce it without an inevitable increase in the over-all gas-oil ratios.
Figure 3--Conversion chart showing relation of bottom-hole pressure to bottom-hole pressure divided by the deviation factor, for calculating ordinates of fig. 2.
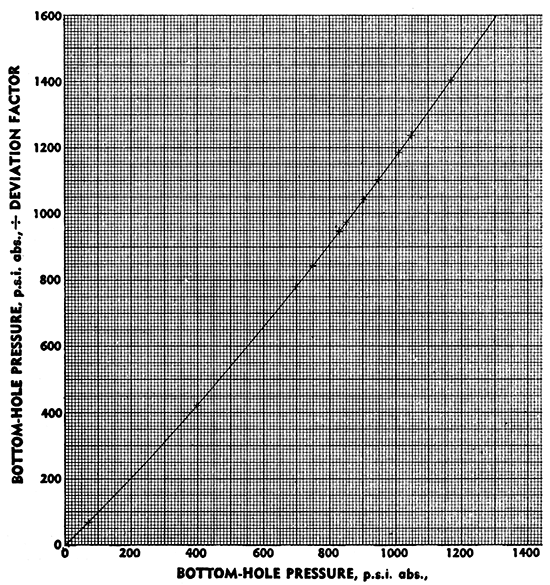
Figure 4--Graph showing relation of bottom-hole pressure to deviation factor.
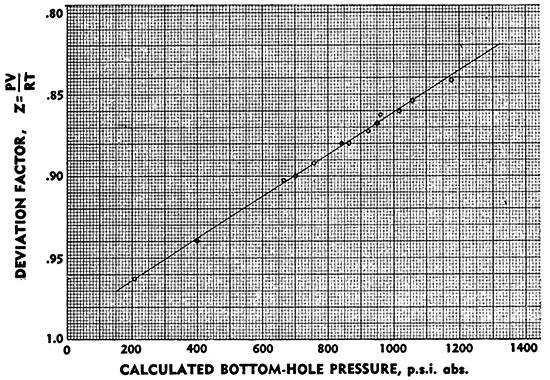
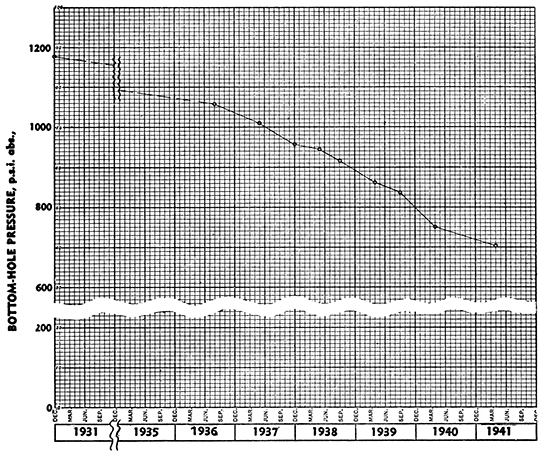
Figure 5--Graph showing bottom-hole pressure decline by years (1931-1941).
The original volume of gas in the Otis pool occupied 2,663 million cubic feet, at reservoir conditions, and comprised 98.74 per cent of the total reservoir space, while the oil occupied 33,941,000 cubic feet or only 1.26 per cent; therefore the pool must be regarded as a gas pool rather than an oil pool.
It has been established both theoretically and experimentally that where oil and gas are present in the same sand, the difficulties of completing and operating the wells are such that they usually produce excess quantities of gas, even under most careful control. Hence it is necessary to maintain relatively low pressures at the separators; otherwise the wells produce virtually all gas and no oil. Gradually the permeability of the pay diminishes with respect to oil, and at the same time it increases with respect to gas; thus in the fluid produced the proportion of gas tends to increase and the proportion of oil to decrease. Ultimately a point is reached where gas alone is produced, even though 30 to 60 per cent of the total oil originally present still remains in the sand. Long before this point is reached, however, the operation of the wells probably will have become unprofitable, owing to the compression cost of the increased volume of gas that must be handled if the gas is to be returned to the reservoir or sold directly to pipe-lines.
High gas-oil ratios have characterized the oil production of the Otis pool since the date of its discoverey. As a result of most careful testing by engineers of the Bureau of Mines in 1937 (Heithecker, McCarroll and Kreuger, 1937), these ratios were found to have ranged from 7,600 cubic feet per barrel to 176,500 cubic feet per barrel. The results obtained during the tests by the U.S. Bureau of Mines engineers are shown in tables 1 to 5 inclusive, which are reproduced from the report referred to on page 348.
In order to reduce the high gas-oil ratios that had prevailed in the Otis pool, several operators undertook expensive reconditioning operations at the wells. Some degree of success attended these efforts, but it has been necessary to repeat the reconditioning process several times. After these treatments the gas-oil ratios have continued to be extremely high, as determined from well tests, from the pressure decline of the field, and from consideration of the actual quantity of gas marketed and accounted for from the reservoir.
From May 1, 1939 to May 1, 1940, the oil production amounted to 396,891 barrels, and the estimated quantity of gas produced, but not accounted for, was 7,700 million cubic feet, equivalent to a gas-oil ratio of 19,400 cubic feet per barrel, measured at standard conditions (tables 14, 15, and 16). During the first four months of 1940 (table 11) the Corporation Commission figures show that 787,395,000 cubic feet of gas were vented while 108,480 barrels of oil were produced; these volumes represent a gas-oil ratio of 7,256 cubic feet per barrel. The latter in itself is a high gas-oil ratio, but is less than the average quantity computed by us and regarded as unaccounted for during the same four-month period. According to Corporation Commission figures, the average quantity of gas vented during 1940 was 8,206 cubic feet per barrel, whereas the decline in pressure of the reservoir indicates that the gas unaccounted for (including vented gas), or the over-all gas-oil ratio for 1940, was about twice that amount. Within the first four months of 1941, during which time the pool was shut-in to a maximum of 15 barrels per day per well, the gas oil ratio dropped to 3,546. This improvement is clearly shown on figure 2 by the divergence of line J-W towards the right and away from J-P'. Point W represents a higher pressure and a smaller cumulative gas volume than would have resulted if the oil wells had been permitted to operate with such high gas-oil ratios as had prevailed before May 1, 1940.
Table 16--Comparison of gas-oil ratios in the Otis pool at reservoir and at surface conditions, based on a total reservoir volume of 2,696,941,000 cubic feet.
| Original reservoir gas-oil ratio | Surface gas-oil ratio | |||
|---|---|---|---|---|
| Cu. ft. gas at 1178 p.s.i. and 109° F. to cu. ft. oil at 109° F. |
Cu. ft. gas at 1178 p.s.i. and 109° F. to bbls. oil at 109° F. |
Cu. ft. gas at 16.4 p.s.i. and 60° F. to cu. ft. oil at 60° F. |
Cu. ft. gas at 16.4 p.s.i. and 60° F. to bbls. oil at 60° F. |
|
| Ratio of original gas to original oil in reservoir |
78.46:1 | 440:1 | 6,262:1 | 35,157:1 |
| Ratio of original recoverable gas to original recoverable oil, at abandonment pressure of 350 p.s.i. |
109.31: 1 | 614:1 | 8,723:1 | 48,973:1 |
| at abandonment pressure of 50 p.s.i. | 149.08:1 | 837:1 | 11,897:1 | 66,797:1 |
| Ratio of remaining gas to remaining oil on May 1, 1941 |
56.92:1 | 320:1 | 4,542:1 | 25,500:1 |
| Ratio of remaining recoverable gas to remaining recoverable oil on May 1, 1941, at abandonment pressure of 350 p.s.i. |
71.48:1 | 401:1 | 5,705:1 | 32,032:1 |
| at abandonment pressure of 50 p.s.i. | 144.08:1 | 809:1 | 11,502:1 | 64,582:1 |
| Ratio of total gas removed to total oil recovered during period from Sept. 1, 1936, to May 1, 1941 |
110.23:1 | 619:1 | 8,812:1 | 49,478:1 |
| Ratio of gas vented and unaccounted for to oil recovered from Sept. 1, 1936, to May 1, 1941 |
41.79:1 | 235:1 | 3,338:1 | 18,744:1 |
| Ratio of gas vented and unaccounted for to oil recovered from May 1, 1939, to April 1, 1940 |
43.02:1 | 242:1 | 3,455:1 | 19,400:1 |
A thorough study of the relationship between the volume of gas reported as marketed (fig. 2, B to W) and the quantity that the pressure-decline curve indicates was produced (B to X) shows that since Sept. 1, 1936, soon after the discovery of oil, the average gas-oil ratio has been approximately 18,750 cubic feet per barrel.
Both the decline curve and the application of the average gasoil ratio (18,750 cubic feet per barrel) to the total oil production of the pool (1,411,386 barrels), show that 60,354,000 barrels of reservoir space have been voided by the combined volume of oil produced and gas vented therewith. This means that 12.6 per cent of the original reservoir space has been voided in the production of oil that originally occupied only three-tenths of one per cent of the total reservoir space (table 17).
Table 17--Summary of on and gas data for the Otis pool, expressed as percentage of reservoir volume.
| Gas | per cent |
|---|---|
| Reservoir volume occupied originally by gas | 98.74 |
| Reservoir volume occupied originally by recoverable gas with 350 p.s.i. as the abandonment pressure (1855/2696.9 x 100) | 68.78 |
| Reservoir volume occupied originally by recoverable gas with 50 p.s.i. as the abandonment pressure (2530/2696.9 x 100) | 93.81 |
| Reservoir volume occupied originally by gas sold, as of May 1, 1941 (784/2696.9 x 100) | 29.44 |
| Reservoir volume occupied originally by gas lost in well operations, as of May 1, 1941, plus gas vented prior to oil production (74/2696.9 x 100) | 2.75 |
| Reservoir volume occupied by gas vented and. unaccounted for, during period from Sept. 1, 1936, to May 1, 1941 (334/2696.9 x 100) | 12.38 |
| Reservoir volume occupied by all gas produced, as of May 1, 1941 (1192/2696.9 x 100) | 44.19 |
| Reservoir volume occupied by gas remaining, as of May 1, 1941 (1471/2696.9 x 100) | 54.55 |
| Oil | per cent |
| Reservoir volume occupied originally by total oil | 1.26 |
| Reservoir volume occupied originally by recoverable oil (50 per cent of total oil) | 0.63 |
| Reservoir volume occupied originally by total oil sold, as of May 1, 1941 | 0.30 |
| Reservoir volume occupied originally by oil remaining in reservoir and recoverable as of May 1, 1941 | 0.33 |
| Gas and Oil | per cent |
| Reservoir volume occupied originally by all oil and gas produced as of May 1, 1941 | 44.50 |
From an economic standpoint, the excess gas production of 26,100 million cubic feet, measured at standard conditions of 16.4 pounds per square inch and 60° F., is equivalent, at 4 cents per thousand cubic feet, to $1,044,000. First-hand information is lacking as to the selling price of the oil per barrel from the Otis pool; but if the price has been of the order of magnitude of 70 cents per barrel, which has been the case for at least a part of the crude oil, it would seem that more money has been lost in the production of gas with oil than has been received from the sale of the gross barrels produced.
Figure 6--Cumulative pipe-line gas sales to 1941, Otis pool.
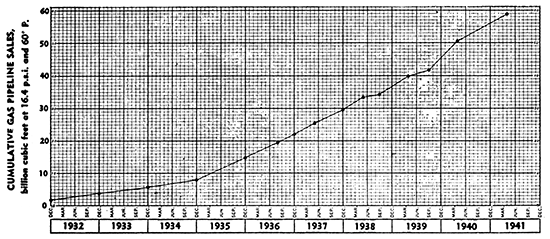
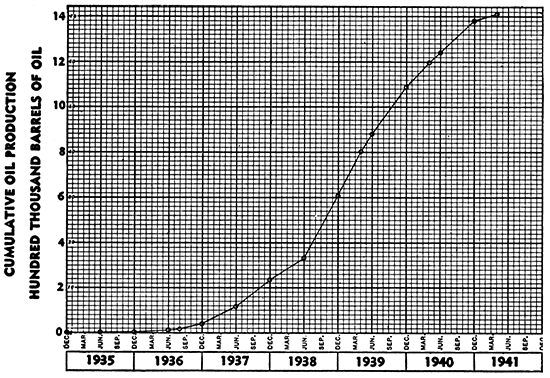
Figure 7--Cumulative oil production to 1941, Otis pool.
It is hereby proposed that an allocation plan applicable in the future to the Otis oil production should include the following objectives:
It should be noted that the volume of gas produced even at the gas-oil ratios which have been used by the Conservation Division of the Corporation Commission is many times the volume of oil produced, where both volumes are expressed at the initial pressure and temperature of the reservoir (table 16). No possible method of allocation can ever fully compensate for the over-production of gas.
The difficulties that attend efforts to produce oil from a reservoir whose contents are virtually 100 per cent gas (expressed at reservoir pressure and temperature) are almost insurmountable under competitive operating conditions.
The value of gas is two-fold: (1) as an essential commodity in modern civilization, and (2) as an exhaustible source of energy for the expulsion of oil. The aims of a true conservation program should be directed toward the realization of both values. It is believed that these objectives can only be achieved in the case of the Otis pool through separate unitization of both the gas and the oil areas. Such unit plans or agreements should have incorporated therein provision for the return to the reservoir of all gas produced with the oil which is not utilized as fuel for the compressor plants.
Brown, George Granger, 1941, Deviations of natural gas from ideal gas laws: The Oil Weekly, Dec. 30, vol. 100, no. 4, pp. 30-40, and Jan. 6, vol. 100, no. 5, pp. 26-34.
Heithecker, R. E., McCarroll, C. F., and Krueger, W. F., 1937, Data report on the Otis field: U. S. Bureau of Mines in cooperation with the State Corporation Commission of Kansas.
Rawlins, E. L., and Schellhardt, M. A., 1935, Back pressure data on natural gas wells and their application to production practices: U.S. Bureau of Mines, Monograph 7.
U.S. Bureau of Standards, 1936, National Standard Petroleum Tables: U.S. Bureau of Standards, Circular C. 410, p. 43.
Figure 8--Areal outline map of oil- and gas-producing areas, Otis pool.
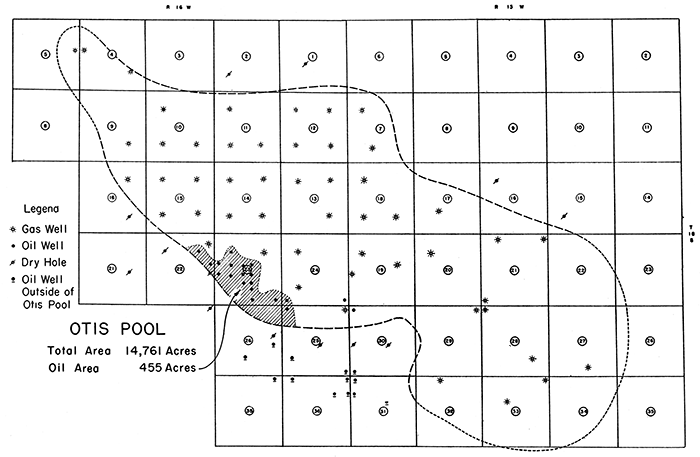
Figure 9--Bottom-hole pressure contour map, September 1, 1936.
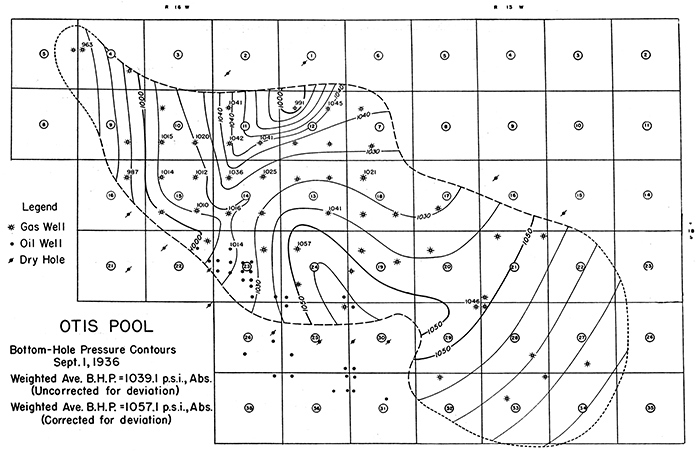
Figure 10--Bottom-hole pressure contour map, June 1, 1937.
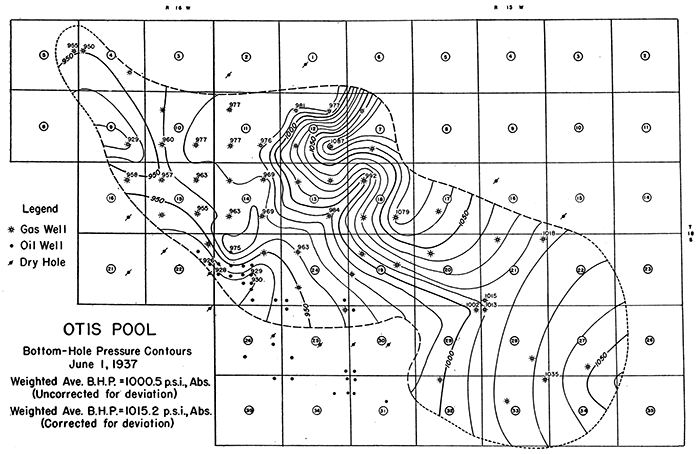
Figure 11--Bottom-hole pressure contour map, January 1, 1938.
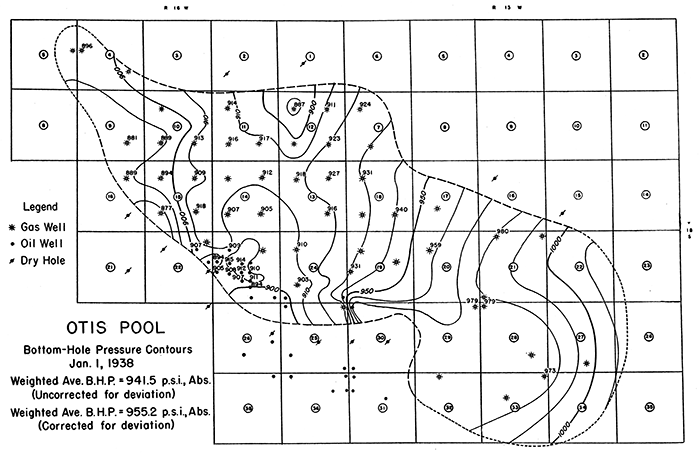
Figure 12--Bottom-hole pressure contour map, June 1, 1938.
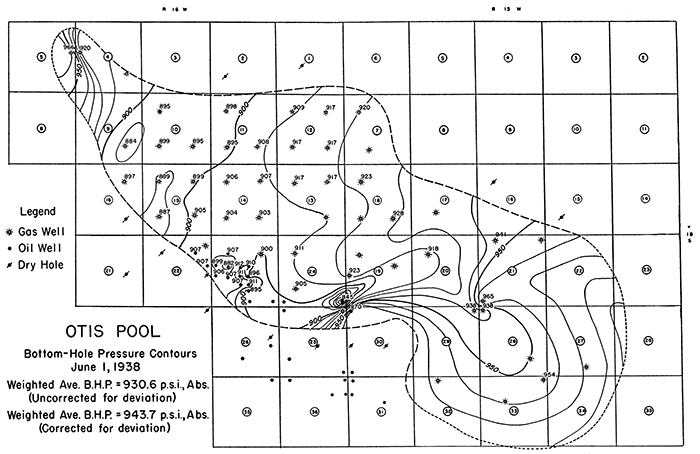
Figure 13--Bottom-hole pressure contour map, October 1, 1938.
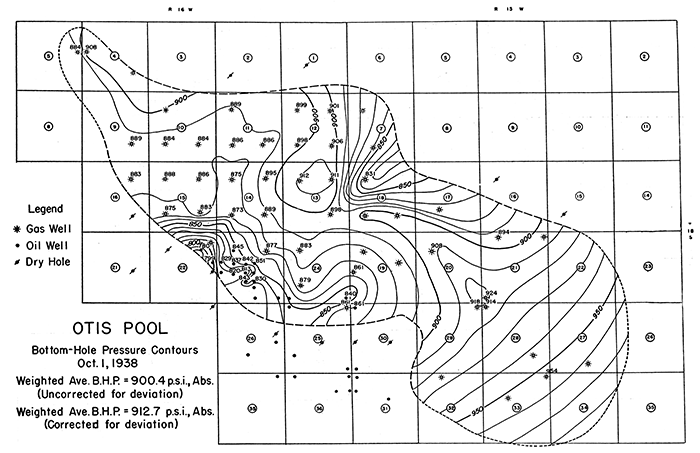
Figure 14--Bottom-hole pressure contour map, May 1, 1939.
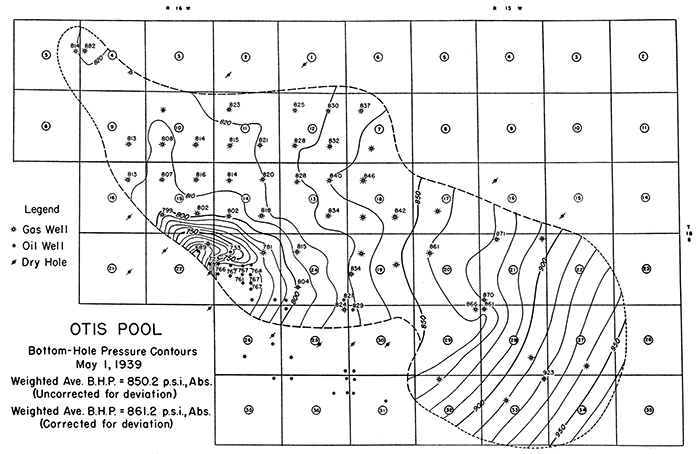
Figure 15--Bottom-hole pressure contour map, October 1, 1939.
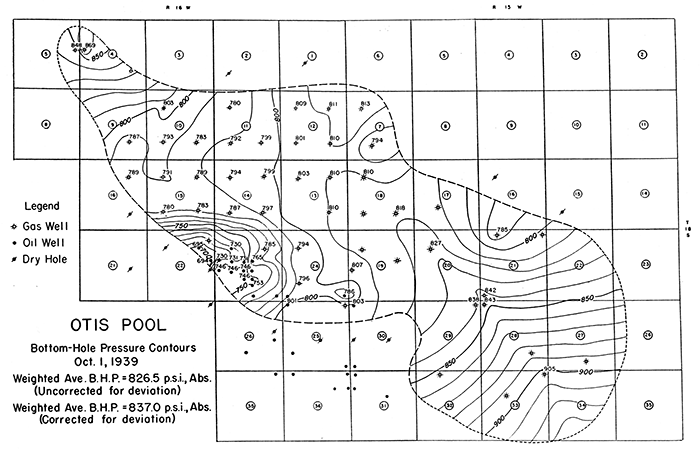
Figure 16--Bottom-hole pressure contour map, May 1, 1940.
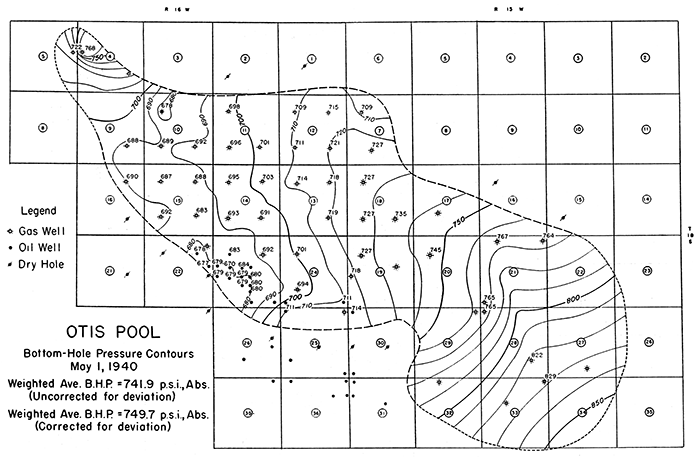
Figure 17--Bottom-hole pressure contour map, May 1, 1941.
Kansas Geological Survey
Placed on web March 9, 2015; originally published November 28, 1941.
Comments to webadmin@kgs.ku.edu
The URL for this page is http://www.kgs.ku.edu/Publications/Bulletins/38_12/index.html