![]()
Prev Page--Well Location and Percent Dakota Yield || Next Page--Groundwater Geochemistry, continued
Groundwater Geochemistry
Introduction
Data about and interpretation of the geochemistry of groundwater in the Dakota aquifer is valuable for 1) determining and predicting where (including areal and vertical dimensions) water resources suitable for different uses are located, 2) understanding the origin of factors that control individual constituents of concern for various water uses, 3) differentiating between natural and contamination sources of constituents, and 4) estimating the temporal changes in chemistry related to impacts on groundwater flow caused by pumping. The initial discussion in this section describes the water chemistry data assembled for the Dakota aquifer, including new data collected during the Dakota Aquifer Program based on water sampling and interpretation of geophysical (resistivity) logs. The data interpretation begins with a section on factors that control groundwater geochemistry in the aquifer. The discussion of the relationship between groundwater conductance and dissolved constituents provides information about how well the chemical character of waters can be estimated from this easy-to-measure property. The next subsection describes characteristics of contaminated groundwater in the Dakota aquifer, including a method for distinguishing between natural and contamination sources of salinity in the aquifer. The following two subsections discuss spatial variations in the groundwater chemistry, first regional patterns and then vertical changes. The final subsection examines the geochemistry across the saline and freshwater transition in the aquifer in north-central Kansas based on numerical modeling to help in understanding the chemical development and changes in this region.
Chemical Data for Groundwaters
Data for Water Samples
The basis for valid interpretation of the geochemistry of groundwater in the Dakota aquifer is chemical data for which the quality and uncertainties are known. A substantial effort of the Dakota Aquifer Program involved assembling existing data followed by examination of quality characteristics, correction of errors, and elimination of records or values for which the uncertainty in the data was too large for use in geochemical interpretation. Another component of the program involved collection of new data from many wells distributed across the aquifer, including observation wells installed as part of the program and private and public supply wells. The data base created from the existing and new water analyses provides the most complete chemical record available for the Dakota aquifer in Kansas.
Water-Quality Data Base
Water-quality data for the Dakota aquifer were assembled from existing sources and analyses of samples collected as a part of the Dakota Aquifer Program. A data base was first developed based on INFO in ARC/INFO (ESRI programs). Tables for selected groups of data were converted to Microsoft Excel spreadsheet files and placed on the KGS website for the Dakota Aquifer Program. Well sites from which water samples were collected and analyzed were coded according to the USGS system for formations in Kansas. Chemical data were included for the Dakota Formation or older formation names equivalent to the Dakota, undifferentiated Lower Cretaceous strata, the Kiowa Formation, and the Cheyenne Sandstone.
As of late 2013, the data base contained 1,641 chemical records related to the Dakota program, of which 1,594 are for samples from wells yielding water entirely or partly from the Dakota aquifer. The 48 other records are for samples from wells obtaining water from strata above or below the Dakota aquifer. The data for samples entirely or partly from the Dakota aquifer represent 1,192 sampling locations (a unique sampling point or interval), 10 of which are in southeastern Colorado and the rest of which are in Kansas. Although most well sites consist of only one sampling interval, some wells or boreholes have been sampled at multiple depths; each of these depths represents a separate sample site identification in the data base. A total of 1,123 well sites sampled only the Dakota aquifer. Of these, 1,002 sites are coded for samples entirely from the Dakota Formation, an equivalent unit, or Lower Cretaceous Series. In addition, 81 sample locations are coded as the Kiowa Formation, 38 locations as the Cheyenne Sandstone, and two locations as a combination of Dakota and Cheyenne or Kiowa and Cheyenne. Other locations are for samples from wells that obtain groundwater from the Dakota and non-Dakota aquifer units. The data base includes records for multiple samples (collected at different dates or times) from 121 of the wells completed entirely or partly in the Dakota aquifer. A total of 433 records represent the additional samples collected after the initial sample from the 121 well locations.
There are 313 water-quality records in the data base for samples collected as a part of the Dakota Aquifer Program. The KGS collected and analyzed 170 of these samples. Kansas State University collected and analyzed 80 samples as a part of a cooperative study for the Dakota Program. The KGS arranged for Kansas companies, conducting exploration studies for groundwater supplies and for a monitoring well, to collect 63 samples and send them to the KGS for analysis and use in the Dakota Program.
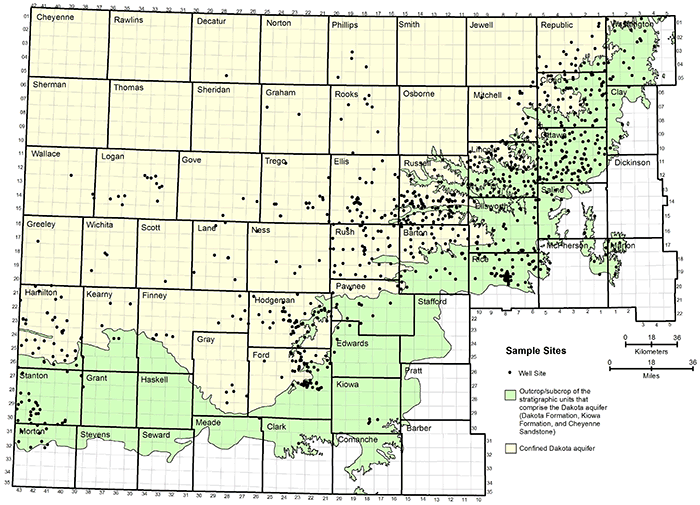
Figure 1 shows the distribution of the geographic locations of the well sites in Kansas from which groundwaters were analyzed and that obtained their water solely from the Dakota aquifer. Most of the sites are located where the water in the aquifer is of good enough quality to be used for water supply. The densest distribution of points is in a band along the eastern outcrop and subcrop of the Dakota Formation, with smaller numbers of points in southwestern Kansas.
Figure 1--Distribution of the locations of wells from which groundwaters were collected from the Dakota aquifer.
Excel spreadsheets with location and site information and chemical data for the groundwaters in the Dakota program data base are included on the online website for the Dakota Aquifer Program (http://www.kgs.ku.edu/Dakota/vol2/qualDB/quality.htm).
Existing Data
Water-quality data were assembled from several different existing sources. Most of the existing data were obtained from a USGS electronic water-quality data base. Other data sources include the National Uranium Resource Evaluation (NURE) program (now available from the USGS website for the National Geochemical Database [Smith, 1997], http://pubs.usgs.gov/of/1997/ofr-97-0492/) and the KDHE. The electronic data sets were found to contain many problems and errors, such as duplications due to incomplete information in one of the duplicate records, mistyped numbers, incorrect locations or depths, and incorrect identification of geologic unit (for example, 15 samples from McPherson County in the NURE data base for which the water-producing formation was identified as the Kiowa Formation but which were actually sampled from the HPA or Permian strata). These errors were found during the course of the Dakota program and later as the data were examined during the preparation of this bulletin. The errors were corrected to the extent possible, including by referring to the original printed version of the data in publications (KGS and USGS) if they could be found. Some records, such as those for samples that were not actually in the Dakota aquifer, were not used. Another major source of existing data was publications of the KGS such as county bulletins. Chemical records in the bulletins were entered into the data base if not already in the USGS data set. Many missing values of major constituent concentrations for existing records in the data base were filled by referring to original data publications.
Aquifer codes were assigned if not present based on examination of the well location and depth relative to the surface elevation and contour maps of stratigraphic tops and thicknesses (Macfarlane et al., 1990). General aquifer codes in records were changed to more specific codes for many of the well sites. For example, the code 210CRCS (Cretaceous System) was changed to 210DKOT (Dakota Formation) or 217KICY (Kiowa Formation and Cheyenne Sandstone), or 211NBRR (Niobrara Formation), in order that the water-quality data could be assigned to the Dakota aquifer or other geologic units.
Selected chemical data were removed from selected records of existing data if clearly inconsistent with the body of data for the record. For example, five values of field specific conductance (NURE data) were deleted in sample records with total dissolved solids (TDS) concentrations that were more than twice the conductance. Summation of the major constituent concentrations indicated that the TDS values were correct. Four of these five values are for samples collected on November 14 and 17, 1978, suggesting that the meter used for these measurements may not have been calibrated properly. A reported TDS sum that was more than four times the measured TDS was replaced with a TDS sum computed from the reported concentrations of major constituents. Values of pH less than 4.5 units were deleted for five sample records because a substantial bicarbonate (HCO3) concentration is in the records, an occurrence that is inconsistent because there cannot be any bicarbonate measured at that pH. Four of these five records are for samples collected on November 10, 1978, suggesting that the electrode was not properly calibrated for the field pH measurements on that day. Five additional records had pH values in the range 5-6.2 units. These values are suspected to be too low, especially the values less than 6 units. Three of these five pH measurements were made during November 13-14, 1978, a period close to the date for which four pH values of less than 5 units were measured and which are clearly inaccurate. High pH values (greater than 9 units) were left in the data base even though most of these probably represent the effect of cement grout used to seal the annular space of the borehole and not the actual groundwater. The high pH measurements should alert the viewer to the potential impact on selected constituents such as bicarbonate, calcium (Ca), and magnesium (Mg) concentrations. One pH value of 9.6 was deleted from a record because the 25 other samples collected from the same site had a pH range of 7.0 to 7.8 units.
Although a substantial effort was made to correct obvious errors and eliminate records and values deemed to have too great an error or uncertainty for use in interpretation of water chemistry, this study does not claim to have discovered all errors in the data. The user of the data base created for the Dakota program should be aware of the possibility of undiscovered errors.
Data collected for the Dakota Aquifer Program
Sampling and analytical procedures
The KGS collected water samples from wells and analyzed them in its laboratory to provide additional data necessary for characterizing the regional water quality, determining mechanisms controlling water chemistry, assessing the supply uses of the water, and assisting in the geohydrologic evaluation of study sites of the Dakota Aquifer Program. The sampling sites included existing water-supply wells and observation wells installed in test holes drilled for the Dakota program. The KGS obtained other samples that staff of local agencies and water-resource consultants collected from test holes and observation and supply wells, and analyzed them for conservative constituents (those that do not require special sample treatment and preservation).
The KGS sampled water-supply wells after pumping for approximately one-half to one hour, wherever possible, to obtain water representative of that in the formation. The sample location was located as close to the well as practical. In a few cases, a 30-gallon pressure tank was in the system and no tap was available between the tank and the well. Where this occurred, the well had been in active use during the same day of sampling, thus, effects of the tank on the sample should be minimal. In some instances, sampled water passed through a garden house at the site during the period before and during sampling because the well owner did not want water to accumulate near the well. At one domestic well location, the pumping occurred for only about 15 minutes prior to sampling because longer pumping would draw the water level below the pump intake and damage the pump. At this site, the water came through an underground pipe from the well to an outdoor hydrant without passing through a pressure tank. Sampling at test wells was after a substantial period of pumping to provide water representative of that in the strata at the depth of the screened interval of the well.
The KGS measured temperature, specific conductance, and pH at the time of collection of water samples. Sampling during 1990-1997 included measurement of temperature and specific conductance during the pre-sampling pumping to ensure that these properties had stabilized before sampling. The pH meter was calibrated using pH 4 and 7 buffers at the beginning of each day and checked after about each half day of use with the pH 7 buffer. Buffer checks agreed to less than 0.1 pH unit.
Samples for determination of dissolved inorganic constituents were collected in polyethylene bottles. Unfiltered, unacidified samples were collected directly from the hydrant, hose, or irrigation pipe point of water exit. Samples for measurement of trace metal contents were preserved with high-quality acid. Samples sent to USGS laboratories for determination of radionuclides were collected and preserved according to the appropriate USGS protocol. For example, the USGS procedure for collecting samples for radon (Rn) determination involved extracting the water with a 10 mL glass syringe with a metal needle from a water stream that had as little agitation as possible to avoid substantial gas loss. In some cases a hose was placed in the bottom of a 1 L polyethylene bottle and the pumping rate reduced such that the water stream exited the bottle without bubbles forming. In other cases, the syringe was either placed into the stream from the sampling point or immediately into water collected in a 1 L polyethylene bottle. The water collected in the syringe was injected into mineral oil in a glass vial. Two samples were collected at each site for radon determination in order to assess the sampling error related mainly to gas loss. Samples for radon determination were sent by express mail directly to the analytical laboratory used by the USGS for this constituent.
Samples preserved with hydrochloric acid were placed into polyethylene bottles into which the acid had been previously added at the KGS. Nitric acid preservation was accomplished by adding the acid from sealed glass ampules obtained from the USGS. All samples except those for radon measurement were stored in coolers with ice after collection until being brought to Lawrence. Samples for metals determination were filtered in the field by passing the water collected in a large polycarbonate jar through a 0.45 µm membrane filter in a polyethylene holder using pressure from a peristaltic pump with silicone tubing. Approximately 10 or more liters of water were placed in the jar, which was fitted with a polyethylene spigot and tubing attached at the bottom of the jar that allowed flow into the silicone tubing.
The KGS determined concentrations of dissolved inorganic constituents at its analytical laboratory. Alkalinity content was measured using an automated titrimeter and converted to bicarbonate. Concentrations of dissolved silica (SiO2), boron (B), the cations calcium, magnesium, sodium (Na), potassium (K), strontium (Sr), and barium (Ba), and the metals iron (Fe), manganese (Mn), and zinc (Zn) were determined on a Jarrell-Ash inductively-coupled argon plasma spectrometer (ICP). Measurements of the trace metals cadmium (Cd), copper (Cu), chromium (Cr), lead (Pb), and silver (Ag) and the semimetals arsenic (As) and selenium (Se) were made using a graphite furnace on a Jarrell-Ash atomic absorption spectrophotometer. The trace metals iron and manganese were also determined using the graphite furnace if the concentrations were lower than the quantifiable limits of the ICP analysis, 25 and 4 µg/L, respectively. Mercury (Hg) content was determined by the cold vapor technique on the atomic absorption spectrophotometer. Concentrations of the anions chloride (Cl), sulfate (SO4), nitrate (NO3), ammonium ion (NH4), phosphate (PO4), bromide (Br), and total inorganic iodine (I) were made by segmented flow analysis on a Technicon AutoAnalyzer II system with the appropriate analytical cartridges. Fluoride (F) content was measured with a selective-ion electrode and a Hach pH/ISE meter.
The KGS laboratory carefully followed quality assurance and control procedures to ensure high accuracy of the data for research purposes. These steps included checks for charge-balance errors for major constituents. The KGS participated in the USGS Standard Reference Sample Project (http://bqs.usgs.gov/srs/) for laboratory quality assurance and always had very good agreement with the published values for the reference samples.Supply and test well sampling
The KGS collected and analyzed groundwater samples as part of a Dakota aquifer study in central Kansas for the Kansas Corporation Commission (Macfarlane et al., 1988). The KGS collected samples from domestic, stock, and municipal wells in 1987 (and resampled one well in 1988) and from four monitoring well sites in 1987-1988. The supply wells were located in Barton, Ellis, Graham, Rooks, Rush, Russell, and Trego counties. The monitoring well sites were near Hill City in Graham County (upper Dakota and lower Dakota wells), north of Hays in Ellis County (upper Dakota, lower Dakota, Cheyenne, and Cedar Hills wells), and near Gorham in Russell County (upper Dakota, lower Dakota, Cheyenne, and Cedar Hills wells). The records for the samples from the Dakota aquifer (45 from supply wells and 11 from monitoring wells) and the underlying Cedar Hills Sandstone (two samples) listed in Macfarlane et al. (1988) were entered into the water-quality data base.
The KGS collected groundwater samples from supply wells for the developed areas of the Dakota aquifer in north-central, south-central, and southwest Kansas during 1990-1993. This included Cloud, Lincoln, Mitchell, Ottawa, Republic, and Washington counties in north-central Kansas; Barton, Ellis, Ellsworth, and Russell counties in central Kansas; and Finney, Gove, Hamilton, Hodgeman, Lane, Ness, Scott, Trego, and Wichita counties in southwest and west-central Kansas. The wells were used for domestic, municipal, stock, and irrigation supplies. Sampling in 1992 included supply wells in southeastern Colorado as part of a traverse from Colorado to central Kansas conducted in cooperation with the Lawrence Livermore National Laboratories (LLNL). The LLNL collected samples for determination of selected trace constituents and isotopes for use in studies of the groundwater geochemistry of the Dakota aquifer.
The KGS sampled groundwaters during pumping of observation wells installed in test holes drilled as part of the Dakota Aquifer Program during 1991-1995 and 1996-1997. The sampled wells were located at the study sites in Cloud, Hodgeman, Lincoln, Stanton, Trego, and Wallace counties. The KGS also collected samples from two observation wells installed in Gray County, one in the HPA and one in the Dakota aquifer, for part of an evaluation of the hydraulic connection between the two aquifers. The KGS cooperated with consulting companies investigating the potential of the Dakota aquifer in Ellis and Russell counties to obtain water samples that the KGS then analyzed. The KGS used the data for subregional characterization of salinity and determination of the dissolved chloride source in the groundwaters. The cooperative LLNL and KGS profile of groundwater geochemistry from southeast Colorado to central Kansas also included sampling of selected observation wells at the test-hole study sites of the Dakota program. Chemical data for these samples are in the online data base for the Dakota program.
Water Quality from Geophysical Logs
Little water sample data exist for the Dakota aquifer in northwest Kansas. However, many oil and gas boreholes pass through Dakota strata in northwest Kansas for which geophysical logs exist. Boeken (1995) estimated TDS concentrations for groundwaters in Dakota strata from geophysical logs that included self potential (SP) curves. The description of the principles on which the SP curves are based and the analysis of the curves for estimation of formation water resistivities are in Macfarlane, Doveton, and Whittemore (1998).
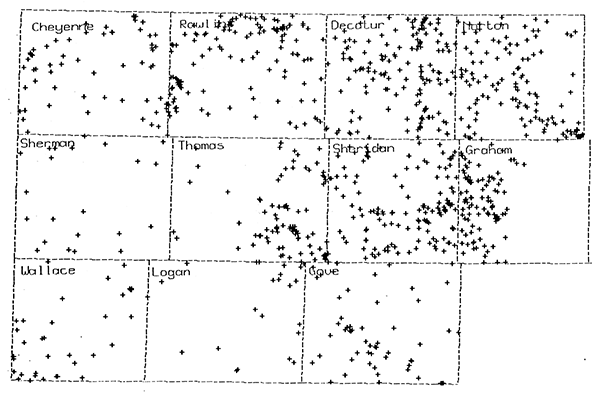
Boeken (1995) analyzed 977 SP logs for oil and gas boreholes in 11 counties (Cheyenne, Decatur, Gove, Graham, Logan, Norton, Rawlins, Sheridan, Sherman, Thomas, and Wallace) in northwest Kansas to estimate water resistivity values for formation waters in the Dakota aquifer. He determined water resistivities for a single sandstone unit for 890 boreholes, two sandstone units at different depths for 69 boreholes, three sandstone units for 14 boreholes, and four sandstone units for four boreholes, for a total of 1,086 values. Of that total, 1,078 values were for formation waters in sandstones in the Dakota Formation, three for sandstones in the Kiowa Formation, and five for sandstones in the Cheyenne Sandstone. Figure 2 shows the geographical distribution of the borehole locations.
Figure 2--Distribution of the locations of the oil and gas boreholes in northwest Kansas for which the resistivities of groundwaters in the Dakota aquifer were estimated from geophysical log analysis.
The specific conductance of a water is the reciprocal of the resistance value Rw. The subsection below on factors that control groundwater chemistry shows that the TDS concentration in groundwater from the Dakota aquifer can be estimated well from the simple relationship between specific conductance and TDS concentration for the Dakota aquifer.
Boeken (1995) converted the Rw values from the 75 °F standard for the oil and gas industry to values for 25 °C (77 °F), the standard temperature used for conductance measurements in water-resources investigations. The TDS concentrations that Boeken listed in his report were based on a factor of 0.6 times the conductance of the formation water in the sandstone units for which he determined µ from the SP curves. The TDS concentration estimates used in this bulletin were recalculated using the equation
TDS (in mg/L) = 0.64 x SpC - 20
where SpC is specific conductance in µS/cm at 25 °C. This equation, which is discussed in more detail in the following section, is based on water-sample data in the Dakota water-quality data base.
Factors that Control Groundwater Chemistry
The chemistry of groundwater primarily refers to the type and concentration of dissolved substances in the water and properties such as specific conductance, pH, and hardness. The dissolved substances include gases and inorganic and organic constituents. In addition, the isotopic concentrations of selected chemical elements are sometimes used in geochemical characterization of waters. The particular concentrations of different dissolved species and isotopes and values of chemical properties in a groundwater and the spatial changes in these values within an aquifer provide information about the geochemistry of the system. An understanding of the water geochemistry coupled with information about the hydrogeologic properties of the aquifer aids in the delineation of regional and local flow systems.
Table 6 lists the chemical properties and major, minor, and trace constituents that are of value for determining the geochemical characteristics of waters in the Dakota aquifer system. The table also lists general ranges for the properties and constituent concentrations for the Dakota aquifer along with water-use criteria.
Table 6--Chemical properties, general concentration ranges, and water-quality criteria for dissolved inorganic substances and selected metals that occur naturally in Dakota aquifer waters. Natural values of the properties and concentrations can be less or greater than listed in the table but are usually within the general range.
| Name | Chemical symbol or representation |
General range, mg/L |
Drinking water criterion, mg/La |
Livestock water criterion, mg/Lb |
Irrigation water criterion, mg/Lbc |
|---|---|---|---|---|---|
| Properties | |||||
| Total dissolved solids | TDSd | 100-60,000 | R 500 | 5,000e | |
| Alkalinityf | Represented as CaCO3 | 10-1,500 | S 300 | ||
| Total hardnessg | Represented as CaCO3 | 10-9,000 | S 400 | ||
| pH | 6.3-8.8 | R 6.5-8.5 unitsh | |||
| Major constituents (usually or often greater than 5 mg/L) | |||||
| Calcium | Ca | 2-2,000 | S 200 | ||
| Magnesium | Mg | 1-1,000 | S 150 | ||
| Sodium | Na | 3-22,000 | S 100 | ||
| Bicarbonatef | HCO3 | 12-1,800 | S 120i | ||
| Chloride | Cl | 2-35,000 | R 50 | ||
| Sulfate | SO4 | 1-6,000 | R 250 | 1,000j | |
| Silica | SiO2 | 4-50 | S 50 | ||
| Minor constituents (usually or often greater than 0.5 mg/L) | |||||
| Potassium | K | 1-150 | S 100 | ||
| Fluoride | F | 0.2-8 | R 2, M 4 | 2 | 1 |
| Nitrate | NO3 | < 0.01-3k | M 10 | 100 | |
| Boron | B | 0.03-3 | H 0.6 | 5 | 0.75 |
| Iron | Fe | < 0.001-10 | R 0.3 | 5 | |
| Manganese | Mn | < 0.001-1 | R 0.005 | ||
| Trace constituents (usually or always less than 0.5 mg/L) | |||||
| Ammonial | NH4 | < 0.01-5m | S 0.1 | ||
| Antimony | Sb | < 0.0001-0.007 | M 0.006 | ||
| Arsenic | As | < 0.0001-0.05 | M 0.01 | 0.2 | 0.1 |
| Barium | Ba | 0.005-0.5 | M 2 | ||
| Cadmium | Cd | < 0.0001-0.002 | M 0.005 | 0.02 | 0.01 |
| Chromium | Cr | < 0.0001-0.006 | M 0.1 | 1 | 0.1 |
| Copper | Cu | < 0.0001-0.007 | T 1.3 | 0.5 | 0.2 |
| Lead | Pb | < 0.0001-0.02n | T 0.015 | 0.1 | 5 |
| Manganese | Mn | < 0.001-1 | R 0.05 | 0.2 | |
| Mercury | Hg | < 0.0001-0.004 | M 0.002 | 0.01 | |
| Selenium | Se | < 0.001-0.03 | M 0.05 | 0.05 | 0.02 |
| Silver | Si | < 0.0001-0.001 | R 0.1 | ||
| Zinc | Zn | 0.001-1 | R 5 | 25 | 2 |
|
a Criteria from the Kansas Department of Health and Environment (KDHE). R = recommended (Federal Secondary Drinking Water Standard); S = suggested by KDHE; M = maximum contaminant level of U.S. EPA and KDHE; T = must be treated to below level for public supply; H = U.S. EPA health advisory. b Values recommended by the National Academy of Sciences/National Academy of Engineering or U.S. EPA except for sulfate, which is recommended by Environment Canada. Most of these values are also listed in KDHE (2004). c TDS and major constituent concentration limits range widely depending on salinity tolerance of plants and sensitivity of soil to sodium hazard of water. TDS concentration greater than 500 mg/L can be detrimental to sensitive crops, whereas water with up to 5,000 mg/L TDS can be used for tolerant plants on permeable soils with careful management practices. d TDS can either be a measured value for evaporation to dryness or a sum of constituents in which bicarbonate is multiplied by 0.4917. e A TDS of greater than 3,000 mg/L is not recommended for poultry. Adult cattle, sheep, swine, and horses can tolerate up to 7,000 mg/L if accustomed to elevated TDS. f Nearly all of the alkalinity in groundwater is bicarbonate. The bicarbonate can be calculated from the alkalinity by multiplying by 1.219. g Total hardness is the sum of calcium and magnesium concentrations multiplied by 2.497 and 4.116, respectively, to represent conversion to CaCO3. h The unit of pH is dimensionless and represents the negative log of the activity of the hydrogen (hydronium) ion in water. i The recommended limit for drinking water is based on conversion of the alkalinity value. j Very young livestock are sensitive to sulfate and may not be able to tolerate above 400 mg/L. k Concentration as nitrate-nitrogen. Values greater than 3 mg/L are often observed but are nearly always the result of human activities. Contaminated Dakota waters have been observed with nitrate. l Ammonia is present in natural water primarily as ammonium ion (NH4+). m Concentration as ammonia-nitrogen. n Lead concentrations > 0.01 are occasionally observed in waters from water-supply wells. These are believed to be mainly related to lead in the piping system. |
|||||
Natural rainfall contains dissolved air and a very small amount of dissolved solids. During the travel of rainfall through soil, sediment, and rock to reach an aquifer, the water dissolves additional solids. Most of the soluble solids picked up by the water are inorganic because inorganic minerals are the main component of soils, sediments, and rocks and because natural organic substances tend to be less soluble than many common minerals. Water flowing deeper into the subsurface may encounter very soluble minerals, such as gypsum (CaSO4 · 2H2O) or anhydrite (CaSO4) and halite (rock salt, NaCl), and produce mineralized water or saltwater after mineral dissolution. Other deep subsurface waters can be highly saline because they were originally trapped seawater that has been further altered through geologic time.
The most common substances dissolved in most groundwaters in the Dakota aquifer are the inorganic constituents calcium, magnesium, and sodium (positively charged cations) and bicarbonate, chloride, and sulfate (negatively charged anions). Bicarbonate may also be represented as alkalinity in water analyses. Inorganic constituents commonly contributing minor amounts to the dissolved solids in Dakota groundwater are silica (uncharged), potassium and strontium (cations), and nitrate and fluoride (anions). Trace to minor amounts of ammonium ion (a cation) and bromide (an anion) in groundwaters are also of value for describing the geochemistry of groundwaters.
Concentrations of major dissolved substances are commonly reported as milligrams per liter (mg/L). This concentration unit is essentially the same as a part per million (ppm) in freshwater, because the weight of a liter of dilute water at groundwater temperatures is very close to 1,000 grams (one million milligrams). In saltwater, a mg/L is a few percent different from a ppm because the density of the solution is greater than for freshwater. Concentrations of trace amounts of dissolved constituents are often listed as micrograms per liter (µg/L), which is essentially the same as parts per billion (ppb) in freshwater.
Chemical Properties and Major Dissolved Constituents
The property pH of a water is the negative log of the hydrogen (H+) ion activity and is a measure of how acidic or alkaline a water is. The lowest pH measured for the Dakota aquifer that appears accurate and representative of the groundwater is 6.3 units. The main geochemical process responsible for pH values less than 7 units in Dakota aquifer waters is the oxidation of sulfide in the mineral pyrite (FeS2) in the strata followed by the oxidation and hydrolysis of the dissolved ferrous iron released from the pyrite weathering. Varying amounts of carbonate minerals commonly occur in Dakota strata and these dissolve to buffer the pH such that it does not become very low. The highest pH values measured for the Dakota aquifer that appear accurate and representative do not exceed 9 units. Measurements of pH greater than 9 are probably related to the lingering effect of cement used to seal the borehole annulus of a well. Groundwater around the well bore that was affected by cement can continue to affect water chemistry if not completely removed by well development, such as in the case of observation wells in lower permeability sediments. Waters with pH in the 7.5-9 range are usually of sodium-bicarbonate type and occur in the confined Dakota aquifer. The elevated pHs are mainly derived from a natural softening process. Clays in confined Dakota strata that formerly contained saltwater had exchange sites dominated by sodium ions. As fresher recharge, with a higher (calcium + magnesium)/sodium ratio than the pore saltwater, locally recharged or flowed regionally through the aquifer, the adsorption of calcium and magnesium and release of sodium on the clays decreased the calcium and magnesium contents. This allowed calcium and magnesium carbonate minerals to dissolve, releasing carbonate ions (CO32-) that decreased the hydrogen ion concentration by forming bicarbonate ions.
The electrical conductivity of water is a chemical property that is proportional to the dissolved ion concentration. Conductivity is measured with a cup or dip type cell with electrode surfaces that are configured such that an electric current will pass through a particular volume of water. The electrical conductivity of a substance is the reciprocal of resistance. The units of specific electrical conductance are defined as the reciprocal of the resistance of a centimeter cube of aqueous solution. The International System of Units for scientific use expresses conductance as siemens (S), which is the same quantity as the mho. The expression mho was derived as the reverse spelling of the resistance unit ohm and can be found in older publications. The units most commonly used for specific electrical conductance of water are microsiemen per centimeter (µS/cm), which are the same in value as the units micromho/centimeter (µmho/cm). The conductivity of an aqueous solution varies proportionally with the temperature. An increase in one °C in a fresh to slightly saline water results in an increase of about 2% in the specific conductance when the temperature is near 25 °C Specific conductance values are corrected for temperature and reported at the standard temperature of 25 °C Measured specific conductance for the Dakota aquifer ranges from as low as 110 µS/cm for very fresh, shallow groundwater in the outcrop zone to 60,000 µS/cm for saltwater a few hundred feet deep in the confined aquifer. Several conductance values estimated from SP curve analysis for the confined aquifer in Cheyenne, Rawlins, and Sherman counties in the northwest corner of Kansas exceed 60,000 µS/cm and range up to 100,000 µS/cm (Boeken, 1995). The highest values either represent more concentrated saltwaters or could be due to estimation errors.
Freshwater is often defined as water that contains less than 1,000 mg/L TDS content. The measured TDS concentration is as low as 100 mg/L in very fresh, shallow groundwater in the Dakota aquifer and exceeds 50,000 mg/L in saltwater sampled from the confined aquifer in parts of north-central Kansas. Freshwaters in the outcrop and subcrop portions of the Dakota aquifer are usually calcium-bicarbonate type waters. Most soils and near-surface rocks in Kansas, including the Dakota aquifer, contain at least small amounts of calcium carbonate present as calcite (CaCO3), which also contains small amounts of magnesium. The mineral dolomite (CaMg[CO3]2) can also be present in the rocks. During infiltration of rainfall, the carbonate minerals dissolve and add calcium, magnesium, and bicarbonate to the water. When substantial rainfall recharge occurs in the drier, western areas of Kansas, it also dissolves small amounts of salts that have accumulated in soils from rainfall during periods when evapotranspiration has been sufficient to restrict recharge to underlying aquifers. Table 7 lists the typical ranges of major constituent concentrations in the most common chemical types of Dakota waters.
Table 7--Typical ranges of major constituent and fluoride concentrations in the most common types of groundwater in the Dakota aquifer. The water types are listed in order of generally increasing total dissolved solids concentration.
| Constituent | Typical range, mg/L |
|---|---|
| Calcium-bicarbonate type | |
| Calcium | 30-150 |
| Magnesium | 10-40 |
| Sodium | 10-60 |
| Bicarbonate | 150-400 |
| Chloride | 5-80 |
| Sulfate | 10-130 |
| Fluoride | 0.5-1.5 |
| Sodium-bicarbonate type | |
| Calcium | 3-50 |
| Magnesium | 1-20 |
| Sodium | 100-350 |
| Bicarbonate | 250-600 |
| Chloride | 20-200 |
| Sulfate | 20-200 |
| Fluoride | 1.5-5 |
| Calcium-sulfate type | |
| Calcium | 80-600 |
| Magnesium | 15-90 |
| Sodium | 30-400 |
| Bicarbonate | 200-400 |
| Chloride | 20-500 |
| Sulfate | 200-1,800 |
| Fluoride | 0.4-1.5 |
| Sodium-chloride type | |
| Calcium | 10-800 |
| Magnesium | 5-800 |
| Sodium | 300-15,000 |
| Bicarbonate | 200-1,300 |
| Chloride | 300-20,000 |
| Sulfate | 100-5,000 |
| Fluoride | 0.5-4 |
Fine-grained sediments in the Dakota aquifer and overlying rocks often contain pyrite. The pyrite weathers to produce dissolved ferrous iron and sulfate and the dissolved iron then oxidizes and hydrolizes to generate ferric oxyhydroxide minerals. The solution from pyrite weathering is acidic and dissolves additional calcite and dolomite during a natural neutralization process. This process increases the calcium, magnesium, sulfate, and bicarbonate concentrations dissolved in Dakota waters.
Rocks overlying the Dakota aquifer such as the Graneros Shale often include gypsum, a very soluble mineral. The gypsum generally occurs as a secondary mineral that was precipitated in the past as a result of pyrite weathering and carbonate mineral dissolution that increased the calcium and sulfate concentrations to above the solubility of gypsum. Water infiltrating through the Cretaceous strata overlying the Dakota aquifer can dissolve the secondary gypsum to produce relatively high concentrations of calcium and sulfate. Recharge of this water into underlying Dakota strata can then substantially increase the calcium and sulfate contents of waters in the upper aquifer. In some cases, calcium-sulfate waters may result, although this water type is not as common as the other common types of Dakota groundwaters (table 7).
Large areas of the Dakota aquifer contain saltwater (primarily dissolved sodium and chloride). Concentrations of TDS can exceed 10,000 mg/L (table 6). No known evaporite deposits occur in the Dakota aquifer in Kansas. Therefore, the saltwater has either been derived from past seawater trapped in the Dakota sediments or saltwater that has entered the aquifer from other formations. Bromide and chloride relationships in Dakota groundwaters indicate that the main source of this saltwater is dissolution of rock salt (halite, NaCl) in Permian rocks underlying Dakota strata. The source identification is described further in the subsection on characteristics of contaminated groundwater in this appendix. A short discussion of bromide concentration and sources appears later in the subsection on minor and trace constituents. Although most of the Dakota sediments probably contained seawater either during their deposition (the marine shales) or after deposition when the sea covered the Dakota system formations, bromide/chloride ratios indicate that nearly all of the seawater has been flushed out by surface recharge. However, saltwater from the underlying Permian rocks has been slowly intruding into Dakota strata for millions of years. The salt-dissolution brine replaced the seawater source of salinity long ago. During more recent geologic time, freshwater recharge has been slowly flushing saltwater from the Dakota aquifer in many areas.
Large amounts of sodium adsorbed on the clays in the shales, siltstones, and sandstones where saltwater was present in Dakota strata. As freshwater of calcium-bicarbonate type slowly flushed saltwater from the aquifer, the process of natural softening of the water occurred as dissolved calcium and magnesium adsorbed on the clays and released sodium to solution. The decrease in calcium concentration allowed some calcite (and dolomite, if present) to dissolve where it occurred in aquifer strata, thereby supplying additional calcium, magnesium, and bicarbonate to the water. The added calcium and magnesium were then available for more cation exchange with sodium. Some additional bicarbonate may have been generated from slow oxidation of organic matter trapped in Dakota sediments. The combined effect of these processes increased dissolved bicarbonate concentration, increased sodium concentration above that which would be expected by the freshwater flushing, while decreasing dissolved calcium, magnesium, and chloride concentrations in confined parts of the Dakota aquifer where the water is now fresh to slightly saline. The water types created are, in order of increasing salinity, sodium-bicarbonate type; sodium-chloride, bicarbonate type; and sodium-chloride type with excess sodium. The bicarbonate and chloride-bicarbonate type waters are typically soft because the calcium and magnesium concentrations are relatively low. Table 7 lists the typical ranges of major dissolved constituents in sodium-bicarbonate waters in the Dakota aquifer.
Relationships among Conductance and Major Dissolved Constituents
The relationships of specific conductance with concentrations of TDS and individual dissolved constituents are valuable for estimating concentrations from conductance measurements. Relationships of TDS with individual constituents are also useful for concentration estimates, for example, if TDS values calculated from geophysical log data are available. The patterns of individual constituent concentrations versus conductance and TDS give insight into the general chemical characteristics at different salinities of groundwaters in the Dakota aquifer across Kansas and how individual samples compare with the full range for all Dakota aquifer waters. The figures for this subsection and the next on relationships for minor constituents include all Dakota samples, whether single or multiple samples collected during different years from wells. The multiple samples were included because they sometimes show chemical changes due to the influence of variations in contamination.
Conductivity is one of the easiest measurements to make in the field or laboratory. The TDS concentration is generally very well correlated with specific conductance. Therefore, the conductivity of water is often determined and used as a measure of salinity. Plots of TDS and individual major constituent concentrations versus specific conductance can be used for estimating concentrations given a good measurement of specific conductance. The accuracy of the estimation depends on the accuracy of the conductance measurement, the error in the determinations of the constituent concentrations, and the scatter of points about the best-fit line. The scatter is greater at low conductances because the larger diversity of water types at low TDS concentrations results in different relationships between TDS and major dissolved constituent contents and conductance. At high TDS concentration, the water type is sodium-chloride and the contributions of constituents other than sodium and chloride are relatively small.
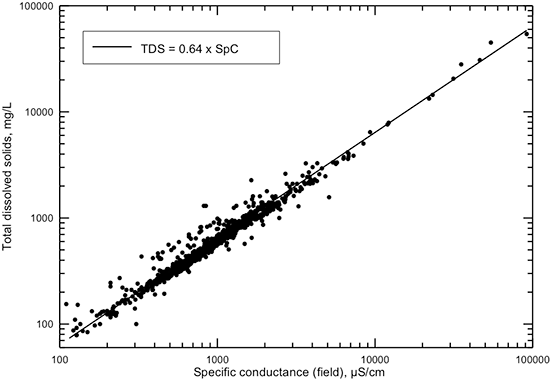
A plot of laboratory values of conductance versus TDS content (sum of measured constituents, fig. 3) based on the Dakota water-quality data base shows less scatter about a best-fit line than does a plot of field conductance versus TDS (fig. 4). This indicates the larger error in field compared to laboratory conductance measurements is due primarily to less controlled environmental conditions, especially temperature. The straight line through the data in fig. 3 is a best visual fit for a linear equation at both low and high TDS concentration ranges. The computed linear regression for all the data does not fit the data well at low conductances, whereas the best visual-fit line closely approximates the data across the whole conductance range. A third-degree polynomial computed as a best fit for the data gives a slightly better estimation of TDS content for the middle and high conductance ranges. A very simple relationship of 0.64 times the conductance fits the TDS versus field conductance data well (fig. 4). This relationship is essentially the same as for the linear equation for the laboratory conductance data and can be used for a good estimate of TDS from specific conductance values with low error. The simple 0.64 factor is also a visual best fit. As for the graph for TDS versus laboratory conductance, the computed linear regression for field conductance underestimates TDS at low conductance values.
Figure 3--TDS concentration versus specific conductance measured in the laboratory for Dakota aquifer waters. The polynomial function is a computed best fit for which the coefficient of determination (R2) is 0.997. The linear equation is a simple approximation visually fit to the data.
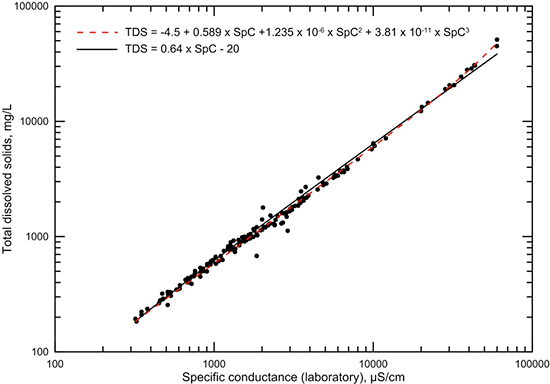
Figure 4--TDS concentration versus specific conductance measured in the field for Dakota aquifer waters. The linear function is a simple approximation visually fit to the data.
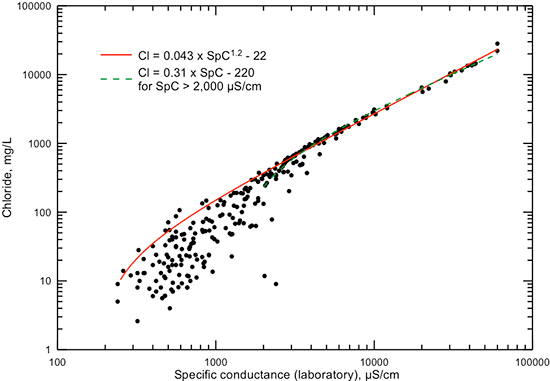
Specific conductance measurements also correlate very well with major constituent concentrations. A plot of chloride concentration versus laboratory conductance (fig. 5) shows that the correlation is much better at high concentrations and conductances than at low values. The diversity of chemical water types for fresh to slightly saline waters results in a wide range in chloride concentrations for a given value of low conductance. In saline waters, the contribution of chloride to the total anion content of a water is large and, along with sodium, predominantly controls the conductance value. As for the TDS and conductance relationship, a computed linear regression based on all of the data does not fit the points well in the lower conductance range. Thus, a visual best-fit based on a power equation was used in fig. 5 to better represent the range from slightly saline waters to saltwaters. It is a good estimator of chloride content at high conductances and for approximate values of maximum chloride for conductances below 4,000 µS/cm. The contribution of sulfate and bicarbonate ions to the total anionic content below 4,000 µS/cm increases substantially relative to chloride in many waters, thereby producing some waters with a higher conductance for a given chloride content than the equation predicts. The linear function on fig. 5 provides a simple relationship for estimating chloride concentration at conductance greater than 2,000 µS/cm.
Figure 5--Dissolved chloride concentration versus laboratory specific conductance for Dakota aquifer waters. The power function curve is a visual fit to the data to best represent the relationship at high conductance values and approximate the general maximum for chloride concentration at lower conductance. The linear equation is a simple function that approximates chloride concentration well at conductance greater than 2,000 µS/cm.
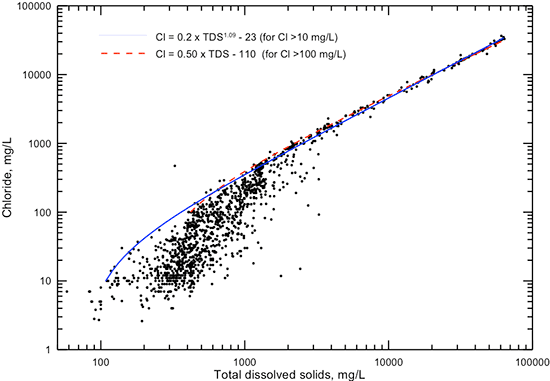
The distribution of points in a plot of chloride versus TDS concentration (fig. 6) is similar to that for chloride content and specific conductance (fig. 5). The TDS values used in this graph and subsequent graphs displaying TDS data are either the sum of measured constituents or measured TDS if there was not a complete analysis allowing the sum calculation. Figure 6 includes two lines that can be used to estimate TDS concentration from a chloride value, one a power function and the other a simple linear equation. Both the linear and power equations fit the data well for TDS values greater than 4,000 mg/L and chloride concentrations greater than 1,000 mg/L. In this range, the TDS concentration is approximately twice that of chloride. Below 1,000 mg/L chloride concentration, the power function estimates the lowest TDS for a given chloride or the highest chloride for a given TDS. The power equation is a good estimator of maximum chloride content down to about 10 mg/L. Similar to the explanation for the chloride-conductance relationship, other anions besides chloride can contribute a substantial portion of the total TDS below 3,000 mg/L. This results in a generally poor correlation between chloride and TDS concentrations in fresh to slightly saline waters in the Dakota aquifer.
Figure 6--Dissolved chloride versus TDS concentrations for Dakota aquifer waters. The equations relating chloride and TDS concentrations are for a general maximum chloride given a TDS value below 4,000 mg/L or a minimum TDS given a chloride value below 1,000 mg/L.
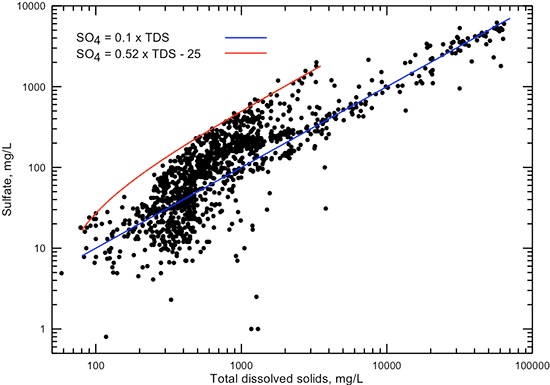
Figures 7 and 8 show the relationship of sulfate concentration with specific conductance and TDS content, respectively. Each of the figures displays a linear equation that approximates the general correlation of sulfate content with conductance and TDS, and another linear equation that generally represents the highest sulfate concentration found in Dakota aquifer water for conductances in the range 300-4,500 µS/cm and TDS in the range 100-3,500 mg/L. The points representing the maximum sulfate concentrations for given TDS values usually are for calcium-sulfate type waters that have derived most of their sulfate from gypsum dissolution or pyrite oxidation. The lowest sulfate concentration occurs in very fresh groundwaters or in parts of the confined aquifer where a chemically reducing environment has reduced most of the dissolved sulfate to sulfide.
Figure 7--Dissolved sulfate concentration versus laboratory specific conductance for Dakota aquifer waters. The linear functions displayed are visual fits to the general relationship between conductance and sulfate concentration and to the highest sulfate value generally found in waters with conductance in the range 300-4,500 µS/cm.
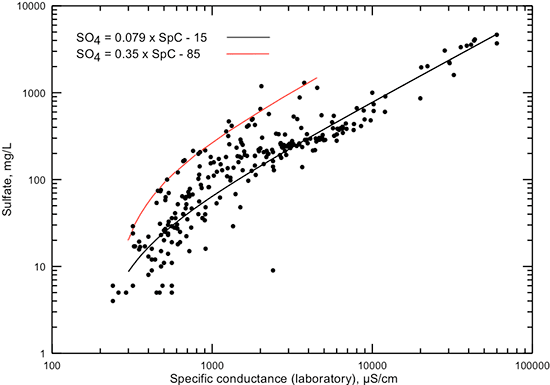
Figure 8--Dissolved sulfate versus TDS concentrations for Dakota aquifer waters. The linear functions displayed are visual fits to the general relationship between TDS and sulfate concentrations and to the highest sulfate value found in waters with TDS concentrations in the range 100-3,500 mg/L.
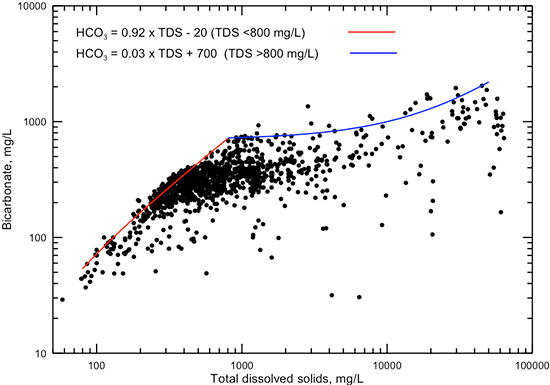
Bicarbonate contributes a substantial percentage of the total anions in fresh groundwaters but only a small percentage in saltwaters in the Dakota aquifer. This is reflected in the generally steady increase in the maximum bicarbonate concentration with specific conductance increase up to about 1,000 µS/cm (fig. 9) and with TDS concentration increase up to approximately 800 mg/L (fig. 10), followed by a smaller rate of increase in maximum bicarbonate for conductances greater than 1,000 µS/cm and TDS greater than 800 mg/L. The two lines in each of figs. 9 and 10 represent equations for the approximate maximum value of bicarbonate for the two ranges of conductances and TDS contents.
Figure 9--Dissolved bicarbonate concentration versus laboratory specific conductance for Dakota aquifer waters. The two linear functions displayed are visual fits representing the approximate maximum bicarbonate concentration for the conductance ranges below and above 1,000 µS/cm.
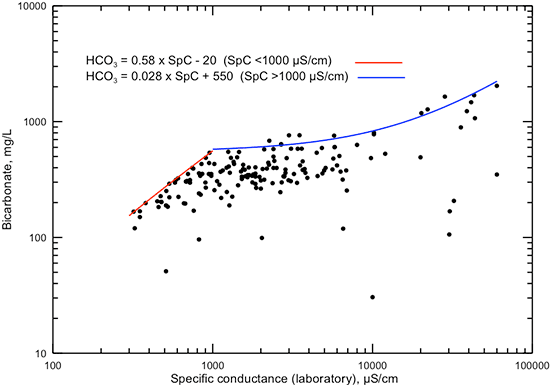
Figure 10--Dissolved bicarbonate versus TDS concentrations for Dakota aquifer waters. The two linear functions displayed are visual fits representing the approximate maximum bicarbonate concentration for the TDS concentration ranges below and above 800 mg/L.
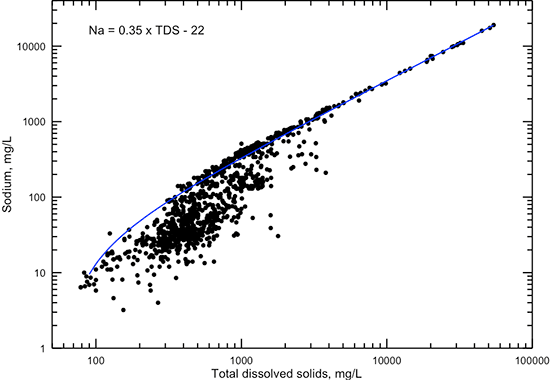
The correlations of sodium concentration with specific conductance and TDS content (figs. 11 and 12) are similar in pattern to those for chloride concentration. The linear equations fit the data very well for conductance greater than 5,000 µS/cm, TDS content greater than 3,000 mg/L, and sodium concentration greater than 1,000 mg/L, where the chemical water type is always sodium-chloride. Below these values, the equations estimate the maximum sodium content for given conductance and TDS values or the minimum TDS content for a given sodium value.
Figure 11--Dissolved sodium concentration versus laboratory specific conductance for Dakota aquifer waters. The linear function is a visual fit that represents the relationship well at conductance greater than 5,000 µS/cm and approximates the maximum sodium concentration at conductance less than 5,000 µS/cm.
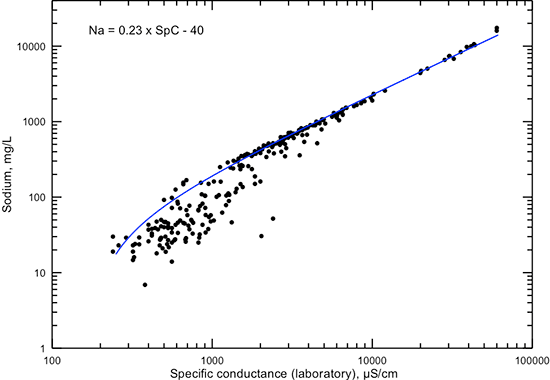
Figure 12--Dissolved sodium versus TDS concentrations for Dakota aquifer waters. The linear function is a visual fit that represents the relationship well at TDS content greater than 4,000 mg/L and approximates the maximum sodium concentration at TDS less than 4,000 µS/cm.
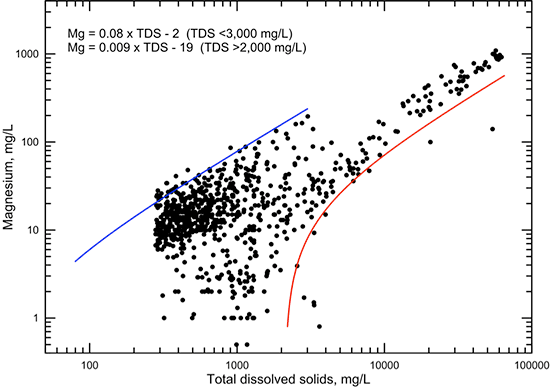
The correlations of calcium and magnesium concentrations with specific conductance (figs. 13 and 14, respectively) and with TDS content (figs. 15 and 16, respectively) are not as high as for sodium when all data are considered. In general, the plots for both of these cations show a distribution of points that are clustered in two groups. The graphs for the constituent versus TDS content display this better than for specific conductance because there are more data. The first group has calcium and magnesium concentrations that contribute a major part of TDS contents less than 4,000 mg/L. These waters are generally of calcium-bicarbonate to calcium, magnesium-bicarbonate type in the low range of TDS concentration (less than 500 mg/L), and transition to primarily calcium-sulfate along with some mixed cation-sulfate, calcium-chloride, and mixed cation-chloride types for TDS between 500 and 4,000 mg/L. The second group of waters has calcium and magnesium concentrations that are small relative to sodium content. In the low range of TDS values, these waters range from sodium-bicarbonate up to sodium-chloride type and have experienced substantial cation exchange. At high TDS content (greater than 5,000 mg/L), the waters are of sodium-chloride type and have a narrower range of calcium and magnesium concentrations than for lower TDS values. Figures 15 and 16 each include two lines representing linear equations that bracket the high and low concentration trends with conductance and TDS.
Figure 13--Dissolved calcium concentration versus laboratory specific conductance for Dakota aquifer waters. The linear function is a visual fit that represents the general maximum calcium concentration for conductance less than 5,000 µS/cm.
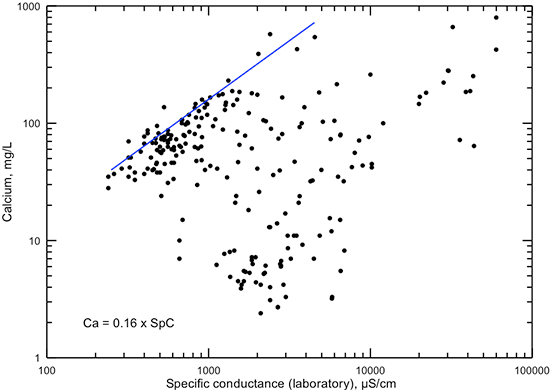
Figure 14--Dissolved magnesium concentration versus laboratory specific conductance for Dakota aquifer waters. The linear function is a visual fit that represents the general maximum magnesium concentration for conductance less than 4,000 µS/cm.
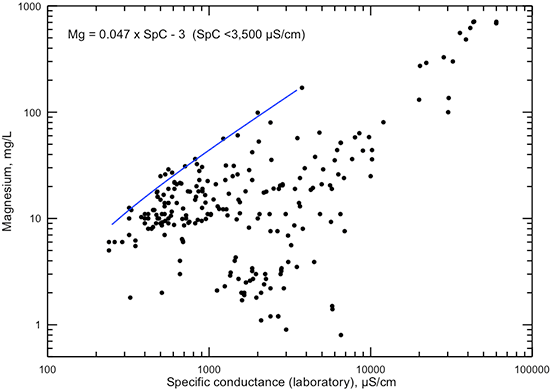
Figure 15--Dissolved calcium versus TDS concentrations for Dakota aquifer waters. The linear functions are visual fits that represent the general maximum and minimum calcium concentrations for low and high conductance values, respectively.
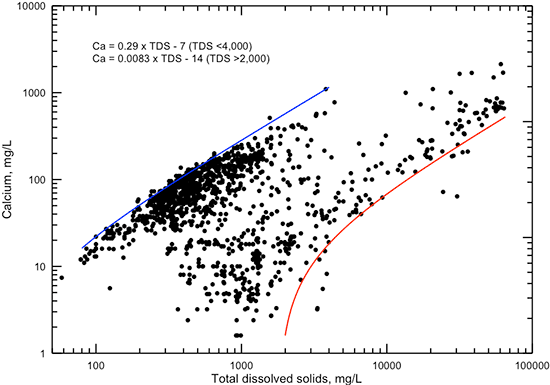
Figure 16--Dissolved magnesium versus TDS concentrations for Dakota aquifer waters. The linear functions are visual fits that represent the general maximum and minimum magnesium concentrations for low and high conductance values, respectively.
Dissolved silica concentration comprises more than several percent of the TDS content of many freshwaters in the Dakota aquifer. No significant correlation exists between silica and specific conductance or TDS concentration. In general, the greater the TDS content, the smaller is the silica proportion of the TDS content. Most groundwaters have a silica concentration in the 5-50 mg/L range. The greatest silica concentration typically occurs in waters with a TDS content between 250 and 1,500 mg/L.
Minor and Trace Dissolved Constituents
Infiltration of rainfall through soils and shallow bedrock dissolves small amounts of minor and trace inorganic constituents from soils and near-surface rocks. These substances are present in carbonate and clay minerals, coatings on quartz and other mineral grains, minor mineral grains, salts precipitated in soils during dry periods, and decomposing organic matter, or they are adsorbed on clays and other mineral surfaces. Infiltration of contaminants derived from anthropogenic activities can increase the concentrations of natural dissolved constituents (particularly nitrate) or add synthetic chemicals such as pesticides and other dissolved organic compounds to shallow Dakota waters. Table 6 lists typical ranges of minor and trace inorganic constituent concentrations in Dakota waters, and table 7 lists fluoride content for different chemical water types.
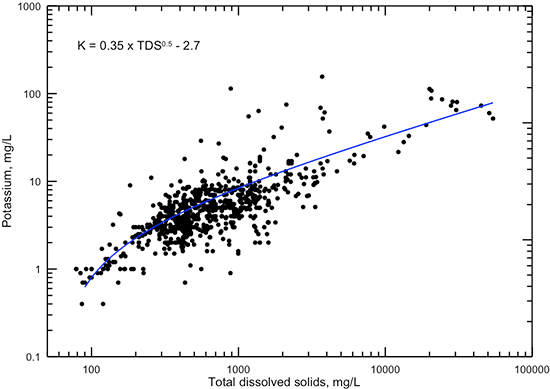
Potassium concentration is generally correlated with specific conductance and TDS content (figs. 17 and 18, respectively). The point patterns in these graphs do not have discernable groups as for calcium and magnesium but are more similar to those for sodium, although the relative distributions of points at high conductance and TDS values are not as narrow as for sodium. Simple power functions are shown on these figures that could be used to approximate potassium concentrations from conductance and TDS values. These functions fit the general pattern of points better for the range of fresh to saline water than computed best fits. Dissolved potassium concentrations are primarily controlled by the weathering of feldspar fragments in coarser sediments and by adsorption on and exchange with clays.
Figure 17--Dissolved potassium concentration versus laboratory specific conductance for Dakota aquifer waters. The power function displayed is a visual fit that represents the general data relationship better at both low and high conductance than a computed best-fit function.
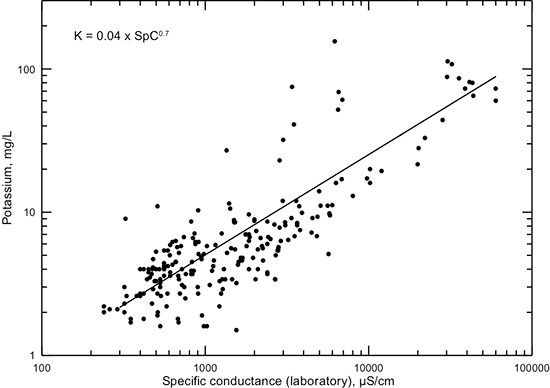
Figure 18--Dissolved potassium versus TDS concentrations for Dakota aquifer waters. The power function displayed is a visual fit that represents the general data relationship better at both low and high TDS content than a computed best-fit function.
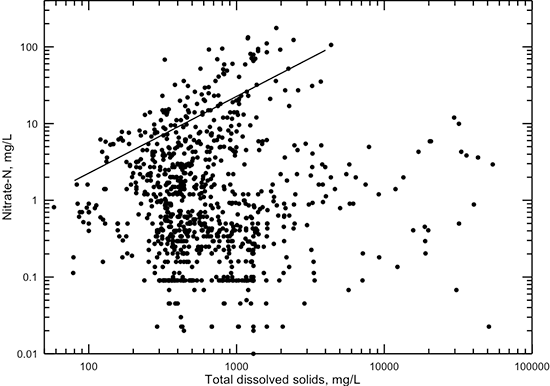
Nitrate is a minor constituent in Dakota groundwaters free of significant anthropogenic contamination. However, nitrate is a major constituent in some groundwaters (fig. 19). Nitrate is usually expressed as nitrate-nitrogen (NO3-N) for purposes of determining use of water for drinking. The line in fig. 19 represents a 10% contribution of nitrate, as it exists as a dissolved constituent (NO3) in water, to TDS content. No significant correlation exists between nitrate concentration and specific conductance or TDS content. Most of the Dakota groundwaters have a nitrate-nitrogen concentration between 0.1 and 100 mg/L. High nitrate contents (greater than 10 mg/L nitrate-nitrogen) typically occur in Dakota groundwaters with a TDS content between 250 and 3,000 mg/L. These are usually from surface contamination. The range in TDS content for high-nitrate waters typically represents fresh to slightly saline waters used for domestic, stock, or irrigation purposes. These waters are generally in shallower parts of the aquifer subject to local recharge or are confined waters contaminated by water flowing from the surface or near surface through the annular space of unsealed or poorly sealed wells.
Figure 19--Dissolved nitrate-nitrogen versus TDS concentrations for Dakota aquifer waters. Nitrate contributes more than 10% of the TDS content for waters represented by points above the line on the graph.
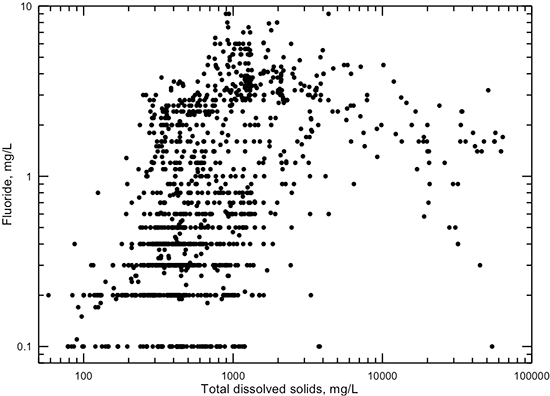
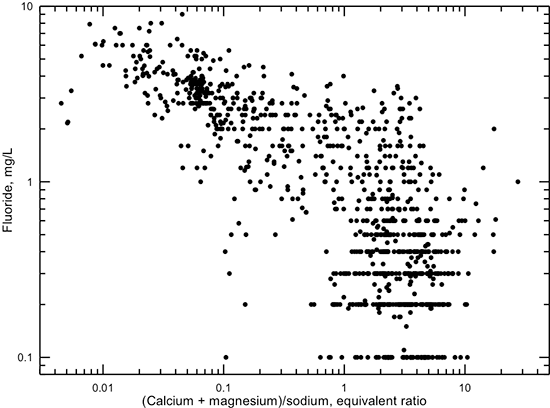
Fluoride concentration ranges between 0.1 and 10 mg/L in Dakota groundwaters (fig. 20). Although no significant correlation exists between fluoride content and specific conductance or TDS content, the maximum fluoride concentration for a given TDS value tends to increase with increasing TDS for freshwaters (less than 1,000 mg/L TDS). Low fluoride concentration (less than 1 mg/L) usually occurs in freshwaters of calcium-bicarbonate type. The greatest fluoride concentration occurs in waters with a TDS content between 600 and 4,000 mg/L. Elevated concentrations of dissolved fluoride (greater than 1 mg/L) are usually associated with sodium-bicarbonate and mixed cation-anion type waters. The high fluoride is probably derived from the dissolution of calcium minerals that contain fluoride. The relationship of dissolved fluoride and calcium in Dakota aquifer waters suggests that the mineral fluorite is the main control on fluoride concentration, although apatite minerals could be a minor control (see the discussion of fluoride in the subsection on regional groundwater geochemistry).
Figure 20--Dissolved fluoride versus TDS concentrations for Dakota aquifer waters.
Recharge of waters with a (calcium + magnesium)/sodium equivalent ratio greater than 1 to parts of the Dakota aquifer where this ratio is low on clays results in softening of the groundwater by exchange of calcium and magnesium from the water with sodium on the clay. The low (calcium + magnesium)/sodium ratio for adsorbed cations on clay is a remnant from when the water in the pores of the Dakota sediments contained saline water of sodium-chloride type. The exchange process decreases the calcium concentration, thereby producing conditions of undersaturation with respect to calcium-containing minerals in the sediments. Common minerals such as calcite and dolomite can dissolve, as can minor calcium minerals such as apatite, fluorite, and some micas that contain fluoride, thereby increasing the dissolved fluoride concentration. This is indicated by the general increase in fluoride concentration with decreasing (calcium + magnesium)/sodium ratio for Dakota groundwaters with fluoride greater than 1 mg/L (fig. 21). The dissolution of common carbonate minerals during the exchange process causes an increase in pH. Some fluoride that is adsorbed or weakly attached to clays can be released to solution in the higher pH waters by exchange with hydroxyl ion (OH-), thus further increasing the fluoride concentration of the groundwater.
Figure 21--Dissolved fluoride concentration versus (calcium + magnesium)/sodium equivalent ratio for Dakota aquifer waters.
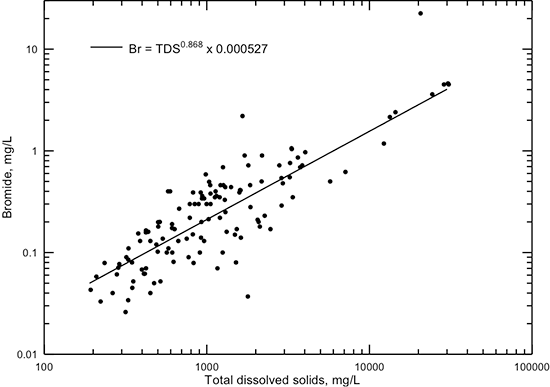
Bromide is a halide with similar properties as chloride and, with chloride, is one of the most conservative (least subject to chemical reactions) dissolved constituents in water. Bromide concentration ranges from less than 0.1 mg/L in very fresh groundwaters (less than 500 mg/L TDS) up to about 5 mg/L in the most saline groundwaters that naturally occur in the Dakota aquifer (fig. 22). The point representing the highest bromide in fig. 22 and the other point with the greatest deviation above the best-fit line are for contaminated groundwaters as explained in the next section. Although the bromide concentration increases with natural salinity in the aquifer water, the bromide/chloride ratio decreases substantially with increasing chloride concentration. The mass ratio of bromide/chloride in natural saltwaters (chloride content greater than 5,000 mg/L) in the Dakota aquifer ranges between 0.00015 and 0.0005. The bromide/chloride ratio for seawater is 0.00347, which is about an order of magnitude greater than observed in natural Dakota saltwaters. The bromide/chloride ratio of saltwater generated by the dissolution of Permian evaporite deposits containing rock salt in Kansas is within the range 0.00006-0.0003 (Whittemore, 1984, 1988, 1995). Thus, the primary source of bromide in saltwater in the Dakota aquifer is from the dissolution of rock salt and not from trapped seawater. Saltwater at a few locations in the Dakota aquifer has a bromide/chloride ratio exceeding 0.001. These waters have been contaminated by the past seepage of oil brine disposed at the surface into underlying Dakota groundwater or by the past injection of oil brine directly into portions of the aquifer containing natural saltwater, for example, in parts of Russell County. The use of the bromide/chloride ratio for saltwater source identification is described further in the subsection on contamination characterization later in this appendix.
Figure 22--Dissolved bromide versus TDS concentration for Dakota aquifer waters. The power function is a computed best fit for the data without the two points with the greatest deviations above the line, which represent samples of contaminated groundwater. The R2 for the best-fit function is 0.717.
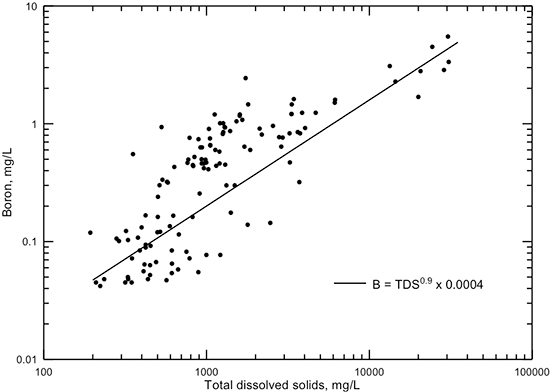
Like bromide, boron generally increases in concentration with increasing TDS content in Dakota groundwaters (fig. 23). The boron/chloride ratio also decreases with increasing salinity. The boron/chloride ratio for saltwater (chloride content greater than 5,000 mg/L) in the Dakota aquifer ranges between 0.00015 and 0.0006, a range nearly similar to that for bromide/chloride. The boron/chloride ratio for seawater is 0.00024, which lies within the range 0.00003-0.0005 for saltwaters generated by the dissolution of Permian evaporite deposits (Whittemore et al., 1981, and Whittemore, unpublished data). Thus, unlike the bromide/chloride ratio, the boron/chloride ratio cannot be used to clearly distinguish the origin of saltwater in the Dakota aquifer.
Figure 23--Dissolved boron versus TDS concentration for Dakota aquifer waters. The power function displayed is a visual fit that represents the general data relationship better at both low and high TDS content than a computed best-fit function.
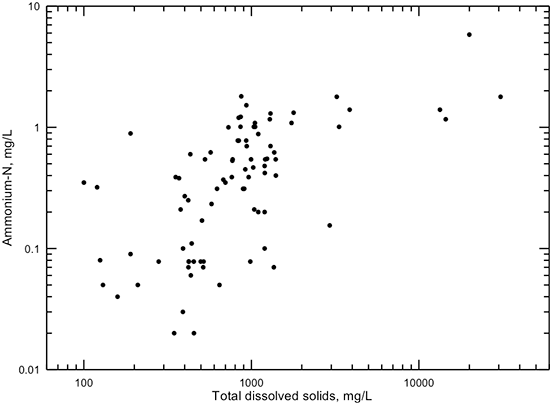
Chemically reducing environments occur where reactions of dissolved constituents and gases with other constituents and with the sediments have essentially completely consumed dissolved oxygen (O2). This commonly occurs in the confined portion of the Dakota aquifer because the age of the water is old and no recent recharge of water with significant dissolved oxygen has occurred. The reducing environment allows iron, manganese, and some other heavy metals to dissolve from minerals in the sediments. These waters can sometimes have a high enough hydrogen sulfide (H2S) content to give a "rotten egg" odor. Ammonium ion concentration can exceed 1 mg/L as ammonium-nitrogen in the reducing environment. Waters in the confined Dakota aquifer tend to have higher dissolved solids than in the unconfined, shallow portions of the aquifer. Thus, groundwater in which ammonium-nitrogen exceeds 1 mg/L tends to be slightly saline to saline (fig. 24). When ammonium ion concentration is definitely detectable (ammonium-nitrogen generally greater than 0.1 mg/L) in natural groundwaters with low oxidation-reduction potential, nitrate concentration is typically very low (nitrate-nitrogen less than 0.1). However, groundwaters with both ammonium-nitrogen concentration greater than a few tenths of a mg/L and nitrate-nitrogen greater than 1 mg/L do occasionally occur in the Dakota aquifer. These probably represent locations of surface sources of nitrogen contamination and groundwater conditions under which the nitrogen species are in the process of transformation from one oxidation state to another.
Figure 24--Dissolved ammonium-nitrogen versus TDS concentration for Dakota aquifer waters.
Dissolved concentrations of iron range from less than a few µg/L to more than 10 mg/L and of manganese range from less than a µg/L to nearly a mg/L in the Dakota aquifer. The greater concentrations occur in two types of environments. One occurrence is the chemically reducing environment described above. The other environment is in the outcrop or subcrop area of the Dakota aquifer where recharge with dissolved oxygen reaches strata containing pyrite. Oxidation of pyrite and other sulfides, which was discussed earlier as a source of sulfate, is also a source of dissolved iron and manganese in groundwaters. Such waters in the Dakota aquifer can have a pH below 7 (slightly acidic). Usually, enough alkalinity is derived from carbonate mineral dissolution in Dakota sediments to buffer the pH and keep it from falling below 6 in the groundwater. Most of the dissolved iron and manganese released from sulfide weathering oxidizes and precipitates as oxides and oxyhydroxides (hydrated oxides) that produce the red to orange to brown coloration commonly occurring in Dakota strata. If the pyrite weathering occurs in the confined portions of the Dakota aquifer where dissolved oxygen is limited, the dissolved iron and manganese concentrations can increase to relatively high values for these metals in groundwater.
Although trace metals are contained in a variety of natural substances, sulfide, oxide, and oxyhydroxide minerals are probably the main materials controlling the concentrations of heavy metals (e.g., cadmium, chromium, copper, lead, nickel [Ni], and zinc) and semimetals (e.g., arsenic and selenium) in Dakota groundwaters. Oxidation of sulfides and reduction of oxides and oxyhydroxides can release metals and semimetals within or adsorbed on minerals to the groundwater. Precipitation of these minerals and adsorption on their surfaces, especially on oxides and oxyhydroxides, removes trace and semimetals from solution. Adsorption on clays also can control the amount of trace ionic species in solution. Trace amounts of heavy and semimetals could also occur in small amounts of organic matter trapped in Dakota sediments where the organics were not completely oxidized after deposition with the sediments. Slow oxidation of these organics by recharge containing dissolved oxygen could release the trace constituents to solution. Surface contamination with relatively high concentrations of heavy and semimetals could also be a source of these substances in water at levels greater than usually expected. The general concentration ranges for selected heavy and semimetals in Dakota groundwaters are in table 6.
Naturally radioactive elements (e.g., uranium [U], thorium [Th], radium [Ra], and radon) are present at low levels in Dakota aquifer waters. Uranium can occur as oxide or silicate minerals and can be adsorbed on iron oxyhydroxides, organic matter, and clays in sediments (Langmuir, 1997). Oxidation of uranium-containing minerals and organic matter in sediments can release uranium to solution by oxidizing uranium from the IV to the VI oxidation state. Migration of this groundwater to a chemically reducing zone within an aquifer can then change the uranium to the reduced state, which is substantially less soluble than the oxidized state, and thereby precipitate uranium-containing minerals. Thus, the depositional, diagenetic, and hydrogeologic history of the Dakota sediments can result in zones where the uranium content of groundwater differs appreciably. Isotopes of uranium--primarily 238U but also 235U--decay radioactively to other radioactive elements, including thorium, radium, and radon. Uranium, thorium, and radium occur as ionic species or complexes dissolved in water, whereas radon occurs as a dissolved gas.
Characteristics of Contaminated Groundwater
This subsection focuses on concentrations of inorganic constituents introduced into Dakota groundwater by human activities. The KGS did not determine concentrations of organic compounds or microorganisms in groundwaters as part of the Dakota program primarily because the focus was on natural, inorganic constituents but also because the KGS laboratory was not equipped for these analyses and the expense of obtaining outside analyses was greater than the project budgets would allow.
The main constituent in Dakota groundwater that human activities have increased substantially in concentration is nitrate. Figure 19 shows that a substantial number of groundwater samples contained several or more mg/L of nitrate-nitrogen. Nitrate-nitrogen concentration greater than 3 mg/L is generally considered to be above that originally present in undisturbed Kansas groundwater (Townsend and Young, 1999). Another constituent elevated in some Kansas groundwater by human activities is chloride. The determination of the amount of chloride from anthropogenic sources in Dakota aquifer water is often difficult due to the large concentration that can come from natural sources. Selected chemical characteristics of waters can be used to assess the relative amounts from natural and human sources in some cases.
Human sources of nitrate include fertilizer and animal and human waste. Dissolved species of nitrogen from these sources can enter groundwaters by infiltration of water through the unsaturated zone to the water table or by water flowing down the boreholes of wells, especially if the annular space between the well casing and borehole is poorly sealed or not sealed. If contaminated water reaching the water table contained a high concentration of dissolved nitrogen species in the form of ammonium ion or nitrogen-containing organic compounds and if the water contained enough dissolved oxygen or other dissolved species that could oxidize the nitrogen, oxidation to nitrate in the groundwater system could occur.
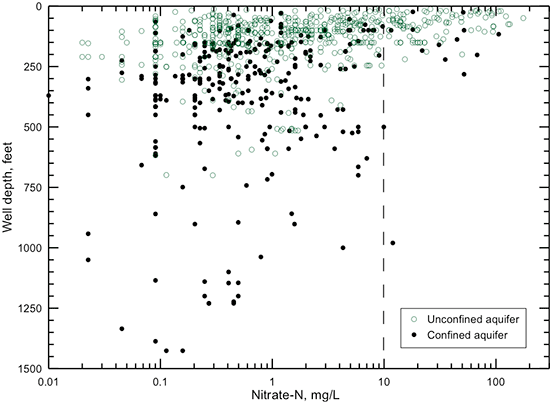
The occurrence of most high-nitrate waters (greater than several mg/L nitrate-nitrogen) at shallow depths in the unconfined portion of the Dakota aquifer (fig. 25) is consistent with a surface source of nitrate contamination. All water samples from wells with depths greater than 300 ft (91 m) in the unconfined aquifer contained nitrate-nitrogen less than several mg/L. Figure 25 indicates that several samples of groundwaters from the confined aquifer contained high nitrate content. It is probable, especially for wells with depths greater than 100 ft (30 m), that some water from the surface or shallow depths entered the aquifer through a poorly sealed or unsealed annular space of the wells, because the confining stratum immediately above the Dakota aquifer (Graneros Shale) should have a low enough permeability to substantially retard downward movement of contaminated water. The separation of the well locations in the water-quality data base into the unconfined (areas of Dakota outcrop and where alluvium and the HPA directly overlie the Dakota aquifer) and confined categories is based on the mapped division for these parts of the aquifer (fig. 1). If a well location for a sample fell on the confined part of the map but was approximately within one mile from the boundary, the well was included in the unconfined category because the overlying shale could have been thin and possibly fractured enough to allow some surface recharge less than a couple decades in age to reach the water table.
Figure 25--Depth of wells in the unconfined and confined parts of the Dakota aquifer versus nitrate-nitrogen concentration of well water. The nitrate-nitrogen concentration limit (maximum contaminant level) for public supplies of drinking water is 10 mg/L (indicated by dashed line).
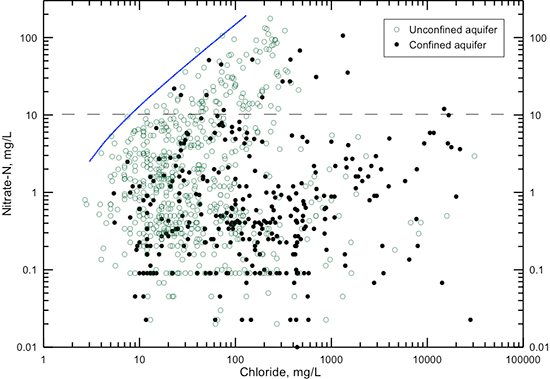
Animal and human waste sources of nitrate are associated with other constituents, such as in the saline water of urine. Some septic system wastes can contain saline water discharged from conventional water softeners in which rock salt is used to recharge the exchange medium. A plot of nitrate versus chloride concentration (fig. 26) indicates that nitrate tends to increase with increasing chloride content for nitrate-nitrogen values greater than 10 mg/L (the maximum contaminant level for public supplies of drinking water). The solid line on fig. 26 indicates that a lower limit to chloride concentration occurs in waters with greater than a few mg/L nitrate-nitrogen. Low nitrate concentration can occur at low chloride values, but once the nitrate increases above natural levels, enough chloride is associated with the nitrate that chloride concentration increases with nitrate increase. The slope of the upper limiting line in fig. 26 suggests that for every 10 mg/L increase in nitrate-nitrogen, chloride content increases about 6-7 mg/L.
Figure 26--Nitrate-nitrogen versus chloride concentration in groundwaters in the confined and unconfined Dakota aquifer. The solid line indicates a general lower limit of chloride concentration that occurs in waters with greater than a few mg/L nitrate-nitrogen. The dashed line is the maximum contaminant level for nitrate-nitrogen.
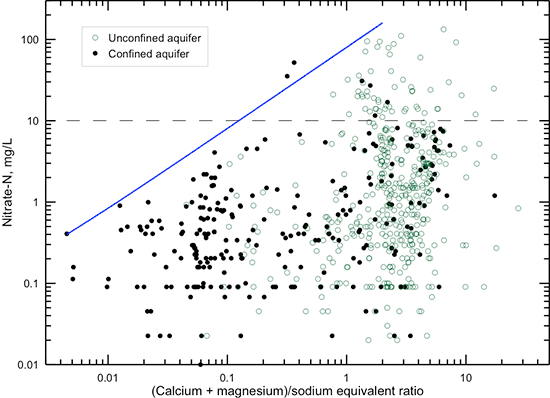
The solid line in fig. 27 indicates that a general upper limit for the sodium/chloride ratio exists for a given nitrate concentration greater than 1 mg/L nitrate-nitrogen. The maximum sodium/chloride ratio decreases as the nitrate content increases. The solid line in fig. 28 shows that a general lower limit for the (calcium + magnesium)/sodium ratio occurs for a given nitrate content. With increasing nitrate concentration, the minimum ratio increases. Part of this chemical relationship is controlled by the fact that groundwater in the confined aquifer can often have a low (calcium + magnesium)/sodium ratio due to cation exchange processes, and nitrate contamination in the confined aquifer is less common than in the unconfined aquifer. However, part of the relationship is related to the cation content associated with chloride and other anions, including nitrate, in the contamination source water that mixes with the natural groundwater, coupled with cation exchange of sodium in the contaminated water for calcium and magnesium on clays in the aquifer sediments and overlying soils and rocks during contaminant transport.
Figure 27--Nitrate-nitrogen concentration versus sodium/chloride mass ratio in groundwaters in the confined and unconfined Dakota aquifer. The solid line indicates the general upper limit of the sodium/chloride ratio that occurs in waters with greater than 1 mg/L nitrate-nitrogen. The dashed line is the maximum contaminant level for nitrate-nitrogen.
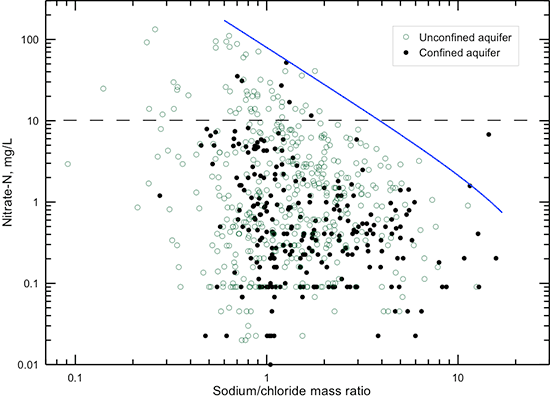
Figure 28--Nitrate-nitrogen concentration versus (calcium + magnesium)/sodium equivalent ratio in groundwaters in the confined and unconfined Dakota aquifer. The solid line indicates the general lower limit of the (calcium + magnesium)/sodium ratio that occurs in waters with greater than 1 mg/L nitrate-nitrogen. The dashed line is the maximum contaminant level for nitrate-nitrogen.
The use of a bromide/chloride versus chloride concentration plot with conservative mixing curves is often the best approach for geochemical differentiation of anthropogenic sources of chloride contamination from natural salinity (Whittemore, 1995). Figure 29 displays the bromide/chloride mass ratio versus chloride concentration for Dakota groundwaters. All of the sample data appearing in the graph are from the Dakota program. Each of the three curves in the figure represents the conservative (without reaction) mixing of two end-member waters, one with a lower chloride and one with a higher chloride concentration. The mixing equation is
Cmix = C1V + C2(1-V)
where Cmix, C1, and C2 represent concentrations of either bromide or chloride in the mixture and the two end members, respectively, and V represents the volume fraction of the first end-member water. The two solid curves bound a zone of mixing between freshwater and natural saltwater in the Dakota aquifer. The end-member values used to generate the curves are selected such that the curves bound all of the sample points that fall within the general trend of decreasing bromide/chloride ratio with increasing chloride concentration. Two sample points representing groundwater from the confined aquifer fall outside the mixing zone in fig. 29. The point with the greater chloride concentration of the two represents a water sample collected from an observation well drilled as part of the Dakota program into the Cheyenne Sandstone at Gorham in Russell County (Macfarlane et al., 1988).
Figure 29--Bromide/chloride mass ratio versus chloride concentration in groundwaters in the confined and unconfined Dakota aquifer. The two solid lines are mixing curves that bound the zone of mixing of freshwaters with natural saltwaters in the Dakota aquifer. The dashed line is a curve for the mixing of water sampled from the KGS observation well screened in the Cheyenne Sandstone at Gorham in Russell County with brine from a nearby oil well; the curve was extended to a lower chloride concentration in the middle of the zone representing the mixing of freshwater and natural saltwater in the Dakota aquifer.
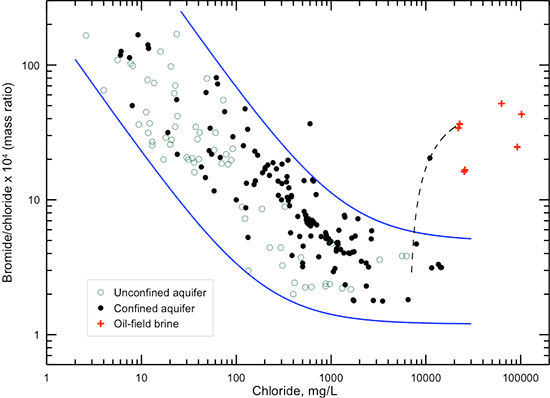
Frye and Brazil (1943) reported that in selected early years of oil fields in Russell and Ellis counties, some waste brine produced from the oil-bearing formations was disposed of in wells drilled into lower Cretaceous sandstone as well as in deeper formations and in surface pits. The KGS sampled brines produced from oil wells in Barton, Ellis, Rush, and Russell counties during the Dakota program (Macfarlane et al., 1988); points for these samples are also plotted in fig. 29. The chemistry of the water in the Cheyenne Sandstone at Gorham fits a mixture of oil brine with natural saltwater in the sandstone. The dashed curve in fig. 29 represents the mixing of oil brine with natural saltwater in the Dakota aquifer. The upper part of the dashed line was generated by using the chemistry of the water sampled from the Cheyenne Sandstone as one end member and a brine produced from an oil well in the Arbuckle Group located in the same quarter section as the Cheyenne observation well as the other end member. The curve was then extrapolated to a lower chloride concentration such that it ends in the middle of the zone representing the mixing of freshwater and natural saltwater in the Dakota aquifer. The chloride concentration of the uncontaminated saline water in the Dakota aquifer at this location is predicted to have been about 7,000 mg/L based on the mixing curve. The oil brine sampled at Gorham contained a chloride concentration of only 22,700 mg/L. Other brines in the Arbuckle Group in central Kansas often contain a substantially greater chloride content. If the oil brine at the Gorham location had been diluted by fresh to slightly saline water as a part of secondary recovery operations, its bromide/chloride ratio would not have changed substantially. If the same bromide/chloride ratio as the sampled brine were used along with a chloride concentration of about 80,000 mg/L for the oil-brine end point for the dashed curve, the predicted chloride concentration for the uncontaminated saline water in the Cheyenne Sandstone (at the low bromide/chloride end of the dashed curve) would be somewhat less than 6,000 mg/L. Thus, the original chloride content in the Cheyenne Sandstone at this location was probably in the range of 6,000 to 7,000 mg/L.
The other point falling outside the mixing zone on fig. 29 is for a well in the Dakota aquifer several miles west of La Crosse in Rush County. Although it is not within an oil field, dry and abandoned wells were drilled in the general area. The well is located relatively close to a rail line. The specific cause for the higher bromide/chloride ratio is unknown but chemically fits the addition of a small amount of saltwater with a composition similar to oil brine. The expected chloride concentration for the Dakota aquifer in the area is less than the 600 mg/L observed in the sample. For example, a somewhat deeper well in the Dakota aquifer at La Crosse that was sampled in the same week contained a chloride content of 345 mg/L.
Many more records with major constituent data exist for groundwaters from the Dakota aquifer than for samples in which the KGS measured bromide and chloride concentrations. Another ratio that is often of value for differentiating saltwater sources is sulfate/chloride. Figure 30 displays points for Dakota aquifer waters (both non-KGS and KGS analyses) on a plot of sulfate/chloride mass ratio versus chloride concentration. The figure includes two mixing curves that bound a zone in which nearly all the points for the Dakota aquifer waters fall. A few points, such as those with the lowest sulfate/chloride ratios, represent groundwaters in the confined aquifer that have naturally become chemically reducing enough to reduce some sulfate to sulfide. Oil brines in Kansas generally have relatively low sulfate/chloride ratios (nearly always less than 0.2 and usually less than 0.02). The usual range in the sulfate/chloride ratio for oil brine partially overlaps that for natural saltwaters in the Dakota aquifer. However, if a water was substantially contaminated by an oil brine with a low enough sulfate/chloride ratio, a low ratio and a higher chloride concentration than expected for the Dakota groundwater at that location and depth could signal possible brine contamination. The point at a chloride value of 2,300 mg/L and sulfate/chloride ratio of 0.0135 on fig. 30 represents an example of expected oil-brine pollution. The well from which the sample was collected in 1971 was 75 ft (23 m) deep, and the expected chloride content of the Dakota aquifer in the area is in the range of 100 to 250 mg/L. The well location (T. 19 S., R. 10 W., Sec. 33, western Rice County) was within the central part of the large Chase-Silica oil field that extends from eastern Barton to western Rice County.
Figure 30--Sulfate/chloride mass ratio versus chloride concentration in groundwaters in the confined and unconfined Dakota aquifer. The two solid lines are mixing curves that bound the zone of mixing of freshwaters with most natural saltwaters in the Dakota aquifer.
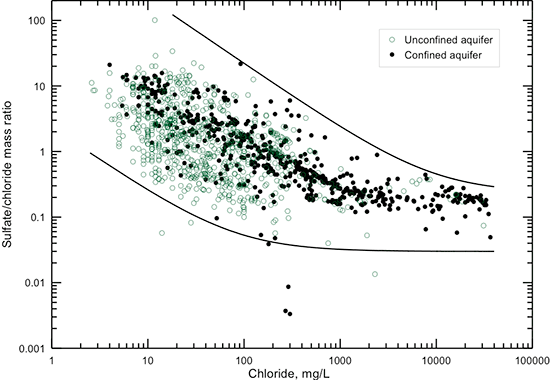
Sodium/chloride ratios have sometimes been used to differentiate oil-brine pollution from natural saltwater because oil brines in Kansas usually have lower ratios than for Permian salt-dissolution brine. The sodium/chloride mass ratio of natural saltwater with chloride concentration greater than 10,000 mg/L in the Dakota aquifer is usually in the range 0.6-0.8 (fig. 31). The sodium/chloride mass ratio for the dissolution of rock salt is 0.65. The sodium/chloride ratio for Kansas oil brines is usually within the range 0.4-0.6. Although this difference can sometimes be enough to help discern the presence of oil brine contribution to chloride, cation exchange affecting a saltwater plume generally decreases the sodium/chloride ratio a substantial amount, making the difference even larger. When a saltwater plume enters a sedimentary aquifer containing groundwater with a substantially lower salinity, the sodium/chloride ratio in the water decreases because the sodium exchanges for divalent cations (primarily calcium and magnesium) on clays in the sediments. This causes an increase in the dissolved calcium and magnesium content, thereby hardening the water.
Figure 31--Sodium/chloride mass ratio versus chloride concentration in groundwaters in the confined and unconfined Dakota aquifer. The two solid lines are conservative mixing curves that bound the zone of mixing of freshwaters with natural saltwaters in the Dakota aquifer.
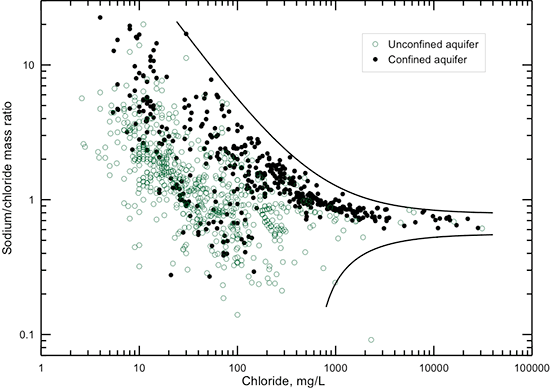
The lines in fig. 31 are conservative mixing curves. They were generated using end members such that the resulting mixing curves provide approximate boundaries for the limits in the range of the sodium/chloride ratio for saline Dakota water. A point that falls substantially above or below the boundary would represent water that appears to be anomalous compared to natural groundwater in the Dakota aquifer. One such point occurs on fig. 31 at a chloride concentration of 2,300 mg/L and a sodium/chloride mass ratio of 0.091. This point represents the same water sample discussed above in the paragraph on the sulfate/chloride ratio as an indicator of oil-brine pollution. As indicated above, the chemistry of the high-chloride water sampled from the Dakota aquifer in western Rice County within the Chase-Silica oil field fits oil-brine pollution.
Prev Page--Well Location and Percent Dakota Yield || Next Page--Groundwater Geochemistry, continued
Kansas Geological Survey, Geohydrology
Placed on web Feb. 6, 2015.
Comments to webadmin@kgs.ku.edu
The URL for this page is http://www.kgs.ku.edu/Publications/Bulletins/260/app_chem.html