Previous--Water Chemistry and Sustainable Yield || Next--Effects of Agriculture on Water Yield in Kansas
This article available as an Acrobat PDF file (199 kb).
Yield is used to characterize the capacity of a water resource to serve as a long-term water supply. It is a fundamental water-supply planning concept, and an understanding of its attributes is critical for those who participate in water-supply issues. In the context of surface-water resources, yield is often synonymous with safe yield or firm yield. Safe yield or firm yield in the context of water reservoirs is defined as the maximum quantity of water which can be guaranteed during a critical dry period (Linsley and Franzini, 1979). The simplicity of this definition, however, belies two "complicating" factors. First, yield changes as watershed conditions, such as land use and ground-water-surface-water interactions, evolve. Second, yield is uncertain because of our inability to know the severity and duration of future drought periods. This chapter discusses the dynamic nature of yield. In particular, using Kansas surface-water resources as the example, this chapter describes the concept of yield, the determination of yield, the sensitivity of yield to underlying assumptions, and the interaction of yield and water-supply policy.
Surface-water yield depends primarily on inflows and storage. In the case of an unregulated stream, the firm yield is often conceptualized as the minimum historical flow during a specified time period. With this working definition, the firm yields at several locations along Kansas streams are given in table 6.1. In most cases, these minimum daily historical flows occurred prior to significant regulation by large reservoirs.
Table 6.1--Simple daily firm yield at select locations.
| Location | Stream | Firm Yield, cfs | Period of Record |
|---|---|---|---|
| Topeka | Kansas River | 170 | 1917-1994 |
| Enterprise | Smoky Hill River | 38 | 1935-1994 |
| Wichita | Arkansas River | 5 | 1935-1994 |
| Ottawa | Marais Des Cygnes | 0 | 1902-1994 |
| Iola | Neosho River | 0 | 1899-1994 |
Two major assumptions are implicit to determining yield in this fashion. The first assumption is that the available streamflow record adequately captures the longterm streamflow characteristics of the basin. This is often not valid, even in the rare instances where good-quality long-term streamflow records are available. For example, the Great Plains droughts circa 1757 and 1860 were probably harsher than those seen so far in the twentieth century (Stockton and Meko, 1983). The second assumption is that streamflow regimes are stationary. However, watersheds evolve in response to stresses such as altered land-use practices and changing ground-water–surface-water interactions. Over a time scale of decades, these transformations can have a significant impact (Koelliker et al., 1995). The typical result in semi-arid nonurban regions is less runoff per unit of rainfall. Thus, it is highly unlikely that a sequence of streamflows (and firm yield) from the 1930's would repeat in the 1990's, even in response to identical climatic factors.
In addition, a major change in firm yield at a site can occur when reservoir storage is placed upstream. When water-supply reservoir storage is added on a stream, additional water is lost from the river system due to increased evaporation from the exposed reservoir surface area. Paradoxically, the firm yield of the river-reservoir system increases. This increase in firm yield and the corresponding decrease in average yield are fundamental impacts of a water-supply reservoir. The gain in firm yield often has vital importance and value. The loss of average yield is usually unimportant.
Referring back to table 6.1, the firm yield of the Neosho River at lola would be on the order of 50 cubic feet per second (cfs [1.4 m3/s]), if the full conservation storage capacity of John Redmond Reservoir were dedicated to maximizing downstream firm yield. This is in spite of the fact that John Redmond Reservoir has a surface area of approximately 10,000 acres (4,047 ha) and can have a net evaporative loss of 25,000 acre-feet (30.8x10⁶ m3) in a dry year. Similarly, the firm yield of the Kansas River at Topeka would be on the order of 700 cfs (19.8 m3/s) if the full conservation-storage capacities of Milford Reservoir and Tuttle Creek Reservoir were dedicated to maximizing downstream firm yield.
A concept that is closely related to firm yield is that of reliability. Reliability, as applied to a reservoir, is defined as the probability that a reservoir will deliver the expected demand throughout its lifetime without incurring a deficiency (Linsley and Franzini, 1979). The reliability approach avoids the difficulties associated with depending directly on the historical record by using a stochastic methodology. The reliability approach has much merit, but also entails the use of probabilistic descriptions and stochastic data-generation techniques. These methods, as well as many others for determining yield, are discussed in McMahon and Mein (1978). Still other approaches to reservoir yield can be found in Sheer (1980) and Smith (1993).
Lastly, although yield might appear to be wholly a water-supply concept, it is closely related to water quality. In fact, there is often a direct trade-off between yield and water quality. This is evident in California, where 5 million acre-feet (6.17 km3) per year, on average, is expended to San Francisco Bay in order to control ocean-derived salinity in the Sacramento-San Joaquin Delta (California Department of Water Resources, 1987). This outflow protects the quality of water that is exported south of the delta and also provides significant environmental and public-trust benefits. From a purely water-supply perspective, however, these benefits are realized by foregoing some yield.
In Kansas, portions of several major rivers are subject to high-salinity levels that can inhibit the use of water for supply purposes. The release of lower-salinity water stored in reservoirs for blending purposes is one option for managing these salinity episodes (U.S. Army Corps of Engineers, 1982). However, stored water that is dedicated to managing salinity is not available to augment low flows, thus potentially diminishing the firm yield of the system. A quantitative description of a relationship between yield and salinity is described in Wurbs et al. (1995).
Kansas statutes refer to yield in several instances. Two important references are found in the State Water Plan Storage Act. The first describes the quantity of water that the State may reserve to store in a reservoir (known as a water-reservation right) as:
"… an amount sufficient to insure a yield of water from the reservoir for beneficial use through a drought with a 2% chance of occurrence in any one year with the reservoir in operation" (K.S.A.82a-1303).
The same Act also specifies the yield that may be contracted by the State:
"… the director shall not contract for withdrawals of water from a particular reservoir which in the director's opinion are in excess of the yield capability from the conservation storage water supply capacity in such reservoir committed to the state computed to provide water through a drought having a 2% chance of occurrence in anyone year with the reservoir in operation" (K.S.A. 82a-1305).
Definitions for some yield terminology can be found in the Kansas Administrative Regulations:
"Drought having a 2% chance of occurrence in anyone year" means a drought having a statistical chance of occurring once every 50 years, on average (K.A.R. 98-5-1f).
"Reservoir Yield" means the quantity of water which can be withdrawn from storage in the reservoir. Reservoir yield is determined by the rate of flow of the stream into the reservoir, losses due to evapotranspiration from the reservoir surface, and the volume of water impounded in the reservoir (K.A.R. 98-5-1k). "Yield" means the quantity of water which can be withdrawn from storage in a reservoir for a given period of time (K.A.R. 98-6-1q).
Based on these citations, the yield in the statutes and regulations is clearly a firm yield, with the critical dry period being defined probabilistically as the 2% chance drought. Although the term drought can refer to a shortage of precipitation, soil moisture, or streamflow (Dracup et al., 1980), it can be inferred that the statutes are concerned with a streamflow deficiency. Furthermore, although a duration is not explicitly stated, it also can be inferred that the statutes are referring to an annual drought. Thus, statutory yield is succinctly and adequately defined.
Vagaries arise, however, in going from a well-defined, useful concept to a quantitative implementation of that concept. This is true in many instances, whether in economics (e.g., determining the money supply), demographics (e.g., taking the census), or college football (e.g., determining the national rankings). All depend on assumptions and limited data. In all cases, including yield, no definitive methodology will result in assigning perfectly accurate numbers to the concept. Nonetheless, the necessity of quantifying the concept requires that a workable methodology is implemented.
Two approaches have been used to determine yield from Kansas reservoirs. The Kansas Water Resources Board used a statistical method (Peck, 1984). This methodology was based primarily on statistics of historical data and extrapolations from that data. As such, it was subject to all the benefits and drawbacks of relying on recorded data, statistical techniques, and extrapolation.
The Kansas Water Office has implemented a mass-balance, reservoir-operations methodology. The administrative-policy statement that describes this methodology has several important aspects. First, the policy states that its goal is to pragmatically and consistently administer the State Water Plan Storage Act. Second, it asserts that the statutorily defined drought with a 2% chance of occurrence in anyone year occurred within the 1952-57 drought period. Third, the policy describes the mass-balance, operations-study methodology that will be used to compute yield. Lastly, the policy recognizes that yield determinations are subject to revision as additional data become available. The key assumption is the assertion that the 2% drought can be represented by the 1952-57 period. This is particularly useful for planning purposes because people either remember the 1952-57 drought or can get a sense of it based on recorded hydrologic, climatic, and other records. For many regions of the state, it was the worst extended drought in the past 50 years. In a simplistic sense, this gives some credence to idea that is was a 2% drought. The main drawback of this assumption is that the 1952-57 drought, like any sequence of historical flows, will not repeat in the future. Therefore, a yield during the "next" 2% drought will differ from a yield based on the 1952-57 drought. There is no absolutely correct method for implementing the Kansas statutory definition of yield. The Kansas Water Office methodology is thought to define a pragmatic, consistent, and reasonable approach.
Reservoir yields are often determined by operations studies. Operations studies are simulations of the physical systems based on the principle of conservation of mass. A generalized mass balance equation for a single-purpose water-supply reservoir is:
BSTOR + IN + PREC - EVAP - SEEP - REL = ESTOR (eq. 6.1)
where:
BSTOR = storage at beginning of period
IN = storable inflow during time period
PREC = precipitation on reservoir surface during time period
EVAP = evaporation from reservoir surface during time period
SEEP = seepage loss during time period
REL = release during time period
ESTOR = storage at end of time period
The key variables in an operations study are hydrologic (inflows, seepage losses), climatic (precipitation, evaporation), physical (elevation-area-capacity relationship), and operational (release rules). The key parameters in an operations study are the simulation period, the simulation time step, and the level of development. Taken together, these variables and parameters define an operations study.
Inflows are often developed from historical measured data, with the historical record adjusted to account for spatial and temporal factors. Spatial adjustments are necessary if the drainage area that contributes to the recording gage(s) differs significantly from the drainage area that contributes to the reservoir. Temporal adjustments are necessary if the watershed conditions, in particular the rainfall-runoff relationship or ground-water–surface-water interaction, have changed since the historical flows were recorded. This temporal adjustment attempts to determine the inflow series that would have resulted from a repeat of the historical climatic conditions on the watershed of a given year specified by the level of development. In most cases, it entails a reduction of the historical flows and is referred to as a depletions analysis. Boxed section 6.1 summarizes this type of analysis for the inflows to a north-central Kansas reservoir.
Inflows must also be adjusted for institutional factors such as water rights. For example, in an appropriation doctrine state such as Kansas, reservoir inflows are subject to bypass requirements for downstream senior water-right holders. The reservoir storage space itself may require a water right in order to store water. The terms, conditions, and limitations of relevant water rights must be considered in the yield analysis.
Reservoir seepage losses can be determined as a function of the beginning storage or considered a constant loss per time period. A percentage of the seepage losses may enter the river and be considered to comprise a portion of a minimum reservoir release requirement.
Climatic inputs are taken from weather-station data. The overall adequacy of the climatic data, in particular the density of the weather data, can have a marked impact on results (Linsley et al., 1975). In addition, spatial averaging of the available climatic data is required. The choice of which of the available data to use and the method of averaging the data can also have a large impact on results (Curtis et al., 1994).
Key operational data include the reservoir capacity at the level of development. Reservoir capacity decreases with time due to sediments carried by the inflows that are deposited and trapped by the impoundment. The prediction of the sediment load to a reservoir is subject to large errors (Singh, 1992). Furthermore, the deposition and transport of sediments within a reservoir is also problematic. Sediment surveys, which are measurements of the reservoir capacity at a given instant in time, are conducted periodically. The reservoir capacity at the level of development of interest is determined by interpolating, or extrapolating, from the measured sediment survey data.
Release is the dependent variable. The firm yield of the river-reservoir system would be the maximum constant release that could be sustained in each and every time period. It can be determined by either optimizing or iteratively simulating the operations of the system.
Because yield is a function of time, the level of development specifies the point in time for which a yield is desired. The level of development is governed by the planning or contracting horizon, which can be 40 years or longer for a water-resources project. Inputs that must be adjusted to correspond with the level of development are the inflows, which are affected by altered rainfall-runoff or ground-water-surface-water interactions, and reservoir capacity, which is affected by sedimentation. Typically, climatic factors are assumed stationary. Accounting for trends in climatic factors may become more common as climate analysis improves, especially if a very extended planning horizon is used.
The simulation period is usually one or more critical historical drought periods. Operations studies with other goals, such as determination of an average yield, may use the entire available historical record. If critical periods are used, the status of reservoir storage at the beginning of the simulation is important. The firm yield will be highly correlated to the initial reservoir storage in systems where the ratio of reservoir storage to inflow is large.
The time step specifies the temporal scale for which results are of interest. Time steps range typically from annual to hourly. Annual, monthly, and weekly time steps are common for water-supply studies. Weekly, daily, and hourly studies are common for flood control and hydropower studies. Firm yield results depend on the time step. With everything else being equal, longer time steps result in larger firm yields due to averaging over critical periods.
The mass balance approach toward firm yield can provide very precise results, but accuracy is limited by input data and assumptions. The largest sources of inaccuracies are the lack of knowledge of critical period inflows and reservoir capacity, as adjusted for the level of development, and the scarcity of climatic data. Thus, even for the case of an overly simplified reservoir, the firm yield determination depends on some key assumptions and data limitations.
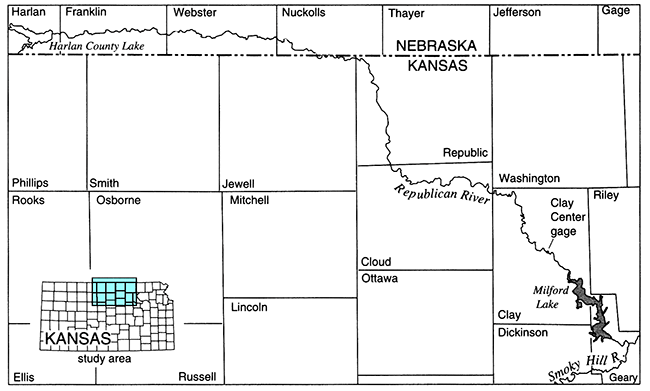
In order to give a sense of the modifications to the historical record that must be contemplated, we present an example pertaining to Milford Reservoir and the Republican River basin. Milford Reservoir is located in north-central Kansas on the Republican River upstream of Junction City (fig. B6.1.1). It has a design conservation capacity of 300,000 acre-feet (0.37 km3) and a design flood-control capacity of 700,000 acre-feet (0.86 km3), It was placed in service in 1967.
The U.S. Geological Survey (USGS) has maintained a streamflow gage on the Republican River at Clay Center, which is approximately 30 mi (48 km) upstream of Milford Dam, since 1917. Thus, daily flow records of the 1952-57 drought are available. The Clay Center gage has a drainage area of approximately 24,542 mi2 (6.36x10⁶ ha). Milford Dam has a drainage area of approximately 24,880 2 (6.44x10⁶ ha). The USGS has determined that approximately 7,500 2 (1.94x10⁶ ha) of this region is noncontributing.
The following checklist presents some of the adjustments that might be made to the observed 1950's Clay Center flows in order to account for spatial (i.e. because the gage does not measure all inflows to Milford Reservoir) and temporal (i.e. because the changing conditions have altered the rainfall-runoff relationship in the watershed since the measured 1950's flows) factors.
The spatial factors suggest that Milford inflows are 1.01 to 1.10 times the measured Clay Center flows. The temporal factors suggest that, under current watershed conditions, the Clay Center flows would be approximately 0.4 to 0.5 of the observed historic 1952-57 flows (KWO, 1996). Because yields depend significantly on inflow, the decisions regarding these factors will have a major impact on the yield determination.
Figure B6.1.1--Milford Lake (modified from map by Kansas Water Office).
Most large reservoirs are jointly operated facilities that serve multiple purposes. A simple multiple-purpose reservoir may have a conservation (water-supply) capacity and a flood-control capacity sharing the same facility. These capacities are segmented by elevation; that is, the conservation capacity is composed of storage below a specified boundary elevation whereas the flood-control capacity is composed of storage above the boundary elevation. For some facilities, the boundary elevation changes on a regular annual cycle.
In many cases, the conservation storage is further partitioned in order to serve multiple purposes. This can be done via a boundary elevation, as in the flood-control storage-conservation storage designation, or via percentage allocations. In Kansas, the conservation storage in Federal reservoirs in which the State owns an interest are subdivided based on percentage allocations. Figure 6.1 is a schematic of a facility with this configuration. In effect, the facility can be thought of as two or more separate reservoirs that are related by virtue of the physical resources that they share. It is often the yield of one of these distinct reservoirs (such as pool i in fig. 6.1) that needs to be determined.
Figure 6.1--Reservoir pool segmentation schematic.
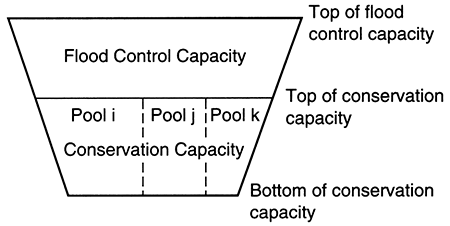
Equation 6.2 is an extension of Equation 6.1 and describes the mass balance for a conservation pool in a multiple-conservation-pool facility. Note that for the purposes of yield analyses, which address the drought portion of the hydrologic spectrum, flood-control operations can be effectively ignored by assuming that any flood waters are immediately released. Boxed section 6.2 illustrates the water balance for an eastern Kansas reservoir.
BSTORi + INi + PRECi - EVAPi - SEEPi - REi - Hij + Hji = ESTORi (eq. 6. 2)
where:
BSTORi = storage at beginning of period in pool i
INi = storable inflow during time period available to pool i
PRECi = precipitation during time period available to pool i
EVAPi = evaporation during time period from pool i
SEEPi = seepage loss during time period from pool i
RELi = release during time period from pool i
Hij = handover to other conservation pools from pool i
Hji = handover from other conservation pools to pool i
ESTORi = storage at end of time period in pool i
i = conservation pool of interest
j = other conservation pools
The variables are analogous to those in equation 6.1, but are modified to reflect sharing among pools. In principle, storable inflows are allocated based on the pool-capacity percentages. If the capacity of a pool is 30% of the total storage of the conservation capacity, that pool is generally entitled to 30% of the storable inflows. This guiding principle, however, can be modified by contractual agreements or water-rights provisions that give preference under specific inflow or storage conditions to one pool at the expense of the others.
Sedimentation is apportioned based on capacities also. Unused sediment storage within the conservation capacity is prorated among the conservation pools. If the sediment within the conservation capacity exceeds the allocated sediment storage, then the pools share the lost conservation capacity by proration.
Evaporation and precipitation are allocated based on storage. A pool would be assessed (or credited) for 45% of the net evaporation (gross evaporation - precipitation) during a given time step if the storage in that pool were 45% of the total conservation storage at the beginning of the time step. The allocation of net evaporation is independent of pool capacities.
Releases are taken in full from the appropriate pool. Because the pools are operating as independent reservoirs that share the same facility, one pool might be empty while another might have ample stored water. A release to support the designated purpose of an empty pool could not be expected even though other pools, and thus the conservation capacity as a whole, might have ample water.
The handover terms allocate water when a pool does not have unused capacity available to store all the inflows to which it is entitled, but at least one other pool does. The first term, Hij, delineates spillage from the pool of interest to the others. The second term, Hji, delineates spillage from other pools to the pool of interest. Like inflows, handovers are apportioned based on storage capacities. Handovers are not possible when all the individual conservation pools, and therefore the entire conservation capacity, are filled. In this case, remaining handovers become flood water stored and released from the flood-control capacity.
Handovers are another way in which the operations of one pool can affect the yield of another. Consider a reservoir with a conservation storage capacity composed of three pools: i, j, and k. If the yields from pools j and k are uncommitted and remain in the reservoir, then, relative to the case where these pools are making significant releases, pools j and k are less likely to be able to store all the inflows to which they are entitled. This will result in greater handovers to pool i, thereby increasing the yield of pool i.
The parameters for this more detailed form of the operations study are identical to those for the simpler form. For Kansas yield studies, monthly time steps are most common. As yields are expressed typically on a daily time scale (in million gallons per day) or even on a time scale of seconds (in cubic feet per second), some averaging is implicit in the results.
The application of the mass-balance approach for yield analyses in Kansas reservoirs has the same advantages and disadvantages that the simplified mass-balance approach has. In addition, having several distinct pools share one physical facility adds a significant complication: namely, the ability for operations in one pool to affect the yield of another. To determine the yield of one pool, the operating policies of the other pools must be known or assumed. This can be problematic if, as in the State's water-marketing program, releases from a pool are made on demand of one or more contracting entities and do not follow any established operating rule.
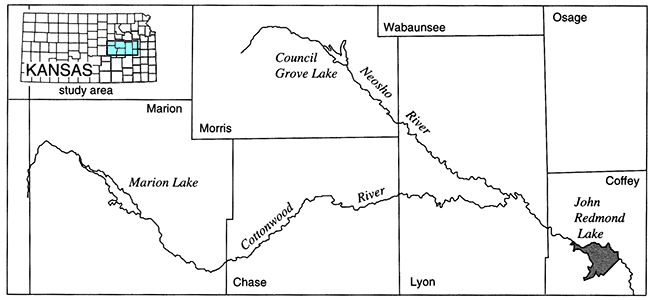
In order to give a sense of the magnitude of the individual terms in equation 6.2, we will use the example of John Redmond Reservoir on the Neosho River in southeast Kansas (fig. B6.2.1). John Redmond Reservoir has a current estimated design-life conservation capacity of 49,160 acre-ft (60.64x10⁶m3). The conservation capacity is divided into a water-quality pool (11,710 acre-ft [14.44x10⁶m3] or 23.82% of conservation capacity) and a water-supply pool (37,450 acre-ft [46.19x10⁶m3] or 76.18% of conservation capacity).
The water-quality pool makes releases on a schedule that varies by month and is designed to operate with approximately a 10% chance of shortage. The design water-supply pool has a computed 2% yield of 27.2 million gallons per day (42.1 cfs [1.19 m3/s]). The following table summarizes the 2% yield calculation water balance for the June 1952-September 1955 critical drought period. The reservoir began and ended the period with the conservation capacity full, so the net change in storage components is zero. All units are thousand acre-feet.
| Conservation Capacity | Quality Pool | Supply Pool | |
|---|---|---|---|
| Inflow | 256.2 | 61.0 | 195.2 |
| Evaporation | 86.8 | 17.2 | 69.6 |
| Releases (incl. seepage) |
142.7 | 45.0 | 97.7 |
| Spills to flood control | 26.8 | 0.7 | 26.2 |
| Handover: quality to supply | 0.0 | ||
| Handover: supply to quality | 1.8 |
Figure B6.2.1--John Redmond Lake (modified from map by Kansas Water Office).
Reservoir-yield estimates are fraught with policy implications. In addition to affecting water-supply policies at the reservoir, a yield determination can affect policies pertaining to regional water supply, reservoir recreation, and downstream riverine resources. Often, the highly inter-related nature of water-resources systems and objectives leads to a chaotic effect (Gleick, 1987); namely, a small change in a yield estimate can have significant repercussions in numerous water-policy arenas.
In Kansas, water supplies are marketed based on the aforementioned 2% yield criterion. Even allowing for computational uncertainties, the odds of drought-level inflows and high evaporative losses are low for any given year. Defining water-supply yield at this probability leaves a large quantity of water available in most years. As a consequence, much of the average reservoir yield remains uncommitted.
Water-supply users place great value on supply reliability and generally tend to view the 2% yield criterion as prudent and beneficial. However, a water-supply entity in search of additional water supplies might feel that the 2% criterion, or a yield calculation based on that criterion, unnecessarily restricts the water supply available from a resource. From the perspective of this entity, the 2% yield criterion could be viewed as a policy that institutionalizes the under-utilization of an important resource.
The recreation sector is a primary beneficiary of the 2% yield policy. Because firm yield demands are far less than average yield, reservoirs typically remain in a robust condition during moderate- or short-duration droughts. As a consequence, significant drawdowns for water-supply purposes are limited to more extreme droughts. Recreation facilities at reservoirs operate within a relatively narrow zone of lake elevation. Therefore, a 2% yield policy enhances the utility of the lake for recreational activities such as boating, swimming, and water skiing.
Resources downstream of the reservoir also benefit from a 2% yield policy. Streamflows are enhanced by reservoir releases during dry conditions. Often, the river is used as the conveyance mechanism for water-supply releases. The Kansas Department of Agriculture, Division of Water Resources, is obligated statutorily to protect water released from Federal reservoirs under contract provisions from diversion by unauthorized downstream users. In this case, natural riparian demands first-use water-supply releases. While transit losses are viewed as a cost from the perspective of a water-supply user, they constitute a benefit to a drought-starved river reach. As a rule, severe droughts will shift significant benefits from those of retaining water behind the dam to those realized by moving water from the reservoir to the downstream river system.
Water-supply policy that depends on a quantified yield is vulnerable to the underlying assumptions used to calculate the yield. The establishment of a yield value implies a deterministic capability to predict future drought conditions. Runoff from watersheds is a nonlinear response to rainfall and antecedent conditions. Alterations in land use, soil moisture, rainfall-intensity variations, water-use patterns, and vegetative conditions create time-variant states in the watershed that result in infinite potential outcomes. As a result of these complexities, the assumptions behind a yield determination are as important as the yield value itself. In order to properly assess policy implications and options, contingency plans must be developed should actual conditions deviate from those that were assumed in the development of the yield estimate. Contingencies could include the reduction of demands as water-supply storage decreases, the recalculation of yield using observed antecedent conditions, or the reapportionment of available yield among competing users in order to minimize hardships.
The apportionment of shortages among stakeholders is one key provision that must be addressed. While available-yield determinations are saddled with uncertainty, allocation of yield shortages among users is a deterministic procedure. Equity is expressed through allocation of remaining storage in proportion to each user's relative allocation of the original yield. In cases where certain individual withdrawals were less than contractual allowances, allocations of storage should be weighed inversely to the amount previously withdrawn. Withdrawals must be monitored in order to maintain equity among users.
Experiences from past droughts have shown that users tend to adjust their own demand rates as storage declines (Sheer, 1980). Because the assumed yield policy is based on a constant demand in the face of deterministic inflow conditions, the occurrence of drier-than-assumed conditions requires one of two responses: suffer a shortage under current demand rates or reduce demands in response to the actual conditions. One expedient method for setting mid-drought corrections is hedging, which accepts small release reductions in the early stages of a drought in order to offset a large deficit in the later stage of a drought (Maass et al., 1962).
The sustainability of reservoir yield through a multiple-year drought has repercussions for other facets of reservoir operations. As demand for water approaches the expected yield, the reservoir's ability to accommodate other purposes can be reduced. For example, drawdowns of the normal conservation pool to enhance fisheries and shoreline wildlife habitat can require storage evacuations of approximately 30% of capacity in order to have the desired effects. This action temporarily reduces reservoir storage, and therefore the yield. Such a drawdown plan can be operated in situations where the expected demand over the course of the drought remains well below the yield of the effectively smaller reservoir. Once the demand curve and yield curve begin to converge, drawdown policy must become more conservative, shifting from a routine action to an opportunistic tactic. Under heavy subscription of water supply, drawdowns for fisheries or recreation are coordinated to take advantage of the anticipated drawdowns seen under the drought cycle. The benefits of drought-induced drawdowns to a reservoir fishery are a function of the timing and duration of the lower water levels.
Although the primary means of maintaining the water-supply capability of a reservoir during drought is demand reduction, conjunctive use policies also extend the utility of reservoir storage. Conjunctive use entails the utilization of multiple sources of water to meet a common demand. A general hierarchy of use among water sources would be: streamflow, reservoir storage, ground-water storage. The conjunctive use of streamflow and reservoir storage is the heart of the water-assurance concept. Users rely on the available streamflow to first meet their demands, thereby resting their reservoir supplies. Once streamflows have receded below a specified threshold level, reservoir releases can be called upon to meet demands. In the course of a drought cycle, this strategy reduces the length of time that a reservoir is called upon to meet demands. Because yield is a function of time, a rested reservoir can provide water above its design yield over the compressed time period.
The same concept holds for surface and ground water. Surface water can be used in an opportunistic manner that reduces aquifer demand because surface water is typically more transient than water stored in aquifers. Reservoir drafts may be larger than yield early in a drought. Once the reservoir reaches a depleted state, it can be rested for recovery while demand shifts to the aquifer. With system operations, the flexibility of diverse water sources leads to enhanced reliability; the yield of the system can be greater than the sum of yields of the individual components.
Reservoir yield has to be viewed as an function of nonlinear inputs. The anticipated inflows which occur under drought are located at the extreme end (i.e. those flows having a greater than 95% chance of being exceeded) of the historic flow-duration curve, which is a graph of the cumulative frequency of historic flows. The extreme low-flow region of a typical flow-duration curve is defined by few data points due to the rarity of these events. Furthermore, the data that are available are often widely scattered. Therefore, extreme drought is difficult to analyze and forecast. Reservoir policies established to maintain yield under these conditions must recognize two tenets: 1) the historic drought of record will not repeat itself exactly; and 2) the historic drought of record will be altered for the worse by subsequent anthropogenic perturbations in the watershed.
While extreme drought may be defined as having a 2% chance of occurrence or being a once-in-fifty year event, probability calculations enable this risk to be quantified over any extended time period. Using the basic risk equation (Linsley et al., 1975) that describes the probability of an event happening at least once in a specified time period, the chances of an extreme (2%) drought occurring at least once in the next 20 years is one out of three. Similarly, there is a one out of two chance that an extreme drought will occur at least once in the next 35 years. Water-supply planning horizons are often in the range of 20 to 40 years. Thus, the probability of an extreme drought occurring at least once during the typical planning horizon ranges from 1/3 to greater than 1/2.
Compounding the complacency induced by the definition of extreme drought is the loss of institutional memory at utilities and reservoir-operation centers. In Kansas, the last major multiple year drought was 40 years ago (1952-57). Professional points of reference are rarely available to provide guidance for operational policies and decisions. Furthermore, most of the reservoir facilities have never been subjected to severe drought stress, so their functionality under extreme conditions is somewhat uncertain. Further complications can be expected to arise as the recreation sector, which has enjoyed the utility of predominantly near-full reservoirs, is confronted with a diminished facility. This typically heightens public interest and focuses attention on reservoir-operation rules and decisions.
Vigilance is the key to managing the yield policy. With regard to policy implications, it is important to remember that a yield estimate and the assumptions and uncertainties that form the foundation of the yield estimate can not be separated. During droughts, the consistency of actual conditions to previously assumed conditions must also be monitored and assessed. Contingency plans must be developed and implemented when the assumptions are violated, which is inevitable.
Fundamentally, reservoir yield is a function of inflow, net evaporation, and storage. In the absence of stresses such as changing watershed or climatic conditions, inflow and net evaporation may be considered stationary. Storage, however, is continually decreasing due to sedimentation. The rate of storage decrease depends primarily on the soils, land uses, hydrology, and hydraulics in the watershed upstream of the reservoir. Nonetheless, unless compensatory actions are undertaken, storage decreases monotonically with time. Because reservoir yield can not be sustained if reservoir storage is not, the ultimate yield of a river-reservoir system will tend to the yield of the river alone. An interesting discussion of reservoir sedimentation and by extension, the sustainability of reservoir yield, can be found in Reisner (1986).
Large reservoirs are designed with a sediment storage capacity sufficient to store the estimated sediment load expected to occur over the design life of the project. A 50- or 100-year design life is used for most projects. With all else equal, the storage (and therefore the yield) will be greater than design as long as there is unused sediment storage capacity. The converse also is true. The prediction of future sedimentation loads and deposition is difficult and prone to large errors (Singh, 1992). Consequently, the actual useful life of a project can differ significantly from the design life. Table 6.2 illustrates the design and estimated actual conservation storage capacities for two major Federal reservoirs in Kansas.
Table 6.2--Design and estimated conservation storage capacities.
| Reservoir | Design Capacity (acre-ft) |
in Year | Est. Actual Capacity (acre-ft) |
in Year |
|---|---|---|---|---|
| John Redmond | 62,500 | 2013 | 57,800 | 1993 |
| Tuttle Creek | 122,000 | 2012 | 295,000 | 1993 |
The sediment storage in the conservation capacity at John Redmond filled approximately 25 years before design. Conversely, as of 1993, Tuttle Creek could provide additional yield from 173,000 acre-feet (0.213 km3) of unused conservation-capacity sediment storage. Both reservoirs are losing capacity to sedimentation and have the same ultimate fate. In the absence of any mitigation efforts at Redmond, however, their prospects over the intermediate term of their design lives are very different. Additional sediment information for three major reservoirs along the Kansas River is provided in Boxed section 6.3.
Reservoir yield can be prolonged significantly in several ways. In a multi-purpose facility, the capacity of one storage capacity can be augmented by reducing another capacity. Raising the boundary elevation that separates the flood control capacity from the conservation capacity will augment the conservation-storage capacity at the expense of the flood-control capacity. Flood-control capacities can be many times larger than conservation capacities, so a large percentage gain in conservation storage (and therefore yield) can be garnered with a small percentage loss of flood-control capacity. Note that this is primarily an institutional and operational change, but may require some structural modification to outlet works as well.
At John Redmond, this type of adjustment could be completed while maintaining the design storage of the flood-control capacity. The overall sediment in the facility is less than expected. The problem is that the sediments have been deposited in the conservation capacity to a much greater degree than expected. Relative to design, the conservation capacity has less storage than expected while the flood-control capacity has more storage than expected. The reservoir could be re-balanced by raising the top-of-conservation level. The flood-control capacity would lose storage but still have more capacity than design.
Other means of increasing storage, such as physically raising the height of the dam or removing accumulated sediment deposits, are possible. These projects, however, are usually unjustifiable from economic and environmental perspectives. To date, neither of these approaches has been used for any major reservoir in Kansas.
Lastly, yield lost to diminished storage capacity could be offset by augmenting reservoir inflow. Augmentation usually implies the acquisition of water from other basins. Proposals of this type raise numerous political concerns that, in addition to environmental and economic factors, must be considered. Although many ambitious proposals have been advanced, few projects of this type have been started in the western United States in the last several decades.
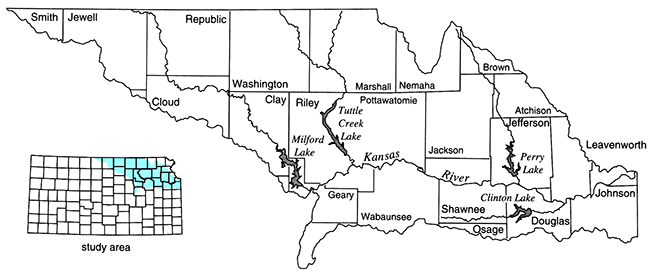
The Kansas River in northeast Kansas (fig. B6.3.1) is formed by the confluence of the Smoky Hill River and the Republican River at Junction City, Kansas. It flows generally eastward until it joins the Missouri River at Kansas City. The Kansas River corridor is home to approximately 1/3 of the state's population. The Kansas River, and its alluvium, is a major source of water supply for this fast-growing region.
There are four multi-purpose Corps of Engineers reservoirs on major tributaries of the Kansas. Three of them, Milford Reservoir, Tuttle Creek Reservoir, and Perry Reservoir, are on northside tributaries and were put into service in the 1960's. The following table summarizes the conservation capacity lost to sedimentation in these facilities. All storage units are thousand-acre-feet.
| Milford | Tuttle Creek | Perry | |
|---|---|---|---|
| in-service year | 1967 | 1962 | 1969 |
| original conservation capacity | 415 | 425 | 240 |
| estimated 1996 conservation cap | 370 | 295 | 205 |
| conservation capacity lost | 45 | 130 | 35 |
| percentage loss | 11% | 30% | 15% |
| project design life, years | 100 | 50 | 100 |
| design storage at end of project life | 300 | 122 | 150 |
The total conservation capacity lost to-date is approximately 210,000 acre-ft (0.26 km3), or an amount greater than the current conservation capacity of Perry Reservoir. By the time that the conservation capacities reach their design storage levels, over 500,000 acre-ft (0.62 km3), or almost half of the total original conservation capacity, will have been lost.
In the face of monotonically decreasing capacities and increasing demands, the utilization and management of the water-supply resources become critical. On the demand side, conservation programs and practices can slow the rate of water-demand growth. On the supply side, continually improving watermanagement practices can improve the efficiency of water-supply operations.
The entities that depend on the Kansas River for water supplies have responded to these challenges by forming the Kansas River Water Assurance District. This District has contracted for water-supply storage in each of the three reservoirs listed above. The District uses this storage to assure the supply of water to District members during drought periods. District storage is operated as a unified system and the efficiency benefits attributable to the system operations accrue to District members. In order to help ensure that District water is being used wisely, each District member must adopt a conservation plan that adheres to guidelines developed by the Kansas Water Office.
Figure B6.3.1--Kansas-Lower Republican River Basin.
Yield is a fundamental aspect of water-supply planning and management. At face value, yield is easy to define and conceptualize. Many complicating issues arise, however, in going from the concept or definition to the actual quantification of yield for a water-supply source. Yield determinations are highly dependent on methodology and assumptions, as well as data sources that can be sparse and non stationary. Furthermore, yields are often prospective in the sense that the item of interest is a yield at the end of a contracting or planning horizon. The necessity of determining yields for projected future conditions exacerbates many of the uncertainties incumbent in the analyses.
The mass-balance (operations study) methodology has many advantages with regard to quantifying yields. It is being used in Kansas to determine yields from reservoirs in which the State of Kansas owns an interest. The mass-balance approach provides a pragmatic and consistent methodology for determining yield. Still, the level of precision associated with this approach exceeds the level of accuracy.
Yield determinations affect many facets of water policy. In Kansas, a yield estimate places an upper limit on the amount of water supply that can be marketed from a reservoir. This de facto rationing of a water resource can have significant implications for entities in search of water supplies. Therefore, it can affect the larger regional water-supply situation. Yield determinations also have corollary implications for policies pertaining to reservoir recreation, reservoir fisheries, and downstream streamflows and riverine habitat.
Reservoir yields depend primarily on inflows and reservoir storage. As such, reservoir yields decrease with time due to reservoir sedimentation. The loss of storage results in a loss of reservoir yield unless compensatory actions are taken. These measures can include augmentation of inflow, increasing the conservation storage capacity via structural or institutional means, or physically removing the accumulated sediments. Except for increasing the conservation storage via institutional means, these approaches are generally not feasible due to economic, environmental, and political concerns.
California Department of Water Resources, 1987, California water-Looking to the future: California Department of Water Resources, Bulletin 160-87
Curtis, D., D'Aleo, J., and Larson, L., 1994, Radar-rainfall data for the Great Flood of 1993: WSI Corporation, Billerica, Massachusetts
Dracup, J. A., Lee K. S., and Paulson, E. G., 1980, On the definition of droughts: Water Resources Research, v. 116, no. 2
Gleick, J., 1987, Chaos--The making of a new science: New York, Viking-Penguin
Kansas Water Office, 1996, Milford yield analysis report: Kansas Water Office, Appendix C
Koelliker, J. K., Govindaraju, R. S., and Lewis, S. L., 1995, Evaluation of Marion and Council Grove lakes water-supply capabilities: Kansas Water Office, Project 95-05
Linsley, R. K., and Franzini, J. B., 1979, Water-resources engineering: New York, McGraw-Hill
Linsley, R., Kohler, M., and Paulhus, J., 1975, Hydrology for engineers: New York, McGraw-Hill
Maass, A., Hufschmidt, M., Dorfman, R., Thomas, H., Marglin, S. and Fair, G., 1962, Design of water-resource systems: Harvard University Press, p. 443-458
McMahon, T. A., and Mein, R. G., 1978, Reservoir capacity and yield: Amsterdam, Elsevier Scientific Publishing Company
Peck, J. C., 1984, Legal aspects of water storage in Federal reservoirs in Kansas: The University of Kansas, Law Review, v. 32, no. 4
Reisner, M., 1986, Cadillac desert: New York, Penguin Books, p. 488-494
Sheer, D. P., 1980, Analyzing the risk of drought--The Occoquan experience: Journal of the American Water Well Association
Singh, K. P., 1992, Predicting sediment loads: Civil Engineering, v. 62, no. 10
Smith, J. A., 1993, Conditional-yield operating rules for low-flow management: Journal of Water Resources Planning and Management, v. 119, no. 3
Stockton, C. W., and Meko, D. M., 1983, Drought recurrence in the Great Plains as reconstructed from long-term tree-ring records: Journal of Climate and Applied Meteorology, v. 22, p. 17-29
U.S. Army Corps of Engineers, 1982, Kansas City District, Mineral Intrusion Study, Kansas and Osage Rivers, Kansas: U.S. Army Corps of Engineers
Wurbs, R. A., and Karama, A. S., 1995, Salinity and water-supply reliability: Journal of Water Resources Planning and Management, v. 121, no. 5
Previous--Water Chemistry and Sustainable Yield || Next--Effects of Agriculture on Water Yield in Kansas
Kansas Geological Survey
Comments to webadmin@kgs.ku.edu
Web version placed online May 6, 2013. Original publication date 1998.
URL=http://www.kgs.ku.edu/Publications/Bulletins/239/Leib/index.html