Kansas Geological Survey, Bulletin 233, p. 111-121
by
Ralph W. Knapp and John French
Kansas Geological Survey
Accurate quantitative modeling of stratal sequences requires verification of model results by means of comparisons with known stratigraphic intervals, and in many cases seismic data provide the best or only means toward that end. In eastern Kansas the scale of variability within Middle and Upper Pennsylvanian units is of the order of meters. Unraveling the stratigraphy and thereby verifying models at such a scale requires high-resolution seismic data. Middle and Upper Pennsylvanian cyclic sequences (cyclothems) are seen as just a few wiggles on standard petroleum exploration reflection seismogram sections with frequency responses of <80 Hz. For instance, the Kansas City and Lansing Groups cannot be distinguished. However, the use of high-resolution reflection seismology, with frequencies up to 500 Hz, allows the detection of thin-bed members of the individual groups and formations to approximately 2-m (7-ft) thickness. Geologic cyclicity and reflection seismology harmonize, and carbonate units are seen as peaks and siliciclastic units (mostly shales) as troughs. Seismic response becomes sensitive to phenomena such as the presence of intrabed sandstone lenses in the shales and the surface roughness (diffusivity) of lithologic interfaces. Complex trace analysis aids the interpretation of bed thickness and the nature and continuity of geologic boundaries. Reflection strength helps determine which geologic boundaries form strong reflectors and therefore have clean, flat interfaces. Instantaneous phase complements reflection strength by showing strong trace-to-trace coherence and by emphasizing stratal truncations, indicating intrabed structure and sandstone channel presence. Instantaneous frequency indicates (1) intrabed structure and sandstone channel presence when it displays a chaotic pattern and (2) the dominant frequency of the reflector response when coherent. Dominant frequency of the reflector response is frequently useful in determining bed thickness.
An Acrobat PDF file containing the complete paper is available (1.1 MB).
The verification of quantitative models that attempt to produce realistic sedimentary sequences requires the comparison of model results with high-quality stratigraphic data sets. An ideal data set could be derived from a relatively thick and continuously exposed sequence such as the Cretaceous of the Book Cliffs of the western United States, from which details of lithofacies, bounding surfaces, and stratal geometry could be extracted. Unfortunately, in most settings such complete information is not available, and the modeler must rely on a combination of well log, outcrop, core, and seismic data for model calibration and verification. Of these sources of data, in many cases only seismic data can provide information regarding the continuity of stratal surfaces and, by extension, stratal geometry. Borehole data is basically one-dimensional. As discussed in this article, effects such as interface rugosity are not seen on a well log. Furthermore, boreholes are usually too far apart to derive more than a crude picture of the geometry. Reflection seismic data, on the other hand, provide a detailed continuous profile and are sensitive to both lithologic changes (vertical effects) and the condition or quality of the reflection surface (lateral effects). The seismic response is affected by an ill-defined volume about the reflection point.
It is our goal here to describe from a geophysical perspective the ability of high-frequency seismic data to resolve features within the stratigraphically heterogeneous Upper Pennsylvanian strata of eastern Kansas. To effectively model at the scale of variability of these strata (meters to tens of meters), the level of detail resolvable must be maximized and spurious noise minimized. In this article we document small-scale features that are observed on a seismic section shot over a reasonably well-known interval and relate observations on the character of a reflection to observable geologic effects.
In 1986 a 70-m-long (230-ft-long) high-resolution seismic line was shot on the west campus of the University of Kansas. The purpose of the line was to test acquisition and computer processing techniques under development at the time; however, because the data were of higher resolution than any other previously recorded for the given geologic section, they revealed a great deal about the seismic response of Kansas cyclothems. Details of the acquisition have been published elsewhere (Knapp, 1988; Knapp and Müftüoglu, 1987; Knapp and Watney, 1987).
Seismic reflection is a differential process. That is, rather than being sensitive to lithologic processes, reflections are the consequence of changes (differences) in the acoustic impedance (product of density and velocity) of the rock. Because the seismic wavelet is band limited, the reflection from an abrupt interface is smeared or spread in time. This dispersion is defined by vertical resolution (Knapp, 1990; Berkhout, 1984). Likewise, limitations in lateral resolution smear the horizontal character of the reflection response (Berkhout, 1984). Consequently, the vertical character of a reflection is modulated according to (1) the rate of lithologic change (i.e., the vertical rate of change of the acoustic impedance) and (2) the proximity of other reflecting surfaces that produce interfering reflections.
Lateral changes in the reflector, such as faults and reflection surface roughness, likewise modulate the response at a reflection point. We report the results here. Migration, the correction of distortion resulting from reflector geometry, can correct for some of the problems of lateral interferences by removing the effects of diffractions and by moving reflectors to their correct position, but results are still strictly limited by lateral resolving power. Even migration reduces a point to what Claerbout (1985, p. 17) terms a "focus," that is, a point with lateral and vertical dimension. For layer-cake geology with smooth thick-bed reflectors, the reflection character is regular and its amplitude and polarity represent the change in acoustic impedance. In this case the results can be inverted to a geologic interpretation with a maximum of ease, although calibration information is required. In general, however, reflection response is the complex interference of effects resulting from vertical and lateral geologic changes. These effects limit interpretation capabilities.
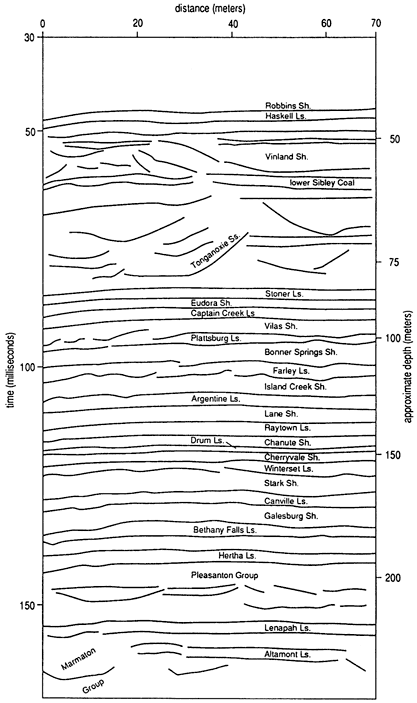
Middle and Upper Pennsylvanian strata of eastern Kansas are characterized by cyclic lithologic sequences made up of alternating, laterally persistent limestones, shales, and sandy shales. These cyclothems are typically 10-30 m (30-100 ft) thick with individual members commonly less than 1 m (3 ft) thick. Local development of sand channels and coals is common in the thicker shales (Heckel, 1978; Heckel et al., 1979). Seismically, most beds appear as thin-bed responses (Knapp, 1990) and are interbedded limestones and shales. Consequently, the seismic section can be processed so that the shales appear as troughs and the limestones as peaks (fig. 1). Thickness cannot be directly measured, but in some cases the thickness of a thin bed can be determined from its amplitude response (Widess, 1973) or its frequency (Knapp, 1990). The amplitude response method requires calibration based on well log or other information and becomes unreliable when vertical or lateral changes of the reflector smear the response or when cyclothemic variation causes tuning of the reflector. The frequency method depends on the cyclothemic tuning of the reflector and, depending on the degree of the tuning, may be approximate. Both methods are employed to judge the thickness of a reflector bed.
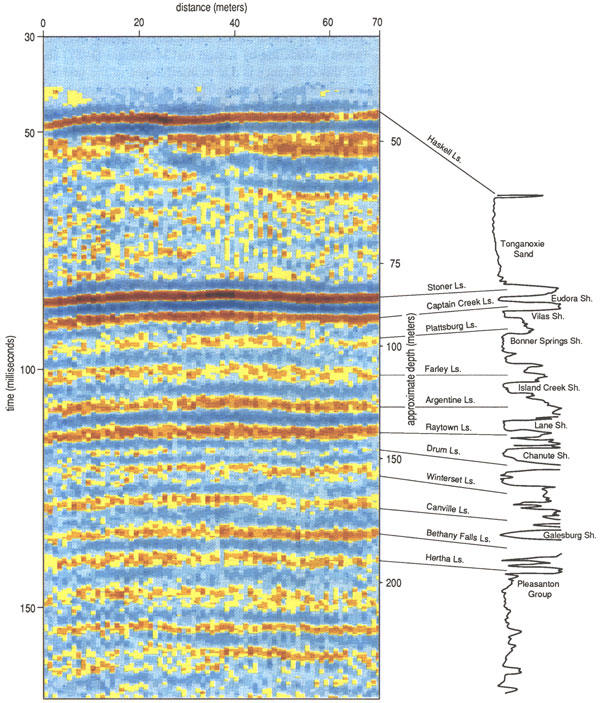
Figure 1--Seismic section acquired on west campus of the University of Kansas. Correlation with stratigraphic section from the area lines up peaks with limestones. Approximate depth in meters is given on the right-hand side of the section.
The particular attributes or components of the seismic trace are magnitude, phase, and frequency. Each of these attributes contributes specific information to the interpretation of the seismic section, and it is frequently advantageous to separate them. The subject of complex seismic trace analysis is reviewed most thoroughly and succinctly by Taner et al. (1979). Although any of these attributes can be displayed in black and white, color adds a great deal of dynamic range and vividness to the display. For instance, on a color display yellow or orange can be quickly distinguished from red; however, on a black-and-white display the amplitude difference between the values represented might be subtle enough to require actual measurement. Color helps one see all the information in a display.
Instantaneous magnitude (reflection strength) emphasizes the strong reflectors in a stratigraphic sequence. These are the limestones and shales that are mainly characterized by their flat reflecting surfaces and their relative thickness compared to the signal wavelength. When geophysicists model a reflecting surface, they almost always presume that the reflector is optically flat; that is, the reflector is flat compared to the highest wavelengths of the seismic source signal. Surface roughness or diffusivity is considered negligible. From inspection of the log in fig. 1, one would never suspect that the reflections from the Plattsburg Limestone (94 ms) and Farley-Argentine Limestone Members (102-108 ms) would be much weaker than those of the Haskell (46 ms), Stoner (84 ms), Captain Creek (88 ms), or Raytown (112 ms) Limestone Member. In fact, because they are thicker, the Plattsburg and Farley-Argentine limestones are modeled as stronger reflectors. The reasons for the difference include surface roughness of the limestone-shale interfaces and interference from diffractions as a result of irregular overlying sand channels within the Vilas and Bonner Springs Shales. Either case results in destructive interference of the limestone reflector; both occur on these data simultaneously.
Thick shales (e.g., the Lane Shale, 109 ms) also cause large-magnitude reflections, manifested as troughs in this case. Such a response indicates not only that the shale is thick with flat surfaces but also that it is free of sandstone channels. Reflection strength displays alleviate the optical bias toward blackened peaks. Troughs tend to be overlooked on conventional displays because they are not as visually prominent as the blackened peak.
Instantaneous phase emphasizes continuity of reflectors. The beauty of instantaneous phase is that amplitude is removed as a component, and all reflectors, weak and strong, have the same display weight. Frequently it is the weaker features in intrabed regions of the seismic section that are of interest, for example, structure within sandstones and shales. In fig. 1, look particularly at the Tonganoxie Sandstone Member (55-80 ms) and the Vilas (90 ms) and Bonner Springs (97 ms) Shales and compare them to the Lane Shale (109 ms) (remember that the shales are the troughs). Instantaneous phase enhances the small perturbations seen in the Tonganoxie Sandstone Member, which result from internal structure, and in the Vilas and Bonner Springs Shales, which (perhaps) result from sandiness. The Lane Shale is massive and clean and shows no such perturbations.
Instantaneous frequency responds to interference effects and bed thickness. Interference effects are commonly a chaotic response of all frequencies. The Tonganoxie Sandstone Member is an example where intrabed features create such a pattern. Thin-bed cyclothems tune to high frequencies, and relatively thicker bed cyclothems tune to lower frequencies (Knapp, 1990). The equation is
thickness = 0.25 (interval velocity / frequency) (1)
The seismic section and its general interpretation is shown in fig. 1. The velocity log inserted into the section is from a well approximately 10 km (6 mi) from the seismic line (Prairie Resources No. I Harrison, sec. 25, T. 13 S., R. 19 E., Douglas County). With the exception of an adjustment at the base of the Tonganoxie Sandstone Member, the fit is generally good. Except for the Sibley coal and the Tonganoxie Member, it is the limestones (peaks) that are identified; the shales in between are inferred. Except for the Tonganoxie, the response of the seismic section is one of thin beds, where the troughs correspond to shales and the peaks to limestones. The general weakening of reflection strength with depth is due in part to distance from the surface and decreased signal-to-noise ratio but also to a general decrease in reflection coefficient, that is, changing geology. Note the reduced contrast of the lithology below 150 ms, seen in the log of fig. 1.
Only the lower half of the Douglas Group is represented on the seismic section. The first reflector is the Haskell Limestone Member, which is the basal member of the Lawrence Shale. The Haskell is 2 m (7 ft) thick and is seen as a peak at 46 ms. The remainder of the group is the Stranger Formation, the upper third of which has shaly sandstone and two thin coals. The two coals are the upper and lower Sibley coals. They are 0.3 m (1 ft) or less in thickness (Bowsher and Jewett, 1943), and they are resolved seismically as two distinctive troughs at 53 ms and 60 ms, respectively. The lower two-thirds of the Stranger Formation is clean Tonganoxie sandstone. (See fig. 5 for the interpretation.)
The Tonganoxie Sandstone Member is a local nonmarine channel sandstone. Beneath the city of Lawrence it is a fine- to medium-grained crossbedded sandstone with rare thin shale and mudstone beds. Beneath this seismic section it has scoured to and into the Stanton Limestone of the Lansing Group. The city of Lawrence lies directly over the center of the Tonganoxie channel valley (Lins, 1950). The thickness of the sand is 43 m (140 ft) under the section, as measured by core (KGS Fishpond No. 1). This is approximately the maximum known thickness of the sandstone.
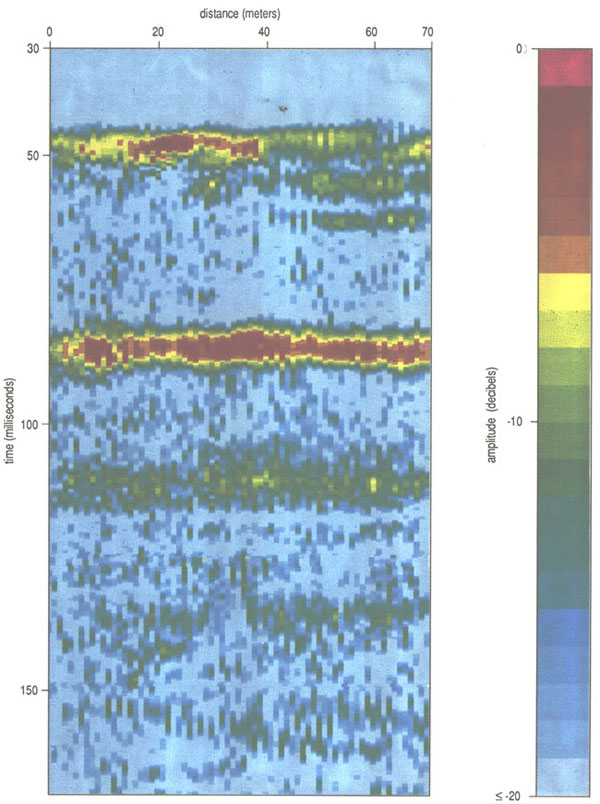
Reflection strength (fig. 2) shows the strong Haskell Limestone Member response (46 ms) as the strongest reflector. Two lesser magnitude events (53 ms and 60 ms) probably relate to the upper and lower Sibley coals. It was demonstrated (Knapp and Müftüoglu, 1987) that, despite the thinness of the coals, the acoustic impedance contrast is great enough to cause a prominent reflection. Therefore the coals should be easily detected. The lack of lateral continuity of these two events is consistent with the interpretation (see fig. 5). The event below 80 ms is the Stanton Limestone.
Figure 2--Reflection strength for the lower Douglas, Lansing, and Kansas City Groups. Color scale is normalized to the maximum value of the section.
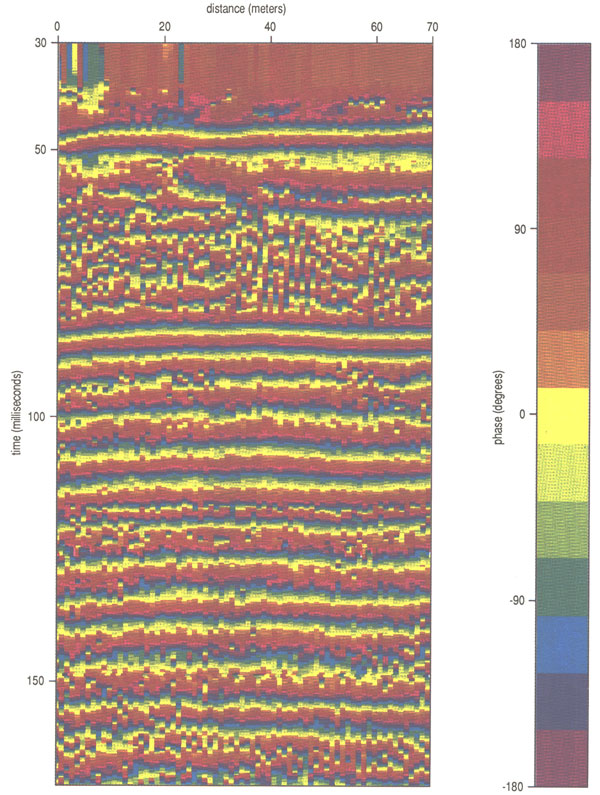
Instantaneous phase (fig. 3) clearly shows the lateral continuity of the Haskell Limestone Member, but, most important, it shows internal channel structure within the Tonganoxie more clearly than the regular seismic section of fig. 1. By focusing on cross-cutting events and semicircular events in the Tonganoxie Member, one can see the truncation of the horizontal bed at 73 ms that occurs about two-thirds of the way across the section (left to right).
Figure 3--Instantaneous phase for the lower Douglas, Lansing, and Kansas City Groups.
Instantaneous frequency (fig. 4) shows, in general, a frequency response greater than 400 Hz (purple) for the small features within the Tonganoxie Member. The frequency response (300 Hz, green) of the Haskell Member is consistent with a thickness of 2-3 m (7-10 ft). The frequency response of the upper Sibley coal is less than 100 Hz (red). The lower Sibley coal has a higher frequency response of 300 Hz (green). Modeling by Knapp and Müftüoglu (1987) shows that this difference is due to interference of the under- and overbed shales. The Haskell Member and the Sibley coals are simple thin beds that are not conducive to tuning because cyclothemic interferences are not involved. Consequently, attempts to determine bed thickness will be inaccurate, probably overestimating thickness because tuning accentuates high frequencies.
Figure 4--Instantaneous frequency for the lower Douglas, Lansing, and Kansas City Groups.
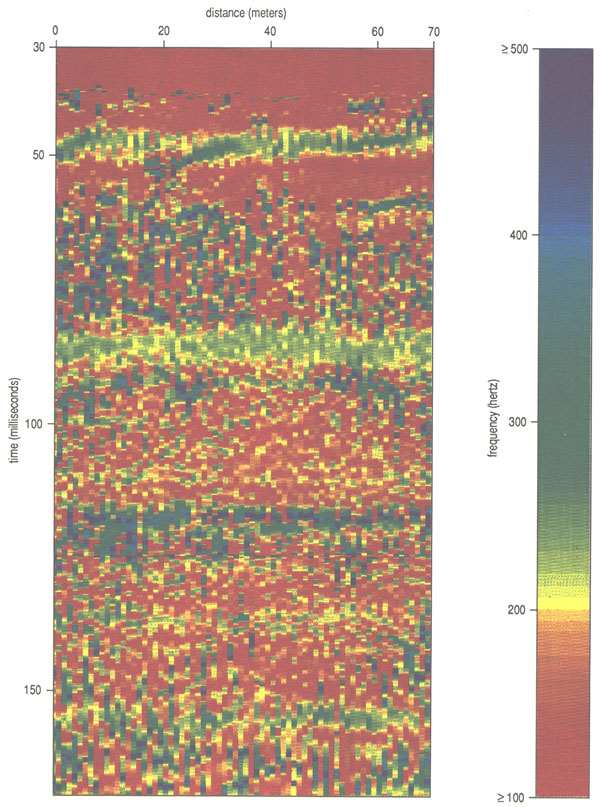
Figure 5 is the seismic interpretation of the Kansas City-Lansing Groups. Particularly prominent on this part of the reflection strength section (fig. 2) are the reflections of the Stanton Formation limestones (83-89 ms) and the Lane Shale-Raytown Member combination (109 ms). Other prominent events on the reflection strength section include the Chanute Shale (120 ms) and the Swope Limestone-Elm Branch shale combination (135 ms). Note that reflection strength is not sensitive to polarity. A powerful trough (shale) has the same response as a powerful peak (limestone). The Chanute Shale event, in particular, is not well displayed in fig. 1 because it is a trough. It does not have the same visual impact as a peak would have.
Figure 5--Interpretation of the lower Douglas, Lansing, and Kansas City Groups.
The sandiness of the Vilas (92 ms) and Bonner Springs (100 ms) Shales is seen on the instantaneous phase section (fig. 3). There is a strong lack of lateral continuity in the troughs of these reflectors. The breadth of the troughs is emphasized on the instantaneous frequency section (fig. 4), where the response is less than 200 Hz (yellow to red). Other than these two shales, the section is fairly laterally coherent to the Pleasanton Group beneath 140 ms.
Instantaneous frequency (fig. 4) shows two points of particular interest. The Drum Limestone (118 ms) is only 2-3 m (7-10 ft) thick and has a high-frequency response of 500 Hz (purple). The Block Limestone Member (123 ms) waxes and wanes in strength across the section. This is because its detection is marginal. It represents the limit of detection for these data. However, this interval displays good continuity in both frequency and phase (figs. 3 and 4).
In the Stanton Limestone only the Stoner and Captain Creek Members are detected (two peaks at 84 ms and 88 ms, respectively). The South Bend Limestone Member and the Rock Lake Shale Member were cut out by the Tonganoxie channel. The lack of sand in the Eudora Shale Member (trough at 86 ms) contributes to the power of the reflector. Figure 6 shows the flatness of the reflecting surface at the top and bottom of the Stoner and the top of the Captain Creek. At almost 2 m (7 ft) in thickness, the Eudora Shale Member can be considered to be a relatively thick bed. Because the limestone members of the Stanton are nearly twice as thick as the Eudora Member and because their velocity is nearly twice as much, the wavelength thickness is equal for all three beds. This makes the situation for tuning nearly perfect-hence the strong, ringy result of 225 Hz. This frequency response is consistent with a limestone thickness of 4 m (13 ft) and a shale thickness of 2 m (7 ft). This example also demonstrates the correlation between reflector flatness and reflection strength.
Figure 6--Roadcut on West I-435 showing the Stanton Limestone.
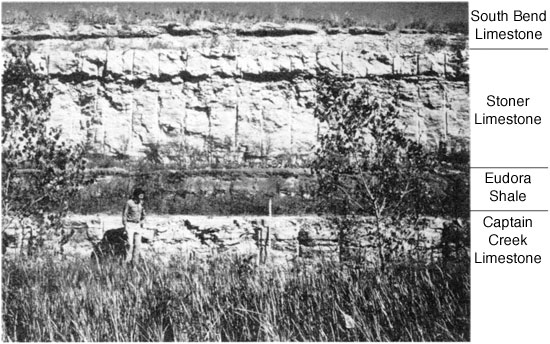
Figure 7 shows the contact between the Vilas Shale (92 ms) and the Spring Hill Limestone Member (95 ms). Considering both the sandiness of the Vilas (figs. 3 and 7) and the roughness of the contact between the two beds (fig. 7), the reflection from the Spring Hill Member is extremely weak. Figure 8 shows the Spring Hill-Bonner Springs contact and the presence of a sandstone channel in the Bonner Springs. Figure 9 shows the Farley-Argentine (102-108 ms) upper contact has a rough surface. The Farley-Argentine limestone has a weak reflection response because of the sandiness of the overlying shale and/or the diffusivity of the reflection surface. Note that the Island Creek Shale Member between the Farley and Argentine Members is considered to be of negligible thickness beneath the seismic section. This is seen on all the logs from the region.
Figure 7--Roadcut on West I-435 showing the Stanton Limestone (Captain Creek Limestone Member), the Vilas Shale, and the Plattsburg Limestone (Spring Hill Limestone Member).
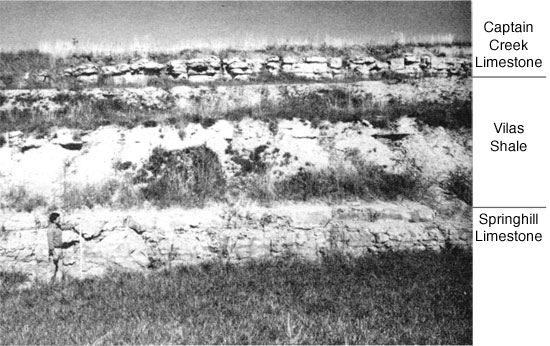
Figure 8--Roadcut on West I-435 showing the Lansing Group (Plattsburg Limestone, Spring Hill Limestone Member) and the Kansas City Group (Bonner Springs Shale).
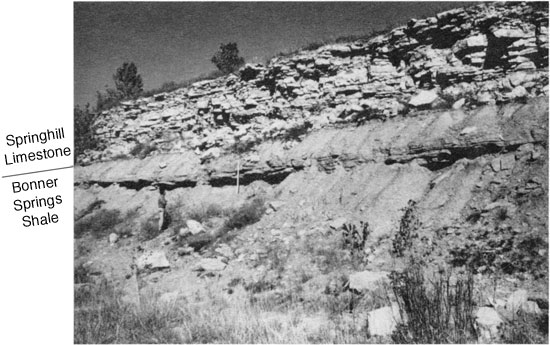
Figure 9--Roadeut on West I-435 showing the Wyandotte Limestone (Farley-Argentine Limestone Members), the Lane Shale, and the Iola Limestone (Raytown Limestone Member). References
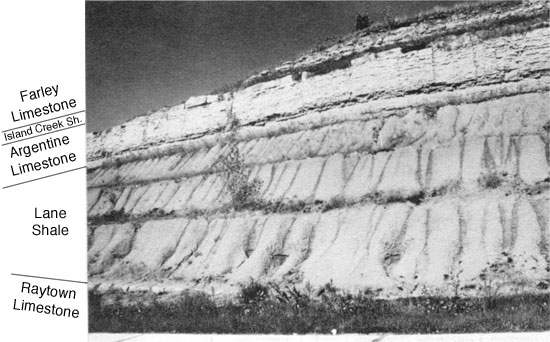
The Lane Shale under the city of Lawrence is not as thick as it appears in fig. 9, but it is a clean shale with a flat contact with the underlying Raytown Limestone Member. Consequently, the two make a strong trough-peak combination that is evident on all section displays.
The seismic reflection response of the cyclothems of eastern Kansas to frequencies in the passband from 100 Hz to 500 Hz tends to tune to the thickness of the beds. Although Middle and Upper Pennsylvanian cyclothems of eastern Kansas are basically interbedded limestones and shales and the seismic response is one of peak and trough for the cycle, the high-resolution seismic interpretation of their response is not quite that simple.
Reflection strength depends not only on rock contact type (i.e., shale-limestone) and bed thickness but also on the nature or diffusivity of the contact and/or the presence of laterally irregular sand channels in the overlying shale. Clean shales and flat contacts result in strong reflectors. In this case, the actual strength and frequency response of the reflection depends on bed thickness. Rough contact surfaces and sand channels in the overlying shale can virtually obliterate a limestone reflector. In the Bonner Springs and Vilas Shales both conditions existed at the same time, so it is difficult to separate the effects. Instantaneous phase specifically highlights lateral discontinuity, if not by showing coherent but curved channel-looking features then by having a somewhat chaotic nature. In the display of instantaneous phase, internal structure within the Tonganoxie Sandstone Member is seen, and the presence of sandstone lenses within the Vilas and Bonner Springs Shales is inferred. Instantaneous frequency demonstrates a realistic relationship between frequency value and thin-bed thickness when interval velocity is known or inferred.
Thus the high-resolution seismic section provides information about the quality of a shale in terms of whether or not it contains sand lenses. It contains information about the quality of the shale-limestone contact. From this, inferences can be made about whether the bed surface was exposed to karst development, bioturbation, or other effects that would roughen the surface.
These observations show why synthetic seismograms may fail to fit observed seismic data. Seismic data contain lateral effects, whereas synthetic seismograms do not. The effect of lateral discontinuity becomes more prominent at high frequencies (short wavelengths) because wavelength approaches the dimensions of roughness and diffusivity ceases to be negligible.
Resolution power of the section is indicated by the clear resolution of the upper and lower Sibley coals, each about 0.3 m (1 ft) thick, at depths of 50 m (160 ft) and 60 m (200 ft), respectively. Given the strength of the reflection from the 2-m-thick (7-ft-thick) Haskell Limestone Member, it is evident that reflections from limestones thinner than 1 m (3 ft) are not difficult to detect in the shallow part of the section. In the deeper part of the section the limits of detection are defined by the marginal detection of the Block Limestone Member, which is 1 m (3 ft) thick, at a depth of about 160 m (525 ft).
Wave propagation, particularly through sequences of strong cyclic thin beds like the Kansas City-Lansing Groups, is a high-cut filtering process. Frequency response diminishes with depth as thin beds tend to pass low frequencies and return high frequencies to the surface (Ziolkowski and Fokkema, 1986). This is seen on these data. The high-frequency response of shallow beds means that the high frequencies are being intercepted and returned to the surface. Knapp (1990) shows that for the pure cyclothem the frequency returned is pure; consequently, all other frequencies, ostensibly lower frequencies, are passed to the deeper sections. Ziolkowski and Fokkema (1986) further promote that, as frequencies get lower in value, the probability of their being returned as a reflection diminishes. They use this mechanism to explain the observation that recorded seismograms do not contain the low frequencies of the source.
Ertan Müftüoglu aided in the acquisition of these data. He assisted on the crew while Jeff Treadway monitered the seismograph. Ertan also determined whether or not we were detecting the Sibley coals. Brian Stephens and Lynn Watney aided in the initial interpretation of the data by helping with the correlation of the seismograms with well logs. Lynn showed us the roadcuts and served as a scale in all the photographs of them. He also has been a constant source of information on the stratigraphy of the cyclothems. A special thanks is due to Bill Ross for the work he did in reviewing this article. His efforts resulted in substantial improvement in the work.
Berkhout, A. J., 1984, Seismic resolution: Geophysical Press, London, 228 p.
Bowsher, A. L., and Jewett, J. M., 1943, Coal resources of the Douglas Group in east-central Kansas: Kansas Geological Survey, Bulletin 46, 94 p. [available online]
Claerbout, J. F., 1985, Imaging the earth's interior: Blackwell Scientific Publications, Palo Alto, California, 398 p.
Heckel, P. H., 1978, Upper Pennsylvanian cyclothemic limestone facies in eastern Kansas: Kansas Geological Survey, Guidebook Series 2, 79 p. [available online]
Heckel, P. H., Brady, L. L., Ebanks, W. J., and Pabian, R. K., 1979, Pennsylvanian cyclic deposits in Kansas and Nebraska: Kansas Geological Survey, Guidebook Series 4, 79 p.
Knapp, R. W., 1988, High-resolution seismic data of Pennsylvanian cyclothems in Kansas: The Leading Edge, v. 7, no. 11, p. 24-27
Knapp, R. W., 1990, Vertical resolution of thick beds, thin beds and thin-bed cyclothems: Geophysics, v. 55, no. 9, p. 1,184-1,191
Knapp, R. W., and Müftüoglu, A. E., 1987, Detection of 30-cm-thick coals at depths of 50 and 60 meters by seismic reflection profiling: Society of Exploration Geophysicists, 57th Annual International Meeting and Exposition, Expanded Abstracts, p. 227-228
Knapp, R. W., and Watney, W. L., 1987, Seismic identification of Pennsylvanian cyclothems beneath Lawrence, Kansas: Society of Exploration Geophysicists, 57th Annual International Meeting and Exposition, Expanded Abstracts, p. 338-341
Lins, T. W., 1950, Origin and environment of the Tonganoxie Sandstone in northeastern Kansas: Kansas Geological Survey, Bulletin 86, pt. 5, p. 105-140 [available online]
Taner, M. T., Koelher, F., and Sheriff, R. E., 1979, Complex seismic trace analysis: Geophysics, v. 44, no. 6, p. 1,041-1,063
Widess, M. A., 1973, How thin is a thin bed?: Geophysics, v. 38, no. 6, p. 1,176-1,180
Ziolkowski, A., and Fokkema, J. T., 1986, Tutorial on the progressive attenuation of high-frequency energy in seismic reflection data: Geophysical Prospecting, v. 34, no. 6, p. 981-1,001
Kansas Geological Survey
Comments to webadmin@kgs.ku.edu
Web version March 15, 2010. Original publication date 1991.
URL=http://www.kgs.ku.edu/Publications/Bulletins/233/Knapp/index.html