Kansas Geological Survey, Bulletin 233, p. 509-517
by
Mark T. Harris
University of Wisconsin, Milwaukee
The relatively simple geometries of carbonate buildup margins are amenable to quantitative computer modeling. Margin geometries (progradational, vertical, or backstepping) are the consequences of sediment accumulation patterns across the depositional profile during the evolution of the buildup. Modeling allows comparisons of how different margin geometries and sediment accumulation patterns can influence progradation geometry and provides a range of geometric responses for comparison to actual outcrop examples. MARGIN is a sediment accumulation model of a carbonate buildup written in Pascal for an IBM PC. The model uses a generalized three-dimensional buildup geometry with a circular or linear margin, a foreslope with a constant dip, and a flat-lying basin. The subsidence history, sediment production rate, and basinal sediment accumulation rate control the addition of sediment during a series of iterations. The simulation ends when the basin fills, the platform drowns, or a preselected platform thickness is reached. The model calculates the buildup's geometric dimensions and relative rates of sediment accumulation and outputs a scaled cross section. Variations in sediment accumulation parameters or initial buildup geometry result in quite different progradation geometries. Enhanced progradation results from low buildup relief, steeper foreslope dip, slow subsidence, high sediment production, linear margin geometry, and/or high rates of basinal deposition. For buildups of several hundred meters in thickness, the extent of progradation depends on the basin fill rate. In all simulations starved basins ultimately become too deep for foreslope infilling. This geometric relation suggests that the thickness and timing of basinal sedimentation is a controlling factor on carbonate buildup progradation. The results provide insights for interpretation of ancient buildup geometries (Triassic of the Dolomites, Permian of the Guadalupe Mountains, Devonian of the Canning basin). In all these examples the extent of buildup progradation depends to some degree on the rate of basinal deposition.
An Acrobat PDF file containing the complete paper is available (632 kB).
Margin geometries of carbonate buildups vary widely and range from progradational to backstepping [for examples see Wilson (1975), Playford (1980), and Bosellini (1984)]. In a general sense each margin geometry corresponds to a particular pattern of sediment deposition and erosion. Margin progradation requires sediment accumulation to fill in the edge of a basin, allowing a shallow-water platform to build laterally and bury the former basin and foreslope. Thus a progradational geometry results from foreslope accumulation exceeding vertical platform accumulation (fig. 1). If the platform aggradation outpaces the vertical accumulation of foreslope sediment, either an escarpment forms or the margin retreats landward. This basic relation suggests that the large-scale patterns of carbonate margin geometry reflect long-term patterns of sediment accumulation. Because carbonate buildups are generally relatively simple shapes, the volumes involved are readily quantifiable (Schlager, 1981) and amenable to quantitative computer modeling [see, for example, Bice (1988)]. The resulting range of modeling profiles provides insight into interpretation of ancient buildups.
For a simplified circular buildup the syndepositional geometry is defined by the platform width (or radius), the depositional relief, and the slope angle (fig. 1). The sediment volumes can be quantified for an observed progradation pattern given the overall buildup geometry. As an example, consider a circular buildup with a platform radius of 2 km (1.2 mi). The ratio of the minimum volume of foreslope sediment to the volume of platform sediment necessary for progradation varies widely and depends on the depositional relief (fig. 2). Foreslope sediment volumes greater than this minimum volume produce increasingly greater progradation angles. At a greater depositional relief the rate of foreslope sedimentation must increase to maintain the same progradation angle. (For simplicity and ease of comparison, the ratio of foreslope to platform sediment volumes is used in place of the actual volumes.) A linear margin (fig. 2) with the same sediment accumulation ratio as a circular buildup (which can result from both depositional and erosional processes) will prograde farther (represented by a larger progradation angle in fig. 2) because of the difference in three-dimensional geometry.
Figure 1--Geometric elements of a prograding carbonate buildup.
Figure 2--Progradation angle (contoured values) as a function of a buildup's syndepositional relief and the ratio of foreslope sediment volume to platform sediment volume. Values are shown for both circular (solid contours) and linear (dashed contours) geometries with a foreslope angle of 30° and a radius (or width) of 2,000 m. Note that the same volume ratio (a function of the depositional processes) and buildup relief will produce different amounts of progradation for linear and circular buildups.
These basic volumetric and geometric factors are easily investigated using computer modeling studies. In this article the results of a simple model are compared to outcrop examples to illustrate how sediment accumulation patterns and syndepositional topography influence progradation geometry.
Models of prograding carbonate systems have typically focused on shallow-water, meter-scale, shallowing-upward packages (Read et al., 1986; Dunn et al., 1986; Spencer and Demicco, 1989). Some have attempted to model stratal patterns by modeling depositional processes (Lerche et al., 1987) or by using a sediment budget model (Bice, 1988). The sediment budget approach is adopted here because the consequences of different accumulation patterns can be directly investigated.
To examine margin geometries, I wrote MARGIN, a Pascal program for the IBM PC. The model uses a generalized buildup margin profile consisting of a shallow-water, flat-lying platform, a foreslope with a constant dip, and a deep-water, flat-lying basin. The basic idea is similar to the model of Bice (1988). A series of iterations is run until a predetermined buildup thickness is reached. During each iteration, sediment is produced on the platform and deposited on the platform up to sea level (filling all platform accommodation space created by subsidence); any excess sediment is added to the foreslope (fig. 3). However, there are two additional factors: (1) specification of the three-dimensional geometry as a circular buildup or a linear margin and (2) a sediment accumulation rate for basinal sedimentation. Note that no attempt is made to duplicate the actual details of sediment origin (allochthonous versus autochthonous), transport, or deposition; only the resulting sediment accumulation patterns are considered. Also, the effects of isostasy and compaction are not incorporated into the model.
Figure 3--Basic modeling steps in the MARGIN model.
The initial geometry of the buildup (fig. 1) is defined by (1) the plan view of the margin (circular or linear), (2) the width (or radius) of the platform area, (3) the depositional relief, and (4) the slope angle (for computational simplicity, a single slope angle is used in any one calculation).
Three additional relations are used during a simulation: (1) the relative subsidence history (which may include subsidence and eustatic sea-level effects), (2) the rate of sediment production, and (3) the rate of basinal sedimentation (modeled as a simple sediment layer restricted to the basin). Depending on the input choices, these rates can vary during a simulation or be held constant. The interaction of these rates with the syndepositional topography determines the sedimentation pattern during any simulation.
A simulation terminates when the basin fills, the buildup drowns, or a preselected platform thickness is reached. The program calculates the principal geometric dimensions and the ratio of foreslope sediment volume to platform sediment volume. The results can be presented in a table or as a scaled cross section of the buildup. Harris (1988) gives further details and the program code.
Both the geometry of the buildup profile and the pattern of sediment accumulation change during any given simulation. This evolution results from variations in the buildup's syndepositional geometry or in the subsidence and sediment production rates. Slight differences in these rates or in the initial buildup geometry also result in different geometries at the end of a simulation.
Figure 4 illustrates some of the modeling results. The initial shape was a linear platform or circular buildup with an initial width or radius of 2,000 m (6,562 ft), an initial relief of 300 m (984 ft), and a slope angle of 30°. The final platform thickness is 900 m (2,950 ft) in all 4 cases. Basinal sedimentation rates were set at 10% and 100% of the platform accumulation rates (thus basinal strata are 10% and 100% of the platform strata thicknesses). A stepwise decrease in the relative subsidence rate and a constant sediment productivity interacted to produce the stepwise increases in the rates of foreslope sediment accumulation and progradation.
Figure 4--Carbonate buildup geometries in cross section produced by MARGIN to illustrate the effects of different basin accumulation rates and three-dimensional geometries. Each cross section shown results from a different simulation. The individual cross sections shown in figs. 4 through 7 contain no vertical exaggeration. However, the absolute scales are different so that they can all be placed on one diagram. To ease comparison, the scale bar is 500 m in all cases. Note that lines illustrating profiles intermediate between initial and final profiles are not evenly spaced in time for this figure.
Under steady-state conditions of constant subsidence and sediment production, the volume of sediment added to the platform and foreslope is constant during the entire simulation. Figure 5 illustrates several examples in which only the initial relief and basin sedimentation rate were varied. (Tables 1 and 2 summarize the model inputs for figs. 5, 6, and 7.) Note that increasing the platform productivity or decreasing the slope angle results in similar changes in the final buildup profile as decreasing the initial buildup relief, the case illustrated here. Because of the volumetric constraints (see fig. 2), progradation of low-relief buildups is greater than high-relief buildups if all other variables remain unchanged. The progradation of a margin facing a starved basin decreases as a result of increasing syndepositional relief so that the platform margin position traces a typical concave-up curve in cross section. In contrast, overfed basins show increased progradation and a convex-up platform margin curve in cross section.
Table 1--Computer model inputs for diagrams in figs. 5-7. All runs used a slope angle of 25°, an initial radius of 2,000 m, and a platform productivity of 55 m/iteration. Subsidence patterns are listed in table 2.
| Run Number |
Platform Thickness | Subsidence Pattern |
Basin Fill Rate (%) |
|
|---|---|---|---|---|
| Initial (m) | Final (m) | |||
| 5A | 500 | 1,025 | 25 m/iteration | 10 |
| 5B | 500 | 1,025 | 25 m/iteration | 100 |
| 5C | 500 | 1,025 | 25 m/iteration | 130 |
| 5D | 100 | 975 | 25 m/iteration | 10 |
| 5E | 300 | 1,000 | 25 m/iteration | 100 |
| 5F | 300 | 650 | 25 m/iteration | 180 |
| 6A | 500 | 1,025 | Pattern 1 | 10 |
| 6B | 500 | 1,025 | Pattern 1 | 100 |
| 6C | 500 | 1,025 | Pattern 1 | 130 |
| 6D | 100 | 975 | Pattern 2 | 10 |
| 6E | 300 | 1,000 | Pattern 3 | 100 |
| 6F | 300 | 625 | Pattern 4 | 180 |
| 7A | 500 | 1,025 | Pattern 5 | 10 |
| 7B | 500 | 1,025 | Pattern 5 | 100 |
| 7C | 500 | 1,025 | Pattern 5 | 130 |
| 7D | 100 | 975 | Pattern 6 | 10 |
| 7E | 300 | 1,000 | Pattern 7 | 100 |
| 7F | 500 | 650 | Pattern 8 | 180 |
Table 2--Subsidence patterns for model runs in figs. 5-7. a. Note that the last subsidence rate is used one iteration less than the other rates because otherwise the extremely rapid progradation rate leads to an elongated diagram.
| Variable | Pattern Number | |||||||
|---|---|---|---|---|---|---|---|---|
| 1 | 2 | 3 | 4 | 5 | 6 | 7 | 8 | |
| First subsidence rate (m/iteration) |
50 | 50 | 50 | 50 | 12.5 | 12.5 | 12.5 | 12.5 |
| Iterations used | 1-6 | 1-10 | 1-8 | 1-4 | 1-6 | 1-10 | 1-8 | 1-4 |
| Platform thickness at change (m) |
800 | 600 | 700 | 500 | 575 | 225 | 400 | 350 |
| Second subsidence rate (m/iteration) |
25 | 25 | 25 | 25 | 25 | 25 | 25 | 25 |
| Iterations used | 7-12 | 11-20 | 9-16 | 5-8 | 7-12 | 11-20 | 9-16 | 5-8 |
| Platform thickness at change (m) |
950 | 850 | 900 | 600 | 725 | 475 | 600 | 450 |
| Third subsidence rate (m/iteration) |
12.5 | 12.5 | 12.5 | 12.5 | 50 | 50 | 50 | 50 |
| Iterations used | 13-18 | 21-30 | 17-24 | 9-11a | 13-18 | 21-30 | 17-24 | 9-12 |
Figure 5--Carbonate buildup geometries in cross section produced by MARGIN with a constant subsidence rate. In this set of simulations (and those in figs. 6 and 7) the initial buildup relief and the basin sedimentation rate were varied. The platform productivity and slope angle are identical; varying these parameters as indicated has the same overall geometric effect as decreasing the initial relief (increased progradation). The intermediate profiles represented in these simulations (and those in figs. 6 and 7) are evenly spaced in time, unlike those in fig. 4.
With a constant sediment production rate, a decrease in the subsidence rate results in less space for sediment on the platform (reduced accommodation) and a consequent increase in the volume of foreslope sediment, thus increasing progradation (fig. 6). This effect may mimic changes in sediment accumulation patterns during tectonic pulses or eustatic sea-level changes on a scale of a few million years. Note that progradation of margins with starved basins or high-relief margins is still suppressed.
Figure 6--Carbonate buildup geometries in cross section produced by MARGIN with decreasing subsidence (modeled as three decreasing subsidence rates in a stepped manner).
An increase in subsidence rate combined with a constant sediment production rate results in more sediment accumulation on the platform because of the increased platform accommodation. This reduces the sediment supplied to the foreslope and thereby decreases foreslope progradation (fig. 7). Progradation is still limited in starved basin and high-relief examples.
Figure 7--Carbonate buildup geometries in cross section produced by MARGIN with an increasing subsidence rate (also modeled as a threefold stepped history).
From the range of modeling examples, it is apparent that enhanced progradation results from various conditions: (1) lower buildup relief, (2) higher foreslope angle, (3) slower subsidence, (4) higher sediment production, (5) linear margin geometry, and/or (6) higher rates of basin deposition (fig. 3). The first two factors reflect the smaller sediment volume required to fill in the edge of a low-relief basin flanked by steeply dipping foreslopes. Factors 3 and 4 increase the rate of foreslope deposition (and thus increase progradation). A linear margin (factor 5) progrades farther than a circular buildup because sediment production is proportional to the platform area and a linear margin has a greater platform area for foreslope volume. A higher rate of basin deposition (factor 6) reduces the relief as the simulation proceeds.
In the modeling examples the syndepositional relief and the balance between the rates of platform and basin sediment accumulation are the most significant factors that determine the extent of progradation.
The model contains numerous simplifications. The interrelations between accommodation space, sediment production, transport, and deposition are not considered. However, the results present the interactions of sediment accumulation patterns and three-dimensional buildup geometry. These broad geometric considerations may be applicable to ancient examples. In the long term (several million years), shallow-water portions of carbonate platforms may reach thicknesses of several hundred meters, and many develop steep-sided margin geometries. The model results indicate that the extent of progradation into adjacent basins depends on the rate of basin filling versus platform accumulation. Starved basins ultimately become too deep for foreslope infilling in all simulations. Increasing the foreslope deposition by a factor of 2 or 3 does not maintain the progradational geometry as the relief increases from tens of meters to several hundred meters. This geometric relation suggests that the processes, thickness, and timing of basinal sedimentation (which commonly includes a significant volume of siliciclastics or evaporites) control the geometry of carbonate margins.
Despite the simplicity of the MARGIN model, the results provide insights for interpretation of ancient buildup geometries. In what follows, several examples are considered in view of the modeling results.
Typically, platform aggradation is more rapid than in adjacent basins, resulting in the formation of sediment- starved basins. Several geometric consequences follow from the increase in depositional relief. The relative rate of foreslope sediment accumulation must increase if a constant progradation angle is maintained (fig. 2) (Schlager, 1981). If the relative accumulation rate remains unchanged, progradation is progressively decreased and a concave-up profile results (fig. 5D) [see also fig. 2 of Bice (1988)].
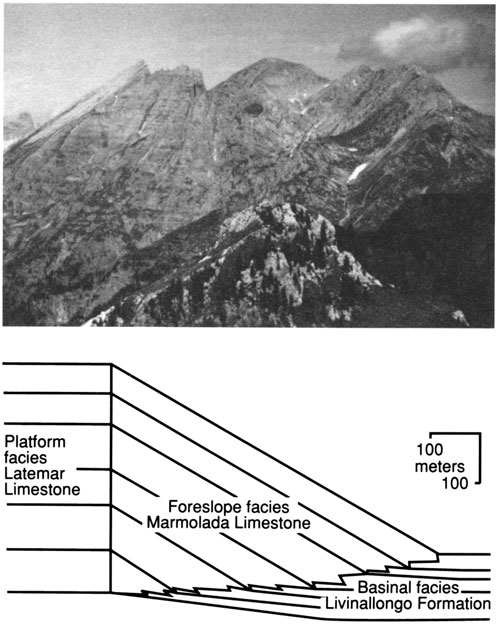
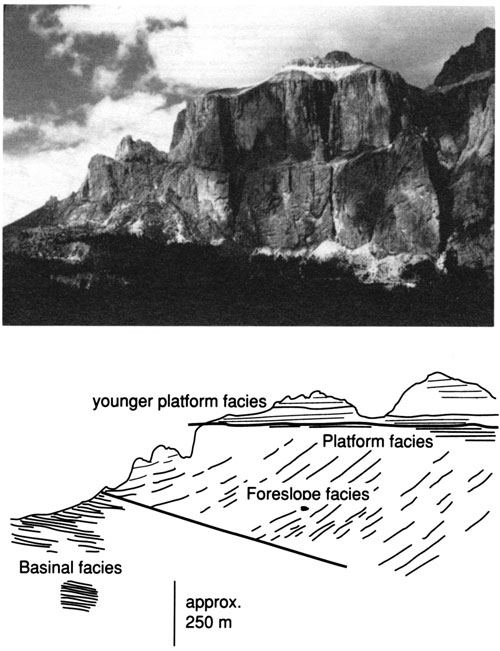
The Middle Triassic (upper Anisian to Ladinian) Latemar buildup of the Dolomites, northern Italy, is a nearly circular carbonate buildup with a vertical margin throughout most of its history (fig. 8) (Harris, 1988; Goldhammer and Harris, 1989). Platform aggradation and foreslope sedimentation were balanced, and an escarpment did not develop. At the same time low rates of basinal sedimentation resulted in increasing depositional relief. This geometry indicates that the rate of foreslope sediment accumulation increased relative to the rate of platform accumulation. The equivalent platform section records reduced accommodation because of a third-order (12-14-m.y.) eustatic sea-level cycle that caused a shift in the sediment accumulation pattern (Goldhammer and Harris, 1989). The corresponding simulation for a decrease in relative subsidence rate and starved basin section is given in fig. 5D.
Figure 8--Margin geometry of the Latemar carbonate buildup during the early and middle phases of its evolution. Photograph illustrates vertical margin geometry; sketch portrays reconstructed cross section in upper Anisian-middle Ladinian time. Note that the platform section is thicker than the equivalent basin section, indicating a progressive increase in buildup relief.
A basin that is accumulating sediment faster than the adjacent platform is the contrasting case to the starved basin examples. The geometric arguments are inverted for these overfed basins. Maintaining a constant progradation angle requires a decreasing rate of foreslope sediment accumulation as the relief decreases, but a constant relative sedimentation rate results in a convex-up margin profile (see fig. 5F).
The Middle Triassic (Carnian) Sella buildup of the Dolomites is another circular buildup similar in size to the Latemar buildup (Bosellini, 1984; Harris, 1988) (fig. 9). However, the Sella buildup exhibits increasing progradation throughout its deposition, despite the high initial relief. In this case the equivalent basinal sediments are thicker than the equivalent platform section. The progradation pattern is strongly tied to the progressive decrease in syndepositional relief. Corresponding model simulations are given in figs. 5F and 6F.
Figure 9--Margin geometry of the Sella carbonate buildup [modified from Bosellini (1984)]. Note that the platform section is thinner than the equivalent basin section, indicating a progressive decrease in buildup relief.
An intermediate case is a buildup in which the depositional relief is unchanged because the platform and basin accumulation rates are equal (e.g., fig. 5E). In these cases the progradation geometry should reflect changes in the foreslope accumulation rate or shorter-term variations in basin or platform accumulation.
The Permian reef complex of West Texas is a linear shelf margin with several kilometers of progradation during deposition of the Capitan (Guadalupian) reef (fig. 10). The overall thickness of the shelf section (Carlsbad group) matches the thickness of the basinal siliciclastics (Bell Canyon Formation) (King, 1948). Without the basinal sandstones the increased depositional relief in a sediment- starved basin would have considerably reduced progradation.
Figure 10--Reconstructed cross section through the Permian reef complex of West Texas at the end of Guadalupian time illustrating that the platform and basin sections are nearly equally thick [modified from Boyd (1958)].
The Upper Devonian barrier reef margin along the northern edge of the Canning basin contains a variety of geometries, including prograding, vertical without an escarpment, vertical with an escarpment, retreating, and backstepping (Playford, 1980, 1984). In addition, numerous pinnacle reefs formed isolated platforms that were as small as a few kilometers in diameter, comparable to the Triassic examples.
The large-scale buildup geometry consists of backstepping margins in the Frasnian and progradation in the Famennian (fig. 11). The Frasnian backstepping occurs as a series of steps, each formed by an interval of vertical escarpment formation. The initial Famennian progradation was abrupt but slowed to a nearly vertical profile. Based on Middleton's (1987) data, the rate of basin accumulation differed markedly from the Frasnian to the Famennian (table 3). The rate shifted from one-half to twice the rate of vertical platform aggradation. Playford (1980) proposed that long-term changes in relative sea level (rapid rise in the Frasnian, slow rise in the Famennian) produced the margin geometric pattern. In light of the modeling results, the thickness data suggest that increases in buildup relief were partly responsible for the Frasnian retreat. (Both the escarpment and the backstepping geometries suggest starved basin conditions, but the model results did not address this variation because the reason for backstepping versus escarpment geometries is unknown.) The abrupt shift to a prograding, concave-upward profile in the Famennian suggests that the rapid infilling occurred in early Famennian time, followed by a gradual increase in relief. Without this basin fill the progradation extent would be different because of the undiminished depth of the basin.
Figure 11--Diagrammatic cross section through the Devonian reef complexes of the Canning basin [from Playford (1980)]. Note the variations in buildup margin geometry. Actual thickness of the Frasnian basin section is about half that of the equivalent platform section, and the relative thicknesses are reversed in the Famennian section (see table 1).
Table 3--Estimated thickness of the Devonian backreef and basin rocks of the Canning basin based on seismic velocity model of Middleton (1987). Velocities are two-way travel times.
| Stage | Back-Reef Facies | Basin Facies | ||||
|---|---|---|---|---|---|---|
| Seismic Time (ms) |
Seismic Velocity (m/s) |
Estimated Thickness (m) |
Seismic Time (ms) |
Seismic Velocity (m/s) |
Estimated Thickness (m) |
|
| Frasnian | 400 | 6,000 | 1,200 | 140 | 5,500 | 385 |
| 140 | 4,500 | 315 | ||||
| Total | 700 | |||||
| Famennian | 200 | 6,000 | 600 | 300 | 6,000 | 900 |
| 100 | 5,500 | 275 | ||||
| Total | 1,175 | |||||
Carbonate margin progradation geometries reflect long-term sediment accumulation patterns. Quantification of the relative sediment volumes reveals the relative rates of sediment accumulation in platform, foreslope, and basin areas. Both outcrop examples and computer simulations indicate that changes in sediment accumulation patterns and syndepositional topography influence progradation geometry. Although many factors combined to produce a given ancient example, the ultimate extent of buildup progradation appears to depend directly on the rate of basinal deposition.
The modeling program was developed as part of my dissertation work (Harris, 1988) at Johns Hopkins University. I wish to thank Lawrence A. Hardie, Robert K. Goldhammer, Paul A. Dunn, and Nancy J. Harris for their encouragement. Reviews by Toni Simo and Fred Read helped to clarify this article.
Bice, D., 1988, Synthetic stratigraphy of carbonate platform and basin systems: Geology, v. 16, p. 703-706
Bosellini, A., 1984, Progradational geometries of carbonate platforms--examples from the Triassic of the Dolomites, northern Italy: Sedimentology, v. 3 1, p. 1-24
Boyd, D. W., 1958, Permian sedimentary facies, central Guadalupe Mountains, New Mexico: New Mexico Bureau of Mines and Mineral Resources, Bulletin 49, 100 p.
Dunn, P. A., Goldhammer, R., and Hardie, L. A., 1986, Mr. Sediment-a computer model for carbonate cyclicity (abs.): Geological Society of America, Abstracts with Programs, v. 18, p. 590
Goldhammer, R. K., and Harris, M. T., 1989, Eustatic controls on the stratigraphy and geometry of a Middle Triassic carbonate buildup, the Latemar buildup, the Dolomites, northern Italy: Society of Economic Paleontologists and Mineralogists, Special Publication 44, p. 323-338
Harris, M. T., 1988, Margin and foreslope deposits of the Latemar carbonate buildup (Middle Triassic), the Dolomites, northern Italy: Ph.D. dissertation, Johns Hopkins University, Baltimore, Maryland, 473 p.
King, P. B., 1948, Geology of the southern Guadalupe Mountains, Texas: U.S. Geological Survey, Professional Paper 215, 183 p. [available online]
Lerche, I., Dromgoole, E., Kendall, C. G. St. C., Walter, L. M., and Scaturo, D., 1987, Geometry of carbonate bodies-a quantitative investigation of factors influencing their evolution: Carbonates and Evaporites, v. 2, p. 14-42
Middleton, M. F., 1987, Seismic stratigraphy of Devonian reef complexes, northern Canning basin, Western Australia: American Association of Petroleum Geologists, Bulletin, v. 71, p. 1,488-1,498
Playford, P. E., 1980, Devonian "Great Barrier Reef" of Canning basin, Western Australia: American Association of Petroleum Geologists, Bulletin, v. 64, p. 814-840
Playford, P. E., 1984, Platform-margin and marginal-slope relationships in Devonian reef complexes of the Canning basin; in, The Canning Basin, W.A., P. G. Purcell, ed.: Proceedings of the Geological Society of Australia and Petroleum Exploration Society of Australia Symposium, Perth, p. 189-214
Read, J. F., Grotzinger, J. P., Bova, J. A., and Koerschner, W. F., 1986, Models for generation of carbonate cycles: Geology, v. 14, p. 107-110
Schlager, W., 1981, The paradox of drowned reefs and carbonate platforms: Geological Society of America, Bulletin, v. 92, p. 197-211
Spencer, R. J., and Demicco, R. V., 1989, Computer models of carbonate platform cycles driven by subsidence and eustasy: Geology, v. 17, p. 165-168
Wilson, J. L., 1975, Carbonate facies in geologic history: Springer-Verlag, New York, 417 p.
Kansas Geological Survey
Comments to webadmin@kgs.ku.edu
Web version April 27, 2010. Original publication date 1991.
URL=http://www.kgs.ku.edu/Publications/Bulletins/233/Harris/index.html