Kansas Geological Survey, Bulletin 233, p. 361-413
by
R. K. Goldhammer, E. J. Oswald, and P. A. Dunn
Exxon Production Research Company
Middle Pennsylvanian (Desmoinesian) shelf carbonates in the southwestern Paradox basin display three superimposed orders of stratigraphic cyclicity with a systematic vertical succession of facies, cycle, and sequence stacking patterns. Fifth-order cycles [34 cycles in a 645-ft (197-m) section; average 20 ft (6.1 m) thick; mean period 29,000 years] are grouped into fourth-order sequences [average 100 ft (30 m) thick; mean period 257,000 years], which in turn stack vertically to define a third-order sequence [650+ ft (200+ m) thick; 2-3 m.y. duration]. Fifth-order cycles are composed of shallow ing-upward packages of predominantly subtidal shelf carbonates with sharp cycle boundaries (either exposure or flooding surfaces). Fifth-order cycles are packaged into fourth-order sequences bounded by regionally correlative subaerial exposure surfaces. These type 1 sequences contain a downdip, restricted lowstand wedge of evaporites and quartz clastics in topographic lows on the Paradox shelf (intrashelf depressions). The lowstand systems tract is overlain by a regionally correlative transgressive shaly mudstone (condensed section) and a highstand systems tract composed of thinning-upward, aggradational fifth-order cycles. Systematic variation in the thickness of fourth-order sequences (thinning upward followed by thickening upward) and systematic variations in the number of fifth-order cycles and fourth-order sequences (decreasing followed by increasing number) defines a third-order accommodation trend that is also regionally correlative. High-frequency cycles and sequences are interpreted as predominantly aggradational allocycles generated in response to composite fourth- and fifth-order glacio-eustatic sea-level fluctuations. Two different orbital forcing (Milankovitch) scenarios are evaluated to explain the composite stratigraphic cyclicity of the Paradox sequences, each of which is plausible given Desmoinesian age estimates. The cycle, sequence, and facies stacking patterns have been replicated by means of computer modeling by superimposing composite high-frequency glacio-eustasy atop regional subsidence using depth-dependent, sedimentation.
An Acrobat PDF file containing the complete paper is available (11.4 MB).
Carbonate depositional geometries and vertical stratigraphic packaging involve a complex interplay of eustatic sea-level fluctuations, subsidence, sediment accumulation rates, antecedent depositional topography, compaction effects, and climate (Wilson, 1975; Kendall and Schlager, 1981). Of these variables, eustasy, subsidence, and sedimentation are most critical in controlling the disposition of stratal surfaces and depositional facies on shallow-water carbonate platforms [see examples given by Crevello et al. (1989)]. In most shallow shelf settings, long-term subsidence rates are essentially constant (or at least changing at a slow rate), as are rates of carbonate production and sedimentation, leaving eustasy as the prime candidate controlling carbonate stratigraphy. Long-term subsidence rates of passive margins and cratonic basins range from 1 to 25 cm (0.5-12 in.) per 1,000 yr (Schlager, 1981), and changes in these rates occur slowly (Bott, 1982). Carbonate accumulation rates [0.1-1.0 m/1,000 yr (0.3-3.0 ft/1,000 yr); Schlager, 1981] typically exceed these tectonic subsidence rates, allowing the accumulation of thick sections of shallow-water platform carbonates. Eustatic fluctuations in sea level, however, occur repeatedly at high frequencies (10,000-100,000 yr) and at rapid rates (up to 10 m (30 ft) per 1,000 yr; Schlager, 1981] that can outstrip both tectonic subsidence and carbonate production rates.
Eustatic fluctuations in sea level occur with different frequencies, yielding a hierarchy of eustasy (table 1) based on the temporal duration of the eustatic cycle [e.g. Vail et al. (1977)]. Significantly, different orders of eustasy have characteristic amplitudes and rates of change (Donovan and Jones, 1979), reflecting the driving mechanism, be it glacio-eustatic (change in the volume of water) or tectono-eustatic (change in the volume of the ocean basins). These different eustatic orders can be superimposed to give a complex succession of sea-level oscillations. This concept of composite eustasy or composite cyclicity (Suess, 1888; Grabau, 1913; Barrell, 1917) is critical in evaluating and predicting platform carbonate stratigraphy. In this regard, Goldhammer et al. (1990) concluded that the combined effects of third-order (1-10 m.y. duration), fourth-order (100,000 yr to 1 m.y.), and fifth-order (10,000-100,000 yr) eustatic cycles are of prime importance in determining the stratigraphic packaging on both the depositional sequence scale (km) and the stratigraphic cycle scale (m).
Table 1--Orders of stratigraphic and eustatic cyclicity. Data summarized from Sloss (1963), Rona (1973), Pitman (1978), Donovan and Jones (1979), Schlager (1981), Kendall and Schlager (1981), Hine and Steinmetz (1984), Miall (1984), Haq et al. (1987), Goldhammer et al. (1987, 1990), Ross and Ross (1987), and Crevello et al. (1989).
| Sequence Stratigraphic Terminology |
Eustatic Cycle (Order) |
Duration (m.y.) |
Amplitude (m) |
Rise/Fall Rate (cm/1,000 yr) |
|---|---|---|---|---|
| First | >100 | <1 | ||
| Supersequence | Second | 10-100 | 50-100 | 1-3 |
| Sequence | Third | 1-10 | 50-100 | 1-10 |
| Sequence, cycle | Fourth | 0.1-1 | 1-150 | 40-500 |
| Parasequence, cycle | Fifth | 0.01-0.1 | 1-150 | 60-700 |
In consideration of the existence of superimposed orders of relative sea-level oscillations, Goldhammer et al. (1990) suggest that a hierarchy of stratigraphic-forcing exists that is largely dependent on the periodicity and relative amplitude ratio of superimposed relative sea-level fluctuations. In this hierarchical scheme the lower-frequency sea-level cycles dictate the stratigraphic recording of the higher-frequency sea-level cycles, producing by this interaction a systematic internal architecture to the stack of higher-frequency depositional cycles. This relationship follows from the empirical observation that the rates of change of the higher-frequency sea-level oscillations (fourth- and fifth-order) are typically much greater than those of the lower-frequency fluctuation (third-order), principally because of the differences in their causative mechanisms, that is, glacio-eustasy for the fourth- and fifth-order changes but tectono-eustasy for the third-order changes [see Rona (1973), Pitman (1978), Donovan and Jones (1979), Schlager (1981), Miall (1984), and Haq et al. (1987)].
As pointed out by Wilson (1975), carbonate sedimentation is characterized by two unique factors that distinguish it from siliciclastic sedimentation; carbonate sediment production and accumulation are (1) depth dependent and (2) autochthonous. As such, carbonate platforms faithfully record relative sea-level changes and are ideal accommodation gauges (Kendall and Schlager, 1981). In carbonate systems, then, it is logical that the hierarchy of stratigraphic forcing will result in organized stacking patterns (thickness, facies character, and early diagenetic attributes) of high-frequency shallow-water carbonate cycles dictated by low-frequency relative sea-level effects. Systematic vertical and lateral changes in stacking patterns of high-frequency cycles within a larger depositional sequence are due to systematic and predictable differences in depositional space available during the rising and falling stages of low-frequency relative sea-level change (Goldhammer et al., 1990).
The Middle Pennsylvanian cyclic stratigraphy of the Paradox basin in southeast Utah provides an ideal laboratory for investigating the validity and ramifications of these concepts. This basin system is characterized by three superimposed orders of stratigraphic cyclicity generated by three different orders of superimposed relative sea-level changes. This has resulted in a composite stratigraphy made up of systematic cycle stacking patterns and accompanying vertical facies succession.
The Pennsylvanian Period is renowned throughout the world for the numerous examples of cyclic sedimentation involving carbonates and clastics. For example, the origin of the midcontinent cyclothems has been debated for over 50 years, and both autocyclic [e.g., Weller (1964)] and allocyclic models have been proposed [e.g., Heckel (1989)]. Allocyclic models draw support from evidence that the Pennsylvanian Period was a time when major ice sheets dominated the geologic record (Crowell, 1978), and thus there exists the strong probability that glacio-eustasy (related to Milankovitch climatic cycles) was operating (Heckel, 1986). Because of eustatic oscillations in sea level during this period, we can investigate the relation between eustatic rhythms and the resultant stratigraphic cycles.
The cyclic stratigraphy and facies of the Paradox shelf and basin incorporate a mixed lithologic system of carbonates, siliciclastics, and evaporites that can be interpreted in light of a cyclic model of deposition. It is possible to address not only the problem of carbonate cyclicity but also that of mixed carbonate-clastic depositional cycles, a recurring Pennsylvanian theme. The scale of the outcrop and the correlation to the subsurface also provide a basis for integrating sequence stratigraphy with models of cyclic carbonate deposition.
The Paradox basin is a northwest- southeast-trending asymmetric evaporite basin of Pennsylvanian age located in southeastern Utah and southwestern Colorado (fig. 1). The regional geology and tectonic evolution of this area have been reviewed by Peterson and Hite (1969), Stevenson and Baars (1988), and Baars (1988). Both the Paradox and the Eagle basin (juxtaposed on either side of the Uncompahgre uplift) form prominent northwest-trending structural troughs that developed as part of the crustal disturbance that created the ancestral Rockies (fig. 2). The most current interpretation of the tectonic development of the Paradox basin is that of a pull-apart basin formed primarily by right-lateral extension along two northwest- southeast-oriented master faults (Stevenson and Baars, 1988).
Figure 1--Isopach and facies map of the Pennsylvanian System of the Paradox and Eagle basins. Isopachs in feet. Modified from Peterson and Hite (1969). Large arrow in lower left-hand quadrant marks location of the Honaker Trail.
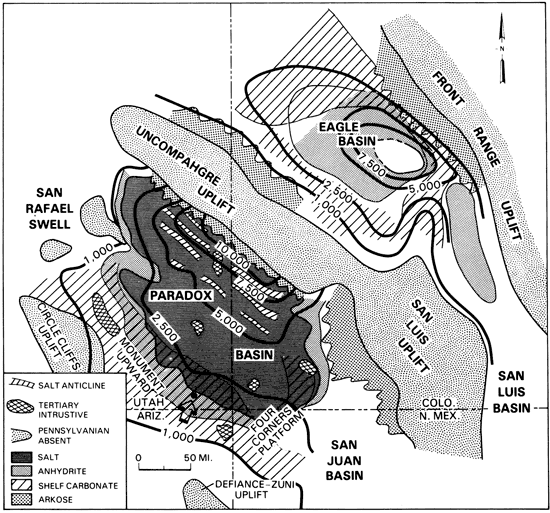
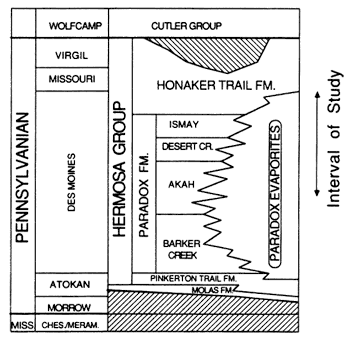
Figure 2--Pennsylvanian chronostratigraphy of the Paradox basin. Modified after Baars and Stevenson (1982).
In Desmoinesian time the basin was actively subsiding, and up to 5,000 ft (1,500 m) of bedded salt accumulated in the basin center of the restricted Paradox basin (figs. 1 and 3). The halite facies changes to anhydrite facies at the updip limit of the restricted basin. The evaporites, in turn, onlap against the flanks of the extensive Paradox carbonate shelf, located primarily south and west of the basin center. The general regional trend of depositional strike within the southwest Paradox shelf is northwest-southeast. The restricted nature of the Paradox basin resulted from the existence of uplifts that bounded the basin. In a restricted area to the northeast, near the fault-bounded Uncompahgre uplift, up to 15,000 ft (4,600 m) of coarse clastics accumulated. To the south and southwest marginal marine to nonmarine clastics accumulated against the northeast side of the Defiance-Zuni and Circle Cliffs uplifts (fig. 1). To the northwest the Emery uplift persisted in the vicinity of the modern San Rafael swell. The only accessible, unrestricted pathways to the open sea (located to the west and south) were to the southeast (the Cabezon seaway; Hite, 1970) and the southwest (Peterson and Hite, 1969). The dominantly cyclic nature of the Paradox carbonate shelf and the cyclic evaporite-shale deposits in the basin center was the result of oscillations in relative sea level, which drove flooding across the narrow seaways of the Paradox shelf, followed by restriction with exposure of the shelf and evaporite deposition in the basin center. Thus the Paradox carbonate shelf during times of lowered relative sea level acted as a topographic barrier that restricted influx of normal seawater into the evaporite basin (Peterson and Hite, 1969; Hite, 1970).
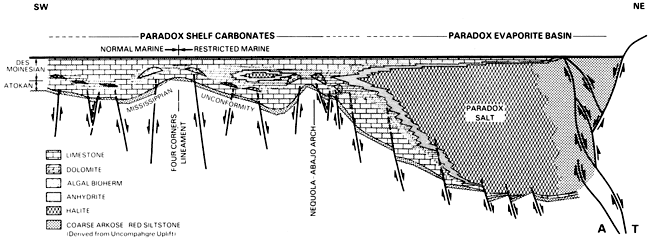
Figure 3--Generalized southwest-northeast cross section across the Paradox basin illustrating the gross facies relations between Middle Pennsylvanian shelf carbonates, basinally restricted evaporites, and coarse clastics proximal to the Uncompahgre uplift. Modified from Baars (1988).
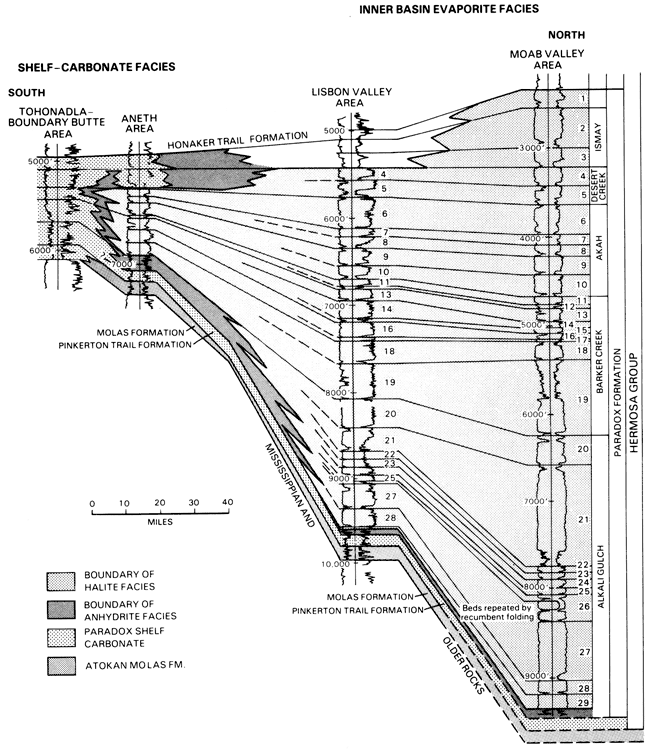
The pre-Pennsylvanian stratigraphy across the Colorado plateau is marked by a relatively thin section [<2,000-2,500 ft (<600-760 m) thick; Ohlen and McIntyre, 1965] that records widespread stable shelf conditions. Late in Mississippian time the shelf underwent broad regional uplift and emergence, resulting in exposure and dissolution of Mississippian carbonates with the development of an extensive red paleosol. The base of the thick Pennsylvanian section [3,0004,000 ft (900-1,200 m) thick on the Paradox shelf; Ohlen and McIntyre, 1969] includes the Atokan Molas Formation (reworked soil material) and the Pinkerton Trail formation (mixed clastics and carbonates), which mark the initial marine transgression into the Paradox basin (fig. 2). According to Stevenson and Baars (1988), extensional faulting and rapid basin subsidence started at this time (Desmoinesian). The Pinkerton Trail formation, the Desmoinesian Paradox formation, and the Desmoinesian-Virgilian Honaker Trail formation compose the Hermosa group. The Desmoinesian section contains the Paradox formation basinal evaporites and their shelf equivalent, which consists of carbonate and secondary interbedded siliciclastics. The basinal evaporite section contains 29 salt-shale cycles (Peterson and Hite, 1969) that decrease in number laterally as the lower cycles onlap updip into the shelf sections, where equivalent carbonate-shale cycles are recognized (fig. 4) (Peterson and Hite, 1969).
Figure 4--Correlation of well logs across the Paradox basin showing relations between shelf carbonate facies and basinal anhydrite and halite facies. Note the 29 evaporite-shale basinal cycles of the Paradox formation. These regionally correlative cycles equate to the fourth-order depositional sequences recognized at the Honaker Trail section. Modified from Peterson and Hite (1969).
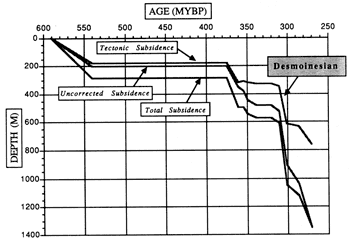
Subsidence analysis of the Paleozoic section from the Paradox shelf illustrates the tectonic development of the area (fig. 5). This analysis employs a simple one-dimensional Airy model in which the lithosphere responds to sediment loads by local isostatic adjustments. The backstripping procedure used here was outlined by Steckler and Watts (1978) and Bond and Kominz (1984). Following the pre-Pennsylvanian phase of general stability, the Desmoinesian Paradox shelf experienced increased rates of subsidence in response to the development of the Marathon-Ouachita convergent orogenic front located to the south (Pindell and Dewey, 1982; Ross, 1986). This trend continued through the Wolfcampian. Despite this pulse of increased subsidence, Paradox shelf carbonates easily kept pace with subsidence.
Figure 5--Subsidence analysis of Paradox shelf based on age-depth pairs from the Texaco Johns Canyon no. 1 well located in San Juan County, Utah (R. 18 E, T. 41 S.; sec. 6). Paleozoic time scale is that of Harland et al. (1982). Tectonic subsidence curve depicts nonisostatic basement subsidence. Uncorrected subsidence curve depicts modern rock thickness versus time. Total subsidence curve includes the contributions to subsidence by sediment loading, compaction, paleobathymetry, and basement subsidence. Initiating in the Desmoinesian, the Paradox shelf experienced increased tectonic subsidence in response to the Marathon-Ouachita orogenic event to the south.
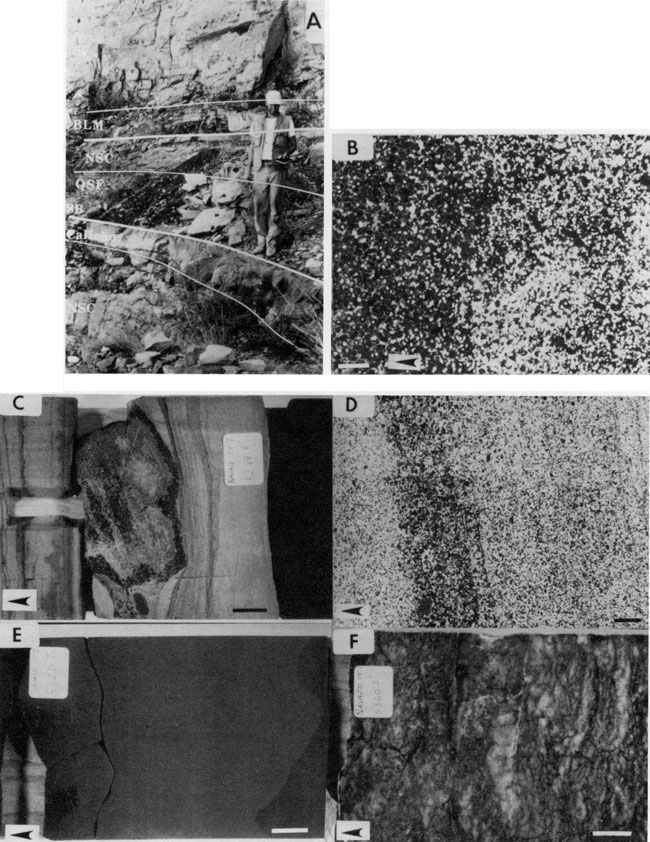
Initially we measured, described, and sampled a continuous Middle Pennsylvanian section exposed along and near the Honaker Trail in the San Juan Canyon in the Goosenecks area, southeast Utah (fig. 6). Our section begins in the upper part of the Akah interval of the Paradox formation (middle Desmoinesian) and ends within the Honaker Trail formation at the top of the Desmoinesian (figs. 7-11). This section has been measured and described by Wengerd (1963 and references therein) and in part by Pray and Wray (1963) and Hite and Buckner (1981). The outcrop section was then correlated to the subsurface with well logs, which provided regional stratigraphy (figs. 6, 12, and 13). At the McElmo Creek field [located 45 mi (72 km) east of the Honaker Trail section; fig. 6), which is part of the greater Aneth field], a series of cores from the Desert Creek interval of the Paradox formation were described in detail to delineate the transition from shelf carbonates to lowstand evaporites and siliciclastic deposits that accumulated in topographic lows (or intrashelf depressions) on the Paradox shelf (fig. 14).
Figure 6--Locations of well logs used in construction of two regional cross sections (figs. 12 and 13).
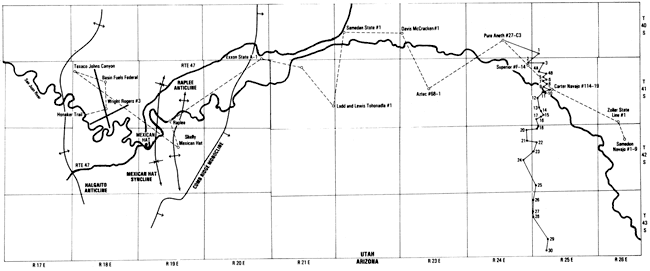
Figure 7--Panoramic view of the Middle Pennsylvanian section exposed at the Honaker Trail on the east side of the San Juan River. Fourth-order sequence boundaries are marked by white lines. Note the third-order accommodation cycle marked by progressive thinning-upward of fourth-order sequences (from HT1 to HT5) followed by progressive thickening-upward of fourth-order sequences (HT6-HT8). Total vertical section exposed is approximately 1,300 ft (400 m).
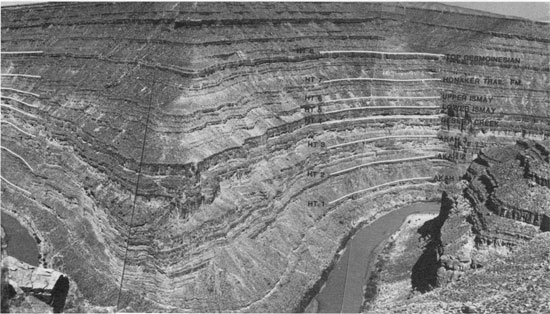
Figure 8--Panoramic view of the canyon wall on the west side of the San Juan River directly across from the Honaker Trail measured section. Fourth-order sequence boundaries and fifth-order cycles are marked and have been correlated with the Honaker Trail measured section.
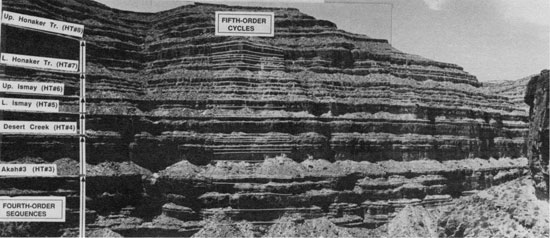
Figure 9--Panoramic view to the southwest of that shown in fig. 8. Fourth-order sequence boundaries and maximum flooding surfaces (MFS) are labeled. Note laterally discontinuous drape of quartz sandstone, filling irregular, incised topography atop the HT3 sequence boundary (arrows, lower left). Note also truncated tops to algal bioherms overlain by quartz sandstone (QSF) in the lower Ismay sequence (arrow, center right).
Figure 10--Simplified stratigraphy of the Honaker Trail section and Fischer plot emphasizing fifth-order cycle stacking patterns within fourth-order sequences. Fifth-order cycles marked with an asterisk are exposure cycles (see text). On the Fischer plot the horizontal axis represents relative time and individual fifth-order cycles are plotted as triangles evenly spaced along the axis, on the assumption that each cycle is of equivalent duration. The vertical axis is the Honaker trail measured section, and the straight line that connects the base of the stratigraphic section to time zero is the mean subsidence vector, depicting net subsidence. The changes in slope over the entire string of cycles reflects deviations in long-term accommodation.
Figure 11--(A) Facies and lithology key for Honaker Trail measured section and McElmo Creek core description (fig. 14). Attributes shown include moldic porosity, percentage of silt, lithology, grain types, and sedimentary structures. Refer to text for facies code. (B) Stratigraphic section measured along the Honaker Trail, southeast Utah. Refer to fig. 7 for a view of the Honaker Trail section.
Figure 12--Regional west-east cross section tying Honaker trail section (this study) to the subsurface. Fourth-order sequence boundaries are thick solid lines. Dashed lines in sequences HT4 and HT5 denote the top of the transgressive systems tract. Note the existence of an evaporite-rich lowstand deposit filling in a paleotopographic low, and note the updip pinchout of onlapping lowstand to transgressive deposits in sequences HT4 and HT5. Thin solid lines in the lowstand wedge denote basinally restricted higher-frequency fifth-order cycles. Note Raplee anticline section from Wengerd (1963). [Larger version of this figure available in the PDF of this article.]
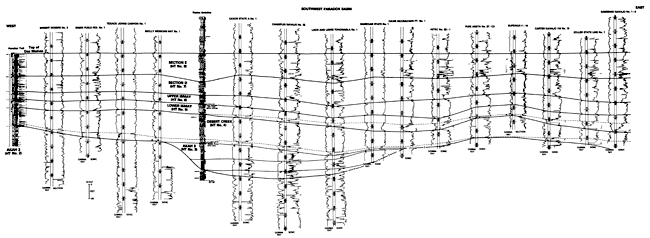
Figure 13--Regional north-south cross section across McElmo Creek (Aneth field). Fourth-order sequence boundaries are solid lines. The thin dashed line denotes the top of the fourth-order transgressive systems tract (maximum flooding surface). In the lower Ismay sequence there are two additional dashed lines within the lowstand systems tract: the lower long-dashed line marks the top of the anhydrite restricted depositionally to topographic lows; the upper short-dashed line denotes the top of the upper sandstone portion of the wedge. Note the existence of a fourth-order lowstand wedge within the upper Ismay, also containing a lower anhydrite layer and an upper sandstone portion. Lithologies are confirmed by core control. [Larger version of this figure available in the PDF of this article.]
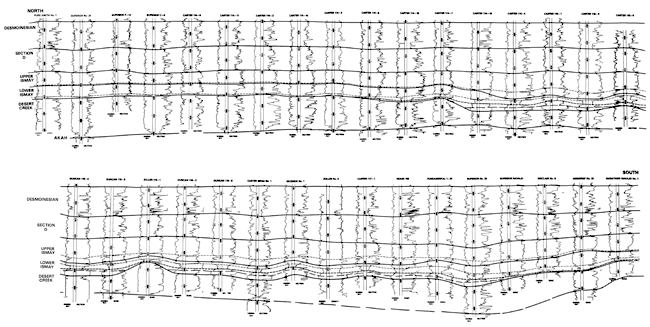
Figure 14--Detailed north-south shelf-to-basin cross section of the Desert Creek interval (sequence HT4). The location of the cored wells used to construct this cross section are shown in fig. 13. Thick lines at the base and top are fourth-order sequence boundaries. Shoaling-upward fifth-order cycles are marked by thin lines. Lithology key illustrated in fig. 11A. [Larger version of this figure available in the PDF of this article.]
Based on our interpretation of the cyclic stratigraphy, we divided the outcrop and subsurface stratigraphy into regionally correlative depositional sequences (figs. 10 and 11). The sequences were assigned numbers HT1 through HT8 to note that they were first recognized at the Honaker Trail section.
The Honaker Trail section and the McElmo Creek cores consist of several distinctive depositional facies (fig. 11) that are described and interpreted in what follows and summarized in table 2.
Table 2--Summary of Paradox facies.
| Facies Designation |
Quartz Sandstone Facies |
Black Laminated Mudstone |
Sponge Facies |
Intermediate Facies |
Algal Facies | Skeletal Cap Facies |
Nonskeletal Cap Facies |
Caliches or Subaerial Exposure Surfaces |
|---|---|---|---|---|---|---|---|---|
| Bedding and sedimentary structures | Laterally discontinuous lenses to continuous sand sheets (<1-5 ft thick); med.-scale, wedge-shaped, low-angle trough crossbedding; ripple cross-lamination; burrows; mudcracks | Thin (<1-2 in. thick), varvelike, even, planar lamination | Undulatory to nodular thin bedding; fine (<1-2 in. thick) wispy to planar lamination; slump features | Undulatory, thin to medium bedding; burrow mottling | Flat-based, convex-up mounds (20-40 ft thick; 30-90 ft long); internally massive core; mound flanks display low-angle accretionary bedding; laterally adjacent to intermediate facies | Medium to thick bedding; small-scale low-angle trough cross-stratification; ripple cross-lamination; burrows | Medium to thick bedding; medium trough cross-stratification; planar cross-stratification; wave and current ripple cross-lamination; hardground surfaces | Laterally discontinuous, irregular laminated, thin (<2-6 in. thick) crusts; subvertical cracks and subcircular vugs and pipes lined with laminated brecciated carbonate |
| Rock type and depositional texture | Calcareous siltstones to sandstones; coarse silt to to very fine sand sized quartz; very well sorted, angular to subrounded; no clay fraction | Dolomitic shales to silty carbonate mudstones | Argillaceous, cherty carbonate mudstone to calcareous siltstone | Silty mudstone-wackestone with local coarse packstone lenses | Grain-supported algal bafflestones and algal-rich wackestones; mound flank to foreslope lithoclastic wackestone to packstone | Wackestone to dominantly packstone; medium to coarse sand sized allochems | Packstone to dominantly grainstone; well-sorted, medium to coarse sand sized allochems | Wackestone to packstone |
| Grain types | Quartz sand; 10-30% carbonate peloids, ooids, skeletal material (worn, abraded, well-sorted); angular carbonate lithoclasts; trace glauconite | High organic content (sapropelic); quartz silt (35%), clays (15-25%), carbonate peloids (20%); rare conodonts, bone fragments, fish teeth, thin-shelled phosphatic brachiopods | Quartz silt (<5-40%); clays (<5-10%); carbonate peloids; siliceous sponge spicules; rare echinoids, phosphatic brachiopods, conodonts | Normal marine skeletal grains (crinoids, brachiopods, bryozoans, fusulinids, corals, foramininfers) and peloids; up to 30% quartz silt | Phylloid algae (Ivanovia) form framework; admixed peloids and normal marine skeletal grains, intraclasts | Abundant worn, abraded normal marine skeletal grains (crinoids, brachiopods, fusulinids, bryozoans); encrusting foraminifers (opthalmidids); micritized grains | Abundant nonskeletal allochems (ooids, peloids, oncolites, intraclasts, coated grains); admixed abraded skeletal debris; 5% rounded quartz sand | Micritic peloids, angular black litho- clasts and micritic lumps; admixed quartz silt; altered primary carbonate (micritized) |
| Conspicuous early diagenetic phenomena | Mechanical compaction | Mechanical compaction | Syndepositional "auto-brecciation" of algal wackestone; fabric-selective dissolution of phylloid algal plates and solution-enlarged porosity; meteoric, phreatic cementation | Minor fabric-selective, solution porosity | Solution-enlarged, moldic porosity (leached ooids, peloids, mollusks); freshwater phreatic cementation and neomorphic recrystallization | Moldic, solution-enlarged porosity; neomorphic recrystallization; extensive micritization; geopetal, internal sediment; primary grain alteration | ||
| Depositional environment | Transported during lowstands of sea level by eolian processes, modified by marine overprint with ensuing transgression; shallow-marine high-energy shoreface deposition | Deeper subtidal (>35 m water depths) deposition under marine reducing conditions; minimum water turbulence; quiet, toxic bottom conditions | Deep subtidal (25-35 m water depths), anaerobic to dysaerobic deposition under restricted, hypersaline conditions | Moderately shallow (5-25 m water depths), well-oxygenated, normal marine deposition | Moderately shallow (5-20 m water depths), well-circulated, oxygenated, normal marine deposition | Shallow subtidal to near shoal-water deposition (0-5 m water depths) | High-energy, very shallow subtidal to lower intertidal shoal-water deposition (0-5 m water depths) | Subaerial exposure horizons with alteration of primary carbonate; caliche formation |
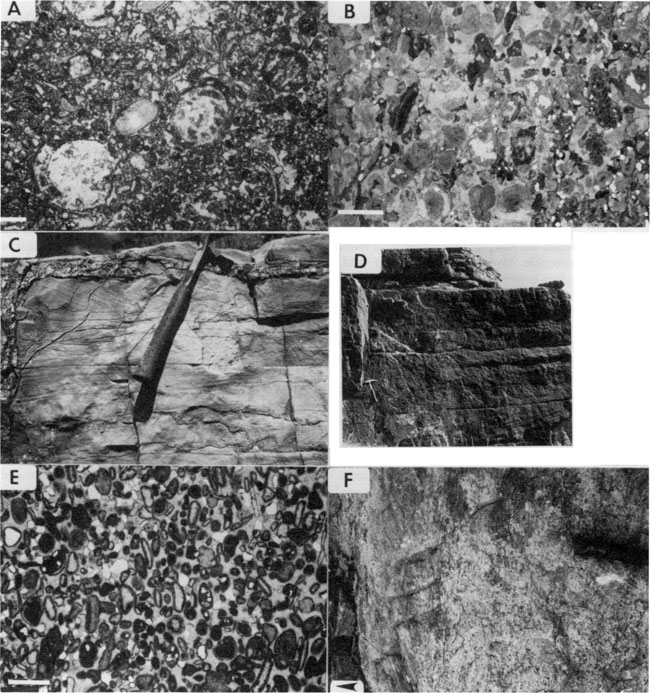
Roughly 10% of the Honaker Trail measured section (fig. 11) consists of light-gray and tan calcareous siltstones and sandstones. The grain size ranges from coarse silt to fine sand (50-150 µm diameter), typically occurring as well-sorted, angular to subrounded, very fine quartz sand (60-120 µm diameter) with essentially no clay fraction (figs. 15A,B and 16D). The QSF contains 10-30% calcareous material, usually in the form of admixed well-sorted, abraded carbonate peloids, ooids, or worn skeletal debris (fig. 15B). Significant trace components (total <1-2%) include glauconite peloids, worn phosphatic skeletal debris, and deformed flakes of sericite.
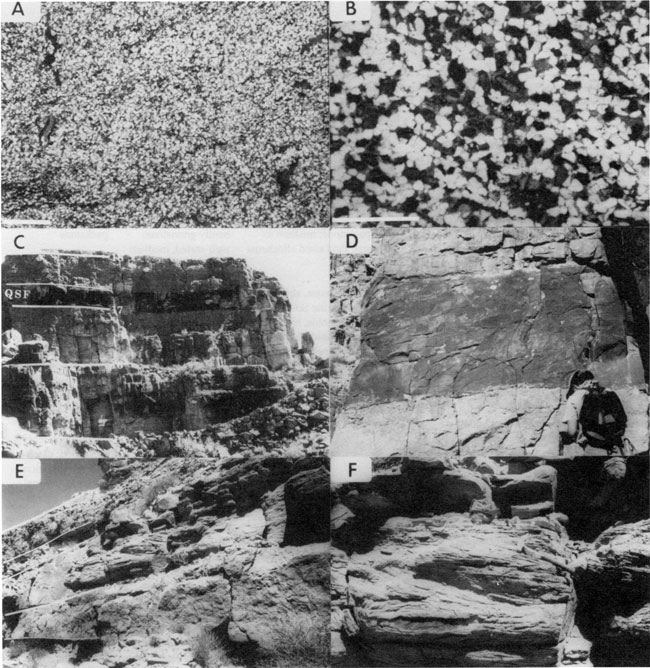
Figure 15--(A) Well-sorted, coarse siltstone to very fine sandstone composed of subangular quartz, with admixed minor sericite, glauconite, and carbonate debris. Quartz sandstone facies (unit E9), cycle 29 of the Honaker Trail section; thin section photomicrograph (scale bar = 1 mm). (B) Calcareous, very fine grained sandstone composed of subrounded to subangular quartz and carbonate ooids and peloids. Quartz sandstone facies (unit F11), cycle 11 of the Honaker Trail section; thin section photomicrograph (scale bar= 0.5 mm). (C) Quartz sandstone facies forming the lower part of cycle 18 of the Honaker Trail section. Note the flat, sharp lower and upper bounding surfaces. This particular unit forms a laterally continuous widespread sheet traceable along the entire length of the canyon exposures. Cycles 17 and 18 are exposure cycles; cycle 16 is a subtidal cycle (see text). (D) Close view of trough crossbedded quartz sandstone in cycle 18. Note sharp lower and upper bounding surfaces. (E) Trough crossbedded quartz sandstone in the lower part of cycle 21 [18 ft (5.5 m) thick], sharply overlying carbonate grainstone cap of cycle 20. Both cycles 20 and 21 are exposure cycles (see text). (F) Close view of trough crossbedded sandstone in cycle 21 illustrating wedge-shaped sets. Hammer for scale.
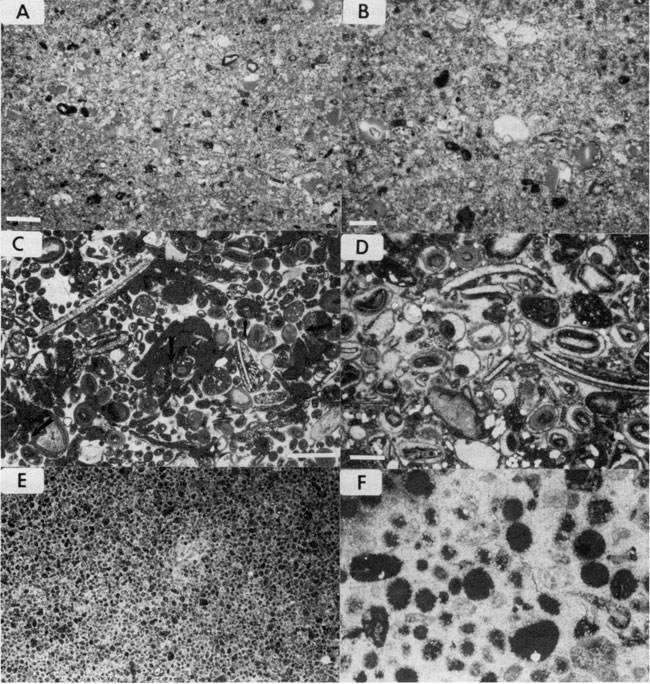
Basal contacts of this facies atop underlying carbonate facies are always knife sharp (figs. 15C,D and 16G) and commonly are erosional, as evidenced by truncation of underlying carbonate fabrics and truncation of individual algal bioherms and beds onlapping the biohermal flanks (fig. 17A). In addition, eroded, angular, centimeter-size cemented lithoclasts (with truncated depositional fabrics and sparry calcite cements) occur immediately above basal contacts (fig. 16A). Upper contacts are either sharp, with no evidence of truncation or erosion, or more commonly gradational into overlying silt-rich carbonate facies.
Figure 16--(A) Poorly sorted, very fine grained, calcareous sandstone composed of quartz and carbonate lithoclasts. Lithoclasts consist of early-cemented grainstones (note truncated cements along their margins) derived from the top of the underlying carbonate layer. Quartz sandstone facies (unit A 10) at base of cycle 18 of the Honaker Trail section; thin section photomicrograph (scale bar = 1 mm). (B) Mud-filled anastomosing tube within calcareous sandstone (quartz sandstone facies), interpreted as Ophiomorpha burrows. Honaker Trail section. (C) Thin-bedded, rippled, very fine grained quartz sandstone. Lenticular, laterally discontinuous nature of ripples and recessive, finer-grained interlayers are suggestive of tidal flat deposition (see text). Unit H3, base of cycle 8, immediately above the HT3 sequence boundary. This same unit is illustrated in fig. 19A. (D) Cross-laminated calcareous siltstone composed of well-sorted quartz silt to very fine grained sand, interlayered with silt-sized carbonate peloids. Quartz sandstone facies (unit H3); thin section photomicrograph (scale bar = 1 mm). (E) Millimeter-scale, flat to undulatory laminated, calcareous sandstone composed of very fine grained quartz sand (light) and layers rich in carbonate peloids and abraded skeletal debris (dark). Quartz sandstone facies, Navajo Carter well 115-1 (5313.4 ft). Scale bar = 1 cm. (F) Wavy-laminated calcareous siltstone with desiccation cracks marked by raised ridges. Cross-sectional view of unpolished slab; scale bar = 4 cm. Quartz sandstone facies (unit E1), base of cycle 26. (G) Laterally discontinuous drape of sandstone resting immediately above top of sequence HT3. Details of this unit are illustrated in figs. 16C,D. This unit is in erosional contact with the underlying carbonate unit (a caliche; see figs. 22C,D) and is interpreted as a reworked clastic unit delivered during fourth-order lowstand (by eolian transport) but overprinted during the fourth-order transgression (see text). Scale bar = 10 ft.
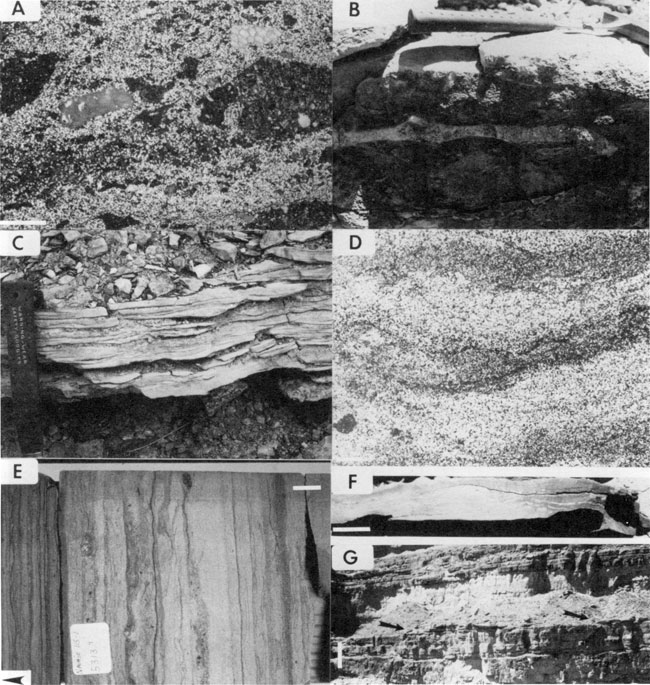
Figure 17--(A) Algal bioherms (above arrows) in the lower Ismay interval [lower and upper boundaries of sequence HT5 marked; sequence 56.5 ft (17.2 m) thick]. Note morphology of the mounds and intermound depressions. Tops of the mounds and mound-flank strata are truncated and overlain by sandstone sheet (unit A 10). (B) Polished slab of phylloid-algal packstone composed of irregular platy, leaflike particles (dark thin lines) in a matrix of lighter-colored micrite. Note minor porosity development. Unit A6 top, cycle 17. (C) Phylloid-algal grainstone consisting of leached and recrystallized phylloid plates and scattered bryozoan debris and encrusting foraminifers. Individual phylloid plates are delineated by darker micritic rims. Interparticle and moldic porosity [leached phylloids (arrows)] is partly to totally occluded by bladed to equant blocky calcite. Algal facies (unit A6, top); thin section photomicrograph (scale bar = 1.5 mm). Blue epoxy (gray in photo) fills porosity. (D) Closer view of phylloid-algal grainstone illustrating coarsely crystalline, bladed to equant calcite cement, plus neomorphosed phylloid plates (arrows). Algal facies (unit A6, top); thin section photomicrograph (scale bar = 1 mm). (E) Phylloid-algal grainstone with well-developed, solution-enlarged, interparticle porosity. Individual phylloid plates are outlined by dark thin lines, which are micritized outer grain boundaries. Moldic and interparticle porosity largely occluded by coarsely crystalline, bladed to equant sparry calcite. Algal facies, Navajo Carter well 114-9 (5,696 ft, core depth). Scale bar = 2 mm. (F) Phylloid-algal wackestone-packstone with molds of phylloids filled with sparry calcite (arrows). Matrix material between algal plates is peloidal packstone. Note shelter and interparticle pores infilled with sparry calcite cements. Large intraclasts are probably generated in place by brecciation (see text). Algal facies (unit A6, base); thin section photomicrograph (scale bar = 2 mm).
In outcrop these clastic intervals form laterally discontinuous lenses (figs. 9 and 16G) and continuous flat sand sheets that tend to be bounded on top and bottom by parallel, planar bedding surfaces (figs. 15C,D). The sandstone immediately above the Akah interval (upper HT3 sequence boundary) occurs as laterally discontinuous lobate lenses [<3 ft (<0.9 m) thick] that are 50-150 ft (15-46 m) across and fill local incised depressions in the Akah (fig. 9). In contrast, a prominent sandstone layer [3 ft (0.9 m) thick] in the Lower Ismay interval (unit A 10 in fig. 12) can be traced laterally for several miles.
Internally, this facies displays a variety of sedimentary structures, and two distinct subfacies can be discerned based on the characteristic suite of sedimentary structures. The first subfacies (QSF1) is characterized by medium-scale, wedge-shaped, low-angle (<5°-10°) trough crossbedded sets [typically 1-3 ft (0.3-0.9 m) thick] with sharp set boundaries (figs. 15D-F). Lower set boundaries truncate laminations of subjacent sets and are possible reactivation surfaces. Individual sets persist laterally from 10 to 15 ft (3-4.6 m). Internal stratification within sets consists of distinct millimeter- to centimeter-size inclined laminations defined by alternating layers of carbonate-rich sand and siliciclastic sand. Laminations are planar to convex-up and exhibit tangential curved basal contacts with set boundaries. Adjacent sets may have foreset laminae inclined in opposite directions (bidirectional). Small-scale tabular, planar crossbedded sets [<1 ft (<0.3 m) thick] are a less common, although conspicuous, feature of this subfacies. This subfacies also contains zones of bioturbation, which commonly occur near the top of the sand bodies. The most obvious biogenic structures are mud-filled anastomosing tubes of constant diameter [1-2 in. (2.5-5 cm)] that show variable orientation with respect to bedding (fig. 16B). Their nodose, pelleted exterior suggests that they are Ophiomorpha burrows (O. nodosa; Driese and Dott, 1984).
The second subfacies (QSF2) lacks the larger-scale trough crossbedding and is marked by finer-scale sedimentary structures. Thin-bedded [individual layers <1-2 in. (<2.5-5 cm) thick], small-scale, low-angle ripple cross -lamination is common and is composed of form-discordant starved ripples and lenticular thin beds (figs. 16C,D). Individual ripples form concavoconvex lenses, and both symmetric (wave ripples) and asymmetric (current ripples or current-modified ripples) forms are observed. Finer-grained thin interlayers resemble wavy to flaser thin bedding (Reineck, 1975; Reineck and Singh, 1980), and in thin section darker foreset laminae of ripples consist of fine silt-sized peloidal carbonate. The other diagnostic lithology of this subfacies is millimeter-size flat laminated to wavy laminated siltstone (figs. 16E,F) disrupted by mud-filled, centimeter-wide polygonal cracks with upturned edges (mudcracks). Burrows are rare in this subfacies.
In general terms the quartz sandstone facies is interpreted to have been deposited during lowstands of sea level by eolian transport and subsequently modified with a marine overprint during subsequent transgression. Specifically, the QSF1 subfacies is interpreted as marine in origin, based on the presence of admixed normal marine skeletal debris, glauconite peloids, phosphatic skeletal remains, Ophiomorpha burrows, and other bioturbated fabrics. Further support for this interpretation stems from the observation that this subfacies grades vertically upward within fifth-order cycles into either intermediate facies or skeletal cap facies (both interpreted as shallow marine facies; see later text) and that bioturbation within the QSF1 subfacies is most prominent at the upper boundary. In addition, the presence of detrital flakes of sericite (muscovite) suggests water-lain sedimentation, as this detrital component is readily winnowed out in an eolian regime (Candelaria, 1989).
The lack of diagnostic eolian sedimentary structures (e.g., large-scale, high-angle crossbedding, "translatent" stratification, adhesion ripples) likewise indicates marine deposition. Such features, however, are common in other fine-grained quartz sandstones within similar upper Paleozoic mixed siliciclastic and shallow marine carbonate strata (Houlik, 1973; Driese and Dott, 1984; Loope, 1985). The high degree of sorting and very fine sand to coarse silt size suggest that fluvial transport and deposition was unlikely during semi-arid to and Paradox time. The low-angle trough crossbedding and planar crossbedding probably reflect deposition in the shoreface zone of a high-energy nearshore environment. Analogous fossiliferous calcareous quartz sandstones that occur cyclically interbedded with shallow marine carbonates have been described from the Morgan Formation (northern Utah and Colorado, Middle Pennsylvanian; Driese and Dott, 1984) and the northwest shelf of the Delaware basin (Middle Permian) (Candelaria, 1989; Borer and Harris, 1989). Both deposits have been interpreted as having marine origins on the basis of similar evidence.
Rocks of the QSF2 subfacies, marked by rippled thin beds and mudcracked thinly laminated siltstone, are interpreted as shallow subtidal to intertidal deposits. Lenticular starved ripples, interlaminated siliciclastic sand and carbonate mud, and mudcracks are all observed on Holocene sandy tidal flats (Reineck, 1975; Reineck and Singh, 1980). Similar mudcracked planar to wrinkly laminated sandstones in the Middle Pennsylvanian Morgan Formation have been interpreted as interdune deposits by Driese and Dott (1984) [see also the "erg" interpretation of backreef laminated siltstones in the northwest shelf of the Middle Permian Delaware basin by Mazzullo and Hedrick (1985)]. However, these rocks are intercalated with demonstrable eolian sandstones.
Although the quartz sandstone facies is interpreted as shallow marine to intertidal, it is important to distinguish the final environment of deposition from the actual delivery mechanism of these clastics. As stated earlier, this facies is interpreted to have been deposited during lowstands of sea level by eolian transport and subsequently modified with a marine overprint during later marine transgression. Similar Pennsylvanian and Permian deposits in mixed clastic and carbonate strata have been interpreted as eolian. Thin quartzose siltstones to very fine grained sandstones that are interbedded with backreef carbonates on the northwest shelf in the Delaware basin provide one example. Many researchers favor an eolian interpretation linked to sea-level lowstands and progradation of dune complexes across the shelf, ultimately feeding the onlapping basinal deposits (Silver and Todd, 1969; Mazzullo et al., 1985; Fischer and Sarnthein, 1988). Others, however, favor the subaqueous transport of clastics across the shelf during highstands through a variety of shallow marine processes (Meissner, 1972; Candelaria, 1989). Borer and Harris (1989) suggest that both scenarios were operative, with siliciclastics transported across an exposed shelf by wind during lowstands and subsequently trapped and reworked on the shelf during the following relative rise in sea level. This combination of processes was invoked by Driese and Dott (1984) to explain the origin of fossiliferous calcareous sandstones that occur intercalated with demonstrable eolian sandstones and shallow marine carbonates in the Middle Pennsylvanian Morgan Formation of northern Utah and Colorado.
This two-stage origin of eolian transport across an exposed shelf followed by a marine overprint and reworking into laterally continuous sheet sands with the ensuing transgression is perhaps the best model for the origin of the quartz sandstone facies. Several of the surfaces immediately beneath QSF units contain evidence of subaerial exposure (caliches, moldic porosity, and recrystallization) resulting from sea-level falls beneath the top of the shelf. The QSF units always pass up into deeper-water marine facies (e.g., black laminated mudstone and intermediate facies). Thus the quartz sandstone facies straddles the boundary between lowstand conditions with exposure and transgressive deepening conditions. The petrographic attributes of the siliciclastic material [high degree of sorting, fine grain size, lack of a clay fraction, subangular shape; see Folk (1978) for a discussion of the textural properties of eolian sands] are compatible with eolian transport before marine reworking. The ultimate source of this material would be either to the south (Zuni-Defiance uplift) or to the west to northwest (Kaibab and Emery uplifts). Driese and Dott (1984, fig. 22) state that the major direction of eolian dune migration was north to south, suggesting that the ultimate source for the quartz clastics of this facies was the northern flank of the Kaibab uplift or the Emery uplift.
A suitable Holocene analogue with coexisting siliciclastic eolian sands (well-sorted, medium- to fine-grained) and shallow marine carbonates has been described from the Persian Gulf by Shinn (1973). Here, eolian quartz dunes prograde across a subaerially exposed, deflated Eocene dolomite elevated 5 m (16 ft) above sea level, spilling into and mixing with shallow marine Holocene carbonate sediments. A cored transect down to Eocene "basement" reveals the presence of a basal quartz sand [3-5 m (10-16 ft) thick] atop the Eocene dolomite, grading upward into transgressive carbonate wackestone (2-12 m (7-39 ft) thick] with admixed quartz sand. The contact between the Eocene dolomite and the basal quartz sand is sharp and erosional with reworked lithoclasts of Eocene dolomite immediately above the surface, analogous to the basal contacts observed for many Paradox QSF units. This sharp surface and overlying quartz sand packet record lowstand eolian deflation and transport of quartz sand before the Holocene transgression. The upper part of this basal quartz sand unit contains scattered stromatolites and mudcracks and indicates tidal flat conditions adjacent to the transgressive carbonate unit, analogous to the QSF2 subfacies. The contact with the overlying transgressive carbonate unit is gradational and marked by a steady decline in quartz sand upward, again similar to the gradations in silt content observed between the quartz sandstone facies and the overlying marine facies (e.g., sponge or intermediate facies) at the Honaker Trail section. The transgressive carbonate unit, dated 4,000-5,000 yr B.P. (Shinn, 1973), records the Holocene rise. This Holocene mixed siliciclastic and carbonate cycle, with its basal erosional contact (lowstand exposure), basal quartz sand (lowstand eolian bypass to transgressive reworking), and middle carbonate unit (Holocene transgression), provides a reasonable analogue for interpreting the significance of the quartz sandstone facies within the higher-frequency cycles.
This facies makes up <3-4% of the Honaker Trail section and is composed of dark-gray to black silty dolomitic shales and shaly mudstone, which in outcrop weather to form recessive slopes (fig. 18A). The best exposures of the BLM facies occur at the base of the Desert Creek and lower Ismay sequences. Other occurrences of dark shaly layers [<1-2 ft (<0.3-0.6 m) thick] located toward the base of major sequences (e.g., basal upper Ismay sequence) are not as well exposed but are assigned to this facies. All intervals of the BLM facies are easily correlated with their subsurface equivalents on the basis of their well log character. The BLM facies at the Honaker Trail are the updip shelf equivalents of the "black sapropelic shales" used to subdivide the Paradox basinal evaporite facies into regionally correlative cycles (29 shale-evaporite cycles) (Peterson and Ohlen, 1963). Rocks of this facies are compacted clayey and silty shales rich in organic matter and disseminated iron sulfides with varying amounts (<20%) of carbonate material in the form of dark micritic peloids (fig. 17B). Much of the carbonate is reported to be dolomite (Merrell, 1957; Hite and Buckner, 1981). Quartz (40-60%) and clay minerals (15-25%) predominate, although a sparse fauna (e.g., conodonts, bone fragments, fish teeth, thin-shelled phosphatic brachiopods) and rare plant matter have been reported (Elias, 1963; Choquette and Traut, 1963; Peterson and Hite, 1969). Thin, millimeter- to centimeter-size even planar lamination is conspicuous, formed by black and gray varve-like laminae (fig. 19E). The basal contact of this facies is fairly sharp, typically overlying bedded carbonate or siltstone. At the Honaker Trail, this facies always grades vertically upward into overlying sponge facies.
Figure 18--(A) Black, parallel-laminated, shaly mudstone. BLM facies (unit H6) near base of sequence HT4. Scale bar = 2 ft. (B) Dark mudstone composed of silt-sized carbonate peloids, clay material, disseminated quartz silt (white specks), and organic matter. BLM facies (unit H6); thin section photomicrograph (scale bar = 0.5 mm). (C) Recessive-weathering, cherty (dark nodules) carbonate mudstone interbedded with silt-rich, noncherty layers characteristic of the sponge facies (unit G2a), base of cycle 20. Notebook for scale (6 in. in length). (D) Silty mudstone of the sponge facies composed predominantly of siliceous sponge spicules with admixed quartz silt and carbonate peloids. Unit A2, base of cycle 16; thin section photomicrograph (scale bar = 0.25 mm). (E) Intercalated carbonate wackestone-packstone (prominent beds) and silty carbonate wackestone (recessive intervals) characteristic of the intermediate facies. Unit G I b, cycle 19. (F) Mixed skeletal wackestone-packstone composed of normal marine fossils (brachiopods, bryozoans, crinoid debris) in a matrix of compacted peloidal material. Unit E14, cycle 29.
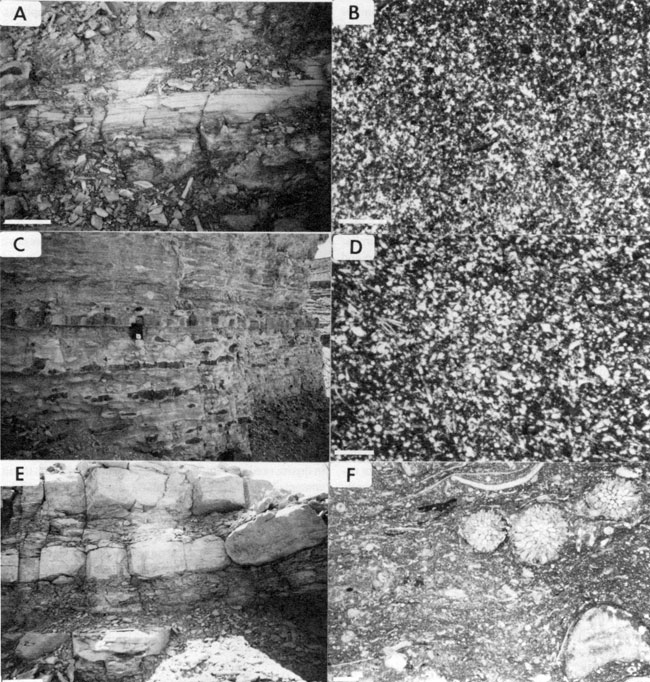
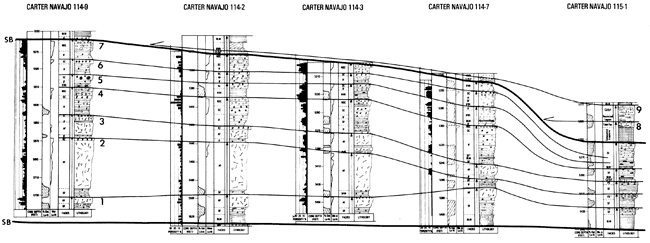
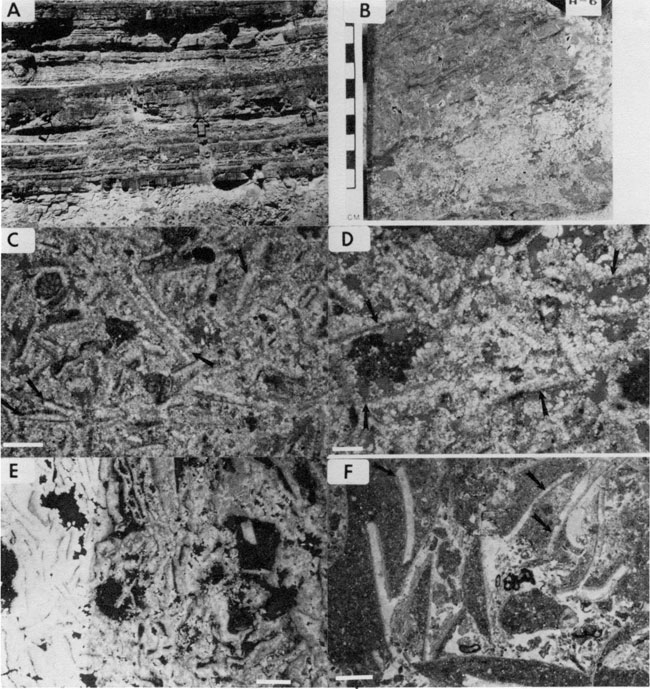
Figure 19--(A) Details of the stratigraphy associated with the sequence boundary at the top of sequence HT3. The top of cycle 7 is coincident with the sequence boundary and consists of nonskeletal capping facies (NSC) (details shown in figs. 20F and 2 1 A,B) overlain by caliche (details shown in figs. 22C,D). Quartz sandstone (details illustrated in figs. 16C,D) occurs immediately above the caliche (SB), and this passes gradationally into skeletal cap facies of cycle 8 (details shown in part B). This cycle is in turn covered by black laminated mudstone (BLM) (details depicted in figs. 18A,B) which passes up into cherty, silty sponge facies (SF). Cycle 8 thus represents a fifth-order cycle within the transgressive systems tract of the fourth-order sequence, and the BLM marks the maximum flooding surface of the sequence. (B) Transition from quartz sandstone facies to nonskeletal capping facies within cycle 8. Rippled calcareous sandstone of quartz sandstone facies passes gradationally into ooid grainstone of overlying capping facies. Note quartz nuclei of ooids. Units H3 and H4; thin section photomicrograph (scale bar = 1 mm). Arrow indicates up direction. (C) Eroded clast of laminated and leached oolitic grainstone (partly silicified) encased in laminated quartz sandstone (QSF). This sandstone rests immediately above the fourth-order sequence boundary above sequence HT4 (top Desert Creek) at the depositional shelf edge and thickens downdip to a 20-ft-thick sandstone layer. The leached eroded clast of ooid grainstone is derived from subaerial erosion of the exposed shelf top during fourth-order lowstand in sea level. Carter Navajo well 114-7 (5,249.4 ft core depth). Scale bar = 1 cm. Arrow indicates up direction. (D) Laminated calcareous, very fine grained sandstone composed of quartz sand and admixed carbonate allochems. Laminations defined by coarser carbonate-rich layers consisting of skeletal debris and carbonate peloids. In slabbed core this unit displays centimeter-scale ripple lamination and desiccation cracks, suggestive of tidal flat deposition. This unit occurs downdip from that illustrated in part C. Carter Navajo well 115-1 (5,315 ft core depth); thin section photomicrograph (scale bar = 1.5 mm). Arrow indicates up direction. (E) Slabbed core of black, laminated mudstone (BLM facies) depicting the fourth-order condensed section of sequence HT5 (lower Ismay sequence) above the sequence boundary of sequence HT4. This stratigraphic interval is equivalent to unit A I at the Honaker Trail section. Carter Navajo well 114-2 (5,320.7 ft core depth). Scale bar = 1 cm. Arrow indicates up direction. (F) Disrupted, crudely layered, mosaic anhydrite occurring within a restricted wedge downdip from the depositional shelf edge. This unit, which represents the lower part of the fourth-order lowstand systems tract, sits directly on the fourth-order sequence boundary of sequence HT4. Carter Navajo well 115-1 (5,360.3 ft core depth). Scale bar = 1 cm. Arrow indicates up direction.
Based on their muddy textures, planar lamination, sparse fauna, and dark color coupled with their stratigraphic position within the overall cyclic framework, the BLM facies is inferred to reflect deeper-water deposition [>35 m (> 115 ft)] under marine reducing (anaerobic) conditions (Byers, 1977) with a minimum of water turbulence (Choquette and Traut, 1963; Peterson and Hite, 1969). The combination of high organic content and disseminated sulfide, absence of bioturbation, and basinwide distribution led Peterson and Hite (1969) to suggest settling-out deposition in quiet water under toxic bottom conditions. The presence of thin-shelled phosphatic brachiopods led Elias (1963) to envision a highly restricted, euxinic bottom environment. Consideration of restored stratigraphic geometries based on subsurface cross sections (Choquette and Traut, 1963; Peterson and Hite, 1969) (see also figs. 13 and 14) indicates paleowater depths of greater than 30 m (100 ft).
As pointed out by Byers (1977), anaerobic bottom conditions, such as those prevailing during deposition of the BLM, typically imply very deep water depths [> 150 m (>500 ft)] at the base of the pycnocline. However, in an evaporite basin anaerobic bottom conditions can persist at much shallower depths, not so much because of oxygen stratification but rather because of a density-salinity gradient generated by intense evaporation of seawater to halite saturation or beyond (Hite, 1970; Byers, 1977). Hite (1970) proposed a "barred basin evaporite model" for the Paradox basin that rationally satisfies the repetitive alternation of anaerobic BLM facies with aerobic shallow-water normal marine carbonates in a shelf position and the stratigraphic relationships that suggest water depths of approximately 30 m (100 ft). Anoxic, dense hypersaline brines (formed in a restricted, silled basin from evaporation during lowstands) refluxing across the shallow southwestern Paradox shelf with a rise in sea level (transgressions) would in effect shift toxic basinal conditions up onto the shelf. This reflux layer of stagnant saline water with its low dissolved oxygen content (Hite, 1970) would produce anaerobic conditions on the shelf, but in relatively shallow water [<<150 m (<<500 ft), the upper limit for anaerobic deposition] (Byers, 1977). Thus the BLM facies and its equivalent "sapropelic shales" in the basin mark the overall major transgressive phase of the fourth-order sequence and serve as a regionally correlative time line.
This facies, making up 16% of the Honaker Trail section, was named by Pray and Wray (1963) for rocks rich in sponge spicules that weather to a characteristic yellowish-pink massive recessive cliff (fig. 18C). The lithology is argillaceous carbonate mudstone, which locally grades into calcareous siltstone. The quartz silt content varies from <5% to 50% of the rock. Petrographically, needlelike siliceous sponge spicules (approximately 40 µm in diameter on average), subangular coarse quartz silt, muddy silt-sized carbonate peloids, and scattered discrete silt-sized dolomite rhombs are all discernible (fig. 18D). Argillaceous material and disseminated pyrite are minor (<5-10%), and other rare allochems noted include echinoids, phosphatic material (conodonts, fish scales, thin-valved brachiopods), and worn brachiopods.
The basal contact of this facies is sharp where it rests directly on top of an underlying cycle (e.g., nonskeletal cap facies) but is gradational where it overlies the BLM facies. Upper contacts always grade into overlying shallower water well-bedded facies. Where this facies grades upward into the intermediate facies, sponge spicules disappear, quartz silt decreases, and rather abruptly a normal marine fauna appears. In the field the sponge facies is laterally continuous, whereas in the subsurface it may thicken into paleotopographic depressions located between phylloid-algal bioherms (Choquette and Traut, 1963; Herrod and Gardner, 1988).
Sedimentary structures consist of fine millimeter-size, wispy to planar laminations that reflect subparallel orientation of elongate sponge spicules, probably enhanced as a result of mechanical compaction. This facies forms laterally discontinuous undulatory to nodular thin beds [8 in. to 3 ft (0.2-0.9 m) thick] that contain distinctive black lenticular to nodular chert [10 in. to 2 ft (0.3-0.9 m) thick]. Locally disturbed bedding suggests possible burrowing (Pray and Wray, 1963). Dewatering and slump features are present.
The dark color, millimeter-size parallel lamination, presence of pyrite, paucity of normal marine biota, rare burrowing, and dominance of sponge spicules indicate that these rocks were deposited in a deeper subtidal anaerobic to perhaps dysaerobic setting of slight bottom turbulence (Pray and Wray, 1963; Choquette and Traut, 1963; Elias, 1963). The presence of primarily sponge spicules implies restricted, probably hypersaline conditions (Pray and Wray, 1963; Hite, 1970; Byers, 1977) because sponges can tolerate almost any environment (Elias, 1963). Depositional conditions resulted from the continued circulation of hypersaline, stagnant basinal waters onto the shelf following peak transgression depicted by the BLM facies. However, depositional conditions were not as anoxic as the underlying BLM facies. The position of the sponge facies in stratigraphic cross sections (Choquette and Traut, 1963; Herrod et al., 1985; Herrod and Gardner, 1988) (figs. 13 and 14) indicates paleo-water depths of 15-30 m (50-100 ft), consistent with Byers's (1977) interpretation (dysaerobic, water depths of a few tens of meters). By assuming that the fifth-order cycle boundaries in fig. 14 are time lines and that the capping ooid grainstones are essentially at sea level, the paleo-water depths for this facies can be estimated simply by measuring the vertical distance between the top of a grainstone-capped cycle and the base of the downdip onlapping layer of the sponge facies.
This facies makes up approximately 30% of the section and consists of undulatory, thin- to medium-bedded, greenish silty limestone that weathers to meter-scale ledges (fig. 18E). The facies was named by Pray and Wray (1963) for strata located between the sponge facies and the algal facies in their 120-ft-thick (37-m-thick) section (lower and upper Ismay intervals). These rocks are characterized by a robust normal marine fauna-large crinoids, brachiopods (intact spiriferids), bryozoans, fusulinids, corals [whole Chaetetes heads, 1-2 ft (0.3-0.6 m) in diameter] and minor foraminifers and phylloid algae (fig. 18F). The skeletal material is coarse sand to gravel size and varies from whole and in place to reworked and abraded. Rock types are typically mud supported (mudstone-wackestone), but locally coarse packstone lenses exist. The matrix is either compacted muddy peloidal material or dolomite mud, and admixed subangular quartz silt to very fine sand comprises up to 40% of the facies.
Both lower and upper contacts are generally gradational, although sharp planar bedding plane breaks are common. Tan and black lenticular to nodular chert [1- 12 in. (2.5-30 cm) in diameter] is common, as is burrow mottling. Low-amplitude stylolites occur in clean limestone layers, and wispy anastomosing compaction seams are noted in silty layers. This facies is laterally continuous in the field and in the subsurface.
The characteristics of the intermediate facies-abundant normal marine fauna, mud support, burrowing, light color, overall decrease in admixed silt vertically upward--combined with the lack of sulfides and organic matter indicate deposition under moderately shallow, well-oxygenated subtidal conditions of normal salinity (Pray and Wray, 1963; Choquette and Traut, 1963). This facies typically occurs beneath the algal or capping facies (nonskeletal or skeletal) and above the sponge facies. Based on its position vertically within cycles and within restored stratigraphic cross sections (figs. 13 and 14), paleo-water depths are estimated to be between 5 and 15 m (15-50 ft). In Hite's (1970) barred basin scenario, deposition of the intermediate facies (and subsequent or equivalent algal facies) resulted by means of a shift from transgressive to regressive conditions during which the initiation of lowering sea level decreased circulation of saline fluids over the platform. As Pray and Wray (1963) noted, the abrupt transition from sponge facies to intermediate facies (and overlying facies) "may reflect the 'regression' of the interface between stagnant basin waters and overlying, more normal marine waters" (p. 220).
Rocks of the algal facies make up only 5% of the Honaker Trail section occurring within the Akah sequences and the lower Ismay sequence. The algal facies is dominant in our subsurface McElmo Creek study interval (Desert Creek interval of the Aneth field) and in other published subsurface studies (Elias, 1963; Choquette and Traut, 1963; Peterson and Hite, 1969; Choquette, 1983; Herrod et al., 1985; Herrod and Gardner, 1988).
The algal facies is characterized by the presence of phylloid-algal mounds and intervening depressions. Discrete mounds are flat-bottomed, convex-up lenses, 20-40 ft (6-12 m) thick and 30-90 ft (9-27 m) long in outcrop (figs. 9 and 17A). The biohermal masses of light-gray limestone have paleotopographic relief of 25-50 ft (7.6-15 m). Mound flanks on either side of the central core display low-angle cross-stratification or accretionary bedding (Choquette, 1983) with dips less than 5°-10°. Intermound depressions are filled with bedded younger strata that onlap the massive cores of bioherms or the inclined strata of biohermal flanks. In the subsurface individual bioherms coalesce, yielding larger biostromal masses that have great lateral extent (several thousands of feet) compared to their vertical thickness [20-40 ft (6-12 m)] (Choquette and Traut, 1963; Peterson and Ohlen, 1963; Herrod and Gardner, 1988).
Rocks of the algal facies range from grain supported [sparry algal facies of Pray and Wray (1963); type A buildup facies of Choquette and Traut (1963)] to mud supported [muddy algal facies of Pray and Wray (1963); type B buildup facies of Choquette and Traut (1963)]. Grain-supported rocks are packstones and grainstones with calcareous phylloid algae (Ivanovia) cemented by sparry calcite. Minor amounts of mud and/or finer skeletal material are restricted to small sediment traps or pockets within the algal framework. The dominant lithology of the mounds is interpreted as an algal bafflestone (Embry and Klovan, 1971) in which loosely to closely packed phylloid algae are the constructing elements (figs. 17B-E) (Choquette, 1983). According to Pray and Wray (1963), the phylloid alga Ivanovia was probably a leaflike calcifying marine plant that grew upright (not unlike the recent alga Halimeda). On death and disintegration, the leafy plates served as sediment traps and effective sediment bafflers, concentrating peloids and other material. Minor relief on the seafloor could have initiated colonization of individual plants, ultimately resulting in local areas dominated by the algae. Based on its photic requirements, Ivanovia probably lived in waters less than 15 m (50 ft) deep (Pray and Wray, 1963).
Mud-supported rock types include algae-rich wackestones to mudstone (fig. 17F), and sparry calcite is restricted to moldic pores and vugs or cracks opened by brecciation of semi-indurated lime mud. As noted by Pray and Wray (1963), Choquette and Traut (1963), and Herrod and Gardner (198 8), mud content tends to increase downward and algal content increases upward within a mound. Common grain types, aside from phylloid algae, include peloids and less abundant normal marine fossils (bryozoans, crinoids, fusulinids, encrusting foraminifers). A characteristic aspect of the algal facies is the occurrence of syndepositional breccias [type C buildup facies of Choquette and Traut (1963)] composed of sand- to gravel-size angular fragments of algal wackestone to mudstone that have rotated, because of either slumping (Choquette and Traut, 1963) or dissolution of phylloid algae supporting shelter pores (Pray and Wray, 1963; Herrod and Gardner, 1988). The matrix between breccia fragments is filled with peloidal micrite and/or sparry calcite.
Primary interparticle and shelter porosity created by the irregular packing of phylloid-algal plates is significant (figs. 17C-E). Secondary moldic porosity, solution-enlarged interparticle and shelter porosity, and porosity linked to solution collapse and brecciation are also prominent. As pointed out by Choquette and Traut (1963), the diagenetic enhancement of porosity and permeability within the algal facies is probably due to the relatively high primary porosity and permeability inherent in this facies. Much or all of the leaching occurred early and was clearly mineralogically controlled and hence fabric selective after presumably aragonitic phylloid algae (Pray and Wray, 1963; Choquette and Traut, 1963; Peterson and Ohlen, 1963; Peterson and Hite, 1969; Hite and Buckner, 1981; Choquette, 1983; Herrod et al., 1985; Herrod and Gardner, 1988; Dawson, 1988). Other facies, with the exception of the capping facies (nonskeletal and skeletal capping facies; see next facies section), lack any moldic or solution-enlarged porosity. Interparticle, moldic, and solution-enlarged pores are partly to totally occluded by nonferroan bladed to equant sparry calcite (coarsely crystalline) (figs. 17C-F). These cement types are nonluminescent (Dawson, 1988) and are interpreted by Choquette (1973), Herrod et al. (1985), Herrod and Gardner (1988), and Dawson, 1988) as early meteoric phreatic cements. In addition to the prominent leaching and meteoric cements, aggrading neomorphic recrystallization to coarse microspar is conspicuous within the algal facies (figs. 17B-D). Other facies, with the exception of the capping facies and caliches, lack any evidence for neomorphic recrystallization.
The lower contact of the algal facies is sharp and typically overlies the intermediate or sponge facies. The upper contact is sharp and, in outcrop, erosional. The tops of the mounds in the lower Ismay sequence at the Honaker Trail have been erosionally truncated (as have the onlapping strata), and reworked lithoclasts occur in the sandstone overlying the mound top. In the subsurface the upper contact is sharp and generally overlain by grainstones of the capping facies.
The light color, dominance of algae, and admixed normal marine fauna suggest deposition in well-circulated, shallow, oxygenated, normal marine waters. The broad leaflike shape of the algae led Pray and Wray (1963) to conclude that the algae could not have withstood a high degree of wave action and thus probably thrived most abundantly below appreciable wave action. On the other hand, numerous researchers have noted shoaling-upward tendencies within the overall development of mounds (i.e., increasing grain support upward, decreasing mud content upward, presence of coated grains toward the top) (Choquette and Traut, 1963), perhaps indicating growth into wave-agitated zones. Stratigraphic cross sections suggest paleo-water depths of 5-15 m (15-50 ft).
The conspicuous early diagenetic leaching, associated precipitation of interpreted meteoric phreatic cements, and neomorphic recrystallization are probably linked to subaerial exposure at the tops of cycles containing algal bioherms (Peterson and Ohlen, 1963; Peterson and Hite, 1969; Hite, 1970; Wilson, 1975; Hite and Buckner, 1981; Choquette, 1983; Herrod et al., 1985; Herrod and Gardner, 1988; Dawson, 1988). These features are all known to be products of the meteoric phreatic diagenetic realm [see Bathurst (1976) and James and Choquette (1984) for a review], and presumably this diagenetic environment was established periodically on subaerial exposure at the tops of some of the cycles, similar to the scenario proposed by Heckel (1983) for the early diagenesis observed in the regressive portions of the midcontinent Pennsylvanian cyclothems.
The skeletal cap facies, which constitutes 19% of the Honaker Trail section, occurs as medium- to thick-bedded light-gray limestone ledges. The skeletal cap and nonskeletal cap facies (see next section) together make up the cap facies of Pray and Wray (1963). This facies consists of medium- to coarse-sand-size, mixed skeletal and peloidal wackestone to dominantly packstone. Grainstones are less abundant. Abundant normal marine skeletal debris is characteristic and includes crinoids, brachiopods, fusulinids, bryozoans, mollusks, encrusting foraminifers (opthalmidids), and rare phylloid algae (figs. 20A,B). Micritized skeletal material is common. Nonskeletal grain types are mainly peloids. This facies is devoid of siliciclastic silt.
Figure 20--(A) Medium sand-sized mixed skeletal packstone-grainstone composed of worn and abraded bioclastic debris (crinoids, fusulinids, foraminifers, brachiopods, etc.). Note micritized rinds of many grain margins. Skeletal cap facies (unit D7), top of cycle 22; thin section photomicrograph (scale bar = 1 mm). (B) Coarse- sand-sized skeletal grainstone consisting of crinoids, bryozoans, and brachiopod fragments. Skeletal cap facies (unit E28), cycle 33; thin section photomicrograph (scale bar = 2 mm). (C) Small-scale trough crossbedded and ripple cross-laminated carbonate grainstone. Nonskeletal cap facies (unit E31), top of cycle 34. (D) Trough crossbedded carbonate grainstone. Nonskeletal cap facies (unit D15), top of cycle 25. (E) Ooid grainstone with abraded, micritized skeletal grains and scattered very fine to medium sand sized, rounded quartz grains. Note quartz grains acting as nuclei for ooids. Nonskeletal cap facies (unit F12), top of cycle 11; thin section photomicrograph (scale bar = 4 mm). (F) Bidirectional crossbedding in a coarse-sand-sized ooid grainstone. Oomoldic porosity is visible as small dark holes. Nonskeletal cap facies (unit H1), top of HT3 sequence.
The skeletal cap facies typically overlies either the intermediate or sponge facies, and its lower contacts are gradational. The upper boundaries either grade into the overlying nonskeletal cap facies or are sharp where the skeletal cap facies forms the uppermost member of a cycle. Sedimentary structures observed in this facies are burrows, ripple cross-laminations, and small-scale, low-angle trough crossbedding. In general, however, primary mechanical sedimentary stratification is uncommon. Tan to red cherty stringers [<2-5 in. (<5-13 cm) thick] are present, as are high-amplitude stylolites and anastomosing stylolitic swarms. Minor moldic porosity occurs in this facies in intervals closely associated with sequence boundaries.
The light color, grain-supported textures, abraded and micritized skeletal debris, and presence of encrusting foraminifers (opthalmidids) indicate shallow subtidal to near shoaling conditions. Paleo-water depth for the facies is estimated at <5 m (< 15 ft). Modern encrusting opthalmidid foraminifers reach their peak in abundance in waters 0-5 m (0-15 ft) deep in Florida Bay (Elias, 1963).
The nonskeletal cap facies forms light-gray, medium- to thick-bedded resistant ledges that make up 14% of the Honaker Trail section. This facies predominantly consists of moderately well-sorted, fine- to coarse- sand-size grainstones and lesser packstones (fig. 20E). Nonskeletal allochems include peloids, ooids, superficial ooids, oncoids, and reworked rounded intraclasts. Abraded, worn skeletal debris and rounded quartz sand are common as ooid nuclei, but in general skeletal debris and siliciclastic sand are rare. The basal contacts of this facies are gradational atop deeper-water facies, and the upper contacts are sharp and some are subaerial exposure horizons (caliches). Sedimentary structures include medium-scale trough crossbedding [1-2-ft-thick (0.3-0.6-m-thick) sets] (figs. 20C,D), bidirectional planar crossbedding (herringbone) (fig. 20F), and small-scale current and current-modified wave ripple cross-laminations. Early lithified hardground crusts overlain by eroded lithoclasts are also noteworthy. Burrows are rare, and large high-amplitude [<1-2 in. (2.5-5 cm)] stylolites are common.
Early diagenetic phenomena related to the cyclicity (porosity development, cementation, and recrystallization) are a conspicuous aspect of this facies. Moldic, solution-enlarged interparticle, and non-fabric-selective vuggy porosity are well developed (fig. 21). Ooids, peloids, and mollusks have been selectively leached, presumably because of their original aragonitic mineralogy (Choquette, 1983; Heckel, 1983). "Dropped nuclei" of less soluble carbonate material within leached ooid molds support this interpretation (fig. 21D). Cementation of this facies both predates dissolution and moldic porosity development (i.e., leached moldic pores are intact because of interparticle cements) and postdates it (i.e., moldic pores are partly to totally cement filled). Primary interparticle and moldic pores are partly to totally occluded with medium to coarsely crystalline, clear, equant sparry calcite (nonferroan). The cement morphology and its association with leached moldic pores strongly indicate that much of the cementation occurred within the freshwater phreatic diagenetic realm (Peterson and Hite, 1969; Wilson, 1975; Choquette, 1983; Herrod and Gardner, 1988; Dawson, 1988). Similar cement types and associated moldic porosity of ooids, peloids, and other aragonitic allochems are well known from Pleistocene carbonates (Bathurst, 1976; James and Choquette, 1984). Marine cement types are not observed. Neomorphic recrystallization of allochems and of the interparticle matrix and cements to a medium crystalline, equant microspar mosaic is a distinctive feature of this facies (figs. 21 A,B,F). Typically, recrystallized zones are restricted to the upper few feet of this facies (e.g., units H2, A11, and F18 of the Honaker Trail section) and contain moldic porosity. This neomorphic recrystallization is also interpreted to result from meteoric alteration of carbonate [see also Purdy (1968), Multer (1971), and Esteban and Klappa (1983)].
Figure 21--(A) Leached ooid grainstone with conspicuous circular molds after ooids. Note that the interparticle matrix is recrystallized to a medium crystalline microspar mosaic. Nonskeletal cap facies (unit H 1), top of HT3 sequence; thin section photomicrograph (scale bar = 4 mm). (B) Leached and recrystallized ooid grainstone characterized by neomorphic alteration of interparticle material and peloids to microspar mosaic. Note coarse equant calcite cements partly occluding oomolds. Nonskeletal cap facies (unit H1), top of HT3 sequence; thin section photomicrograph (scale bar = 2 mm). (C) Leached-ooid skeletal grainstone with partly to totally dissolved allochems. Note dropped nucleus within leached ooid cortex (small arrow, upper right-hand quadrant of photo). Finely crystalline, bladed to equant cement partly occludes moldic and interparticle porosity. Note meniscus cements (3 larger arrows) and concave-in pore-rounding nature of interparticle cements, indicative of vadose cementation. Nonskeletal cap facies (unit E31), top of sequence HT8; thin section photomicrograph (scale bar = 4 mm). (D) Leached-ooid grainstone with dropped nuclei encased within ooid cortexes. Moldic porosity associated with leaching is infilled with equant to blocky sparry calcite cement. Nonskeletal cap facies (unit D 15), top of sequence HT7; thin section photomicrograph (scale bar = 2 mm). (E) Leached-ooid micritized grain grainstone with extensive fabric-selective moldic porosity. Interparticle cements are finely crystalline, bladed to equant calcite. Nonskeletal cap facies, Carter Navajo well 114-7 (5,300 ft core depth), top of McElmo cycle 4; thin section photomicrograph (scale bar = 4 mm). (F) Leached-ooid grainstone with recrystallized microporous intraclasts and peloids. Interparticle cements consist of coarsely crystalline, equant calcite mosaic. Nonskeletal cap facies, Carter Navajo well 114-9 (5,560 ft core depth), top of sequence HT4, Desert Creek sequence; thin section photomicrograph (scale bar = 2 mm).
Based on their grain-supported textures, light color, ubiquitous presence of ooids and hard peloid sand, and abundance of primary mechanically generated cross -stratification (ripples, megaripples), rocks of this facies are interpreted to have formed in a high-energy shallow subtidal to lower intertidal environment. Paleo-water depths of 0-5 m (0-15 ft) are inferred, based on analogues from the Holocene (Harris, 1979). The pervasive freshwater phreatic diagenesis is probably linked to subaerial exposure and the establishment of a meteoric lens (Peterson and Hite, 1969; Wilson, 1975; Choquette, 1983; Herrod et al., 1985) related to eustatic drops in sea level, which exposed the tops of high-frequency cycles in the late highstand portion of the fourth-order sequences. The presence of subaerial exposure (caliche) surfaces capping the facies lends support to this interpretation. Similar examples of high-energy shoal-water oolitic carbonates with evidence for exposure that cap depositional cycles have been reported by Wilson (1967, 1975), Heckel (1983), Goldhammer and Elmore (1984), and Goldstein (1988) for the Pennsylvanian. These researchers all favor eustatic fluctuations in sea level as the cause of the early diagenetic alteration (paleosoils, caliches, leaching) that caps the high-frequency cycles.
Three additional facies occur that were not studied in great detail because of either limited exposure in outcrop (caliches) or limited recovery in core (evaporites and foreslope deposits). Prominent, well-developed subaerial exposure surfaces occur at the Honaker Trail section capping high-frequency cycles. The only demonstrable caliche horizons with evidence for prolonged exposure (fig. 22) occur at the tops of cycles that coincide with regionally correlative sequence boundaries (i.e., top sequence HT2 or Akah 2, top HT3 or Akah 3, and top sequence HT5 or lower Ismay sequence). Other subaerial exposure surfaces contain evidence for vadose and meteoric exposure (i.e., moldic porosity, vugs, neomorphic recrystallization, etc.) but lack well-developed caliche features (see next paragraph). To our knowledge, there are no descriptions of caliches from any of the outcrop or subsurface studies published. However, laminar caliches occurring at the tops of depositional carbonate cycles in the Pennsylvanian have been reported by Wilson (1967, 1975), Walkden (1974), Walls et al. (1975), Heckel (1983), Goldhammer and Elmore (1984), and Goldstein (1988).
At the Honaker Trail section the caliches (fig. 22) occur as thin [2-8 in. (5-20 cm)], laterally discontinuous, irregular laminated profiles that have sharp undulatory lower and upper contacts. Vertical to subvertical cracks lined with laminated, brecciated carbonate penetrate downward for several centimeters into host rock from the bases of the horizons. Internally, the horizons consist of micritic peloids and irregularly shaped lumps floating in a secondary (diagenetic) mud-supported matrix. Commonly, angular black lithoclasts are conspicuous components that together with other ragged grains and micrite matrix yield a poorly sorted, crudely laminated wackestone. Irregular, non-fabric-selective millimeter- to centimeter-size voids and vugs that truncate host grains are common, and many of these house internal sediment. Most skeletal material has been partly to totally altered to micrite. The micritic material is conspicuously laminated, with the laminae resulting from alternation of dark dense micrite and lighter porous layers. Quartz silt is interspersed throughout the layers.
Figure 22--(A) Disrupted laminar caliche consisting of irregular thin laminae (arrow, lower right) overlain by angular clasts of reworked caliche in a matrix of micrite. Top of HT2 sequence (Akah 2 sequence). Tip of rock pick for scale. (B) Polished slab of laminar caliche marked by alternating dark, dense micritic layers and lighter peloidal layers, overlain by angular caliche clasts floating in micrite. Top of HT2 sequence. (C) Irregular laminar caliche lining subvertical crack in host rock. Capping caliche profile consists of black angular caliche clasts floating in a secondary mud-supported matrix. Top of sequence HT3 (Akah 3 sequence). Tip of rock pick for scale. Arrow indicates up direction. (D) Millimeter-scale laminar caliche composed of alternations of dark, dense peloidal layers and lighter porous layers. Note internal sediment lining base of elongate pore beneath laminar caliche. Unit H 1, top of sequence HT3; thin section photomicrograph (scale bar = 1 mm). (E) Subaerial exposure surface at top of unit A11 marked by sharp, pitted irregular contact separating diagenetically altered A11 from A 12, which consists of unaltered skeletal packstone. Centimeter- scale circular molds filled with sparry calcite (arrows) are interpreted as solution holes. Note the laminated upper few centimeters of A11, interpreted as a laminar caliche. Top of sequence HT3 (lower Ismay sequence). Pencil for scale. (F) Polished slab of contact illustrated in part E, between units A11 and A 12. Unit A11 consists of black angular clasts floating in a laminated matrix of micrite and recrystallized microspar, yielding a crudely laminated wackestone. Unit A12 consists of skeletal packstone without any diagenetic alteration. Top of sequence HT3 (lower Ismay sequence).
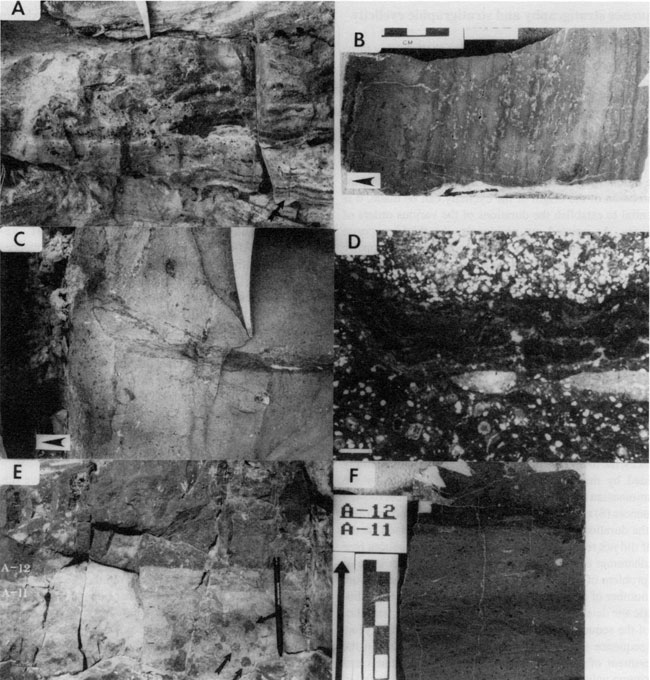
The general characteristics of these horizons suggest alteration and caliche formation as a result of subaerial exposure. This interpretation is based on similarities with Holocene and Pleistocene caliche crusts developed on exposed Tertiary carbonates [see Esteban and Klappa (1983) for a review] and with Carboniferous laminar crusts interpreted as caliches (Walkden, 1974; Walls et al., 1975; Heckel, 1983; Goldhammer and Elmore, 1984; Goldstein, 1988). Specific similarities include intense grain micritization of primary skeletal material into peloids and lumps, secondary mud-supported fabrics, laminar rinds in vertical and inclined fissures with sharp boundaries, irregular non-fabric-selective vugs (root molds or solution molds), and geopetal internal (vadose) sediment.
In the Desert Creek subsurface interval at Aneth field, two facies restricted to the most basinward well (Carter Navajo 115-1) occur. These are an evaporite facies, consisting of nodular mosaic anhydrite (only a few feet are preserved in the core) (fig. 19F), and a foreslope facies, consisting of poorly sorted, angular lithoclastic-skeletal wackestone-packstone. The evaporite is interpreted as subaqueous because it shallows into mudcracked cryptalgal laminite. The foreslope debris beds are largely composed of allochthonous phylloid-algal material and muddy clasts, interpreted as mound-flank deposits.
The Desmoinesian strata of the Paradox shelf display three superimposed orders of stratigraphic cyclicity: (1) low-frequency depositional sequences [average 100 ft (30 m) thick; fourth-order]; (2) high-frequency depositional cycles [average 20 ft (6.0 m) thick; fifth-order); and (3) a third-order accommodation cycle [650+ ft (200+ m) thick] defined by the vertical stacking patterns of the fourth-order sequences.
Before any interpretation of the origin of the cyclicity can be made, it is essential to establish the durations of the various orders of cyclicity. As pointed out previously, the thick evaporite depocenter of the Paradox basin contains 29 regionally correlative shale-evaporite cycles of Desmoinesian age (Peterson and Hite, 1969; Hite, 1970) (fig. 4). These cycles, which equate to the shelf sequences, decrease in number toward the Paradox shelf because of onlap of the lower cycles updip. The shale members of these cycles correlate with the shaly black laminated mudstone interval that occupies the lower parts of the equivalent fourth-order shelf sequences (Peterson and Hite, 1969; Hite, 1970; Hite and Buckner, 1981). Because of differences in relative subsidence between the Paradox shelf and the evaporite basin, the shelf section recorded only a few shale-based sequences (fig. 4).
To ascertain the correct duration of the shale-based sequences, the total number of basinal sequences (29) is simply divided by the total amount of time represented by the Desmoinesian (table 3). If one takes the total number of shelf sequences (8) and divides by the total time, an incorrect value for the duration of the sequences would be obtained, as the shelf did not record the deposition of all the sequences [see Goldhammer et at. (1990, pp. 541-542) for a discussion of the problem of missed beats in platform carbonates]. From the number of low-frequency sequences (29) and the radiometric age dates for the Desmoinesian, the average periodicity of the sequences is between 138,000 and 345,000 years per sequence (table 3). Where errors are included in the assessment of ages (Harland et al., 1989), minimum and maximum values can be calculated. Minimum values fall in the fifth-order range (table 3), but on average the low-frequency sequences are fourth-order (0.1-1.0 m.y. duration) (table 1).
Table 3--Desmoinesian age estimates and calculated periodicities of low-frequency (fourth-order) sequences and high-frequency (fifth-order) cycles. Minimum and maximum values given or accompanying age dates that include errors. Calculation of high-frequency cycle periods assumes a maximum ratio of nine cycles per sequence (see text).
| Source | Duration (m.y.) |
Periodicity of Low-Frequency (High-Frequency) Cycles | ||
|---|---|---|---|---|
| Average (Years) |
Minimum (Years) |
Maximum (Years) |
||
| Van Eysinga (1975) | 10 | 345,000 (38,333) |
||
| Harland et al. (1982) | 6.25 ± 6 | 215,527 (23,946) |
8,600 (955) |
422,414 (46,934) |
| Harland et al. (1989) | 7 ± 10.3 | 241,379 (26,819) |
0 (0) |
596,551 (66,283) |
| Palmer (1983) | 9 ± 10 | 310,345 (34,482) |
0 (0) |
655,172 (72,796) |
| Ross and Ross (1987) | 8.5 | 293,100 (32,566) |
||
| Odin and Gale (1982), Lippolt et al. (1984), Klein (1990) |
4 | 137,931 (15,325) |
||
The low-frequency fourth-order sequences consist of stacks of higher-frequency cycles (figs. 8, 10, and 11). At the Honaker Trail the number of high-frequency cycles per sequence ranges from 3 to 9. In our subsurface McElmo Creek example the Desert Creek sequence (sequence HT4) contains nine higher-frequency cycles, seven in the shelf and two within the lowstand wedge occupying an intrashelf depression (fig. 14). We suspect that the maximum ratio of higher-frequency cycles per fourth-order sequence is 9:1 or possibly 10:1. Assuming a ratio of 9:1, the periodicity of a high-frequency cycle is derived by dividing the calculated periodicities of the fourth-order sequences by the maximum number of cycles (9) (table 3). From this exercise the average periodicity of the high-frequency cycles ranges from 15,000 to 38,000 years per cycle. Taking into account dating errors, even maximum values fall within the realm of fifth-order sequences. Thus in all likelihood the higher-frequency cycles are fifth-order cycles (table 3).
The shelf fourth-order sequences stack to yield a lower-frequency accommodation cycle (figs. 7-9) defined by systematic thinning and thickening of fourth-order sequences. Based on the age model for the fourth-order sequences, this accommodation cycle is third-order in duration.
At the Honaker Trail section eight sequences are recognized from the base of the outcrop (base of the Akah) to the top of the Desmoinesian (figs. 7-11). They average 115 ft (35 m) in thickness, ranging from 55 ft (17 m) (lower Ismay sequence) to 157 ft (47.9 m) thick (upper Honaker Trail formation sequence). The sequences are labeled Honaker Trail sequence 1 through 8, and they are correlated with the subsurface productive intervals. At McElmo Creek the cored interval occupies one complete sequence, the Desert Creek sequence (HT4), which ranges in thickness from 150 ft to 195 ft (46-59 m) (fig. 14).
The following criteria were used in recognizing the sequences:
The fourth-order sequences can be subdivided into component systems tracts in both the outcrop (fig. 9) and subsurface (figs. 12 and 13). All the Paradox sequences examined in this study are type 1 sequences bounded by type 1 sequence boundaries (Vail et al., 1984; Vail, 1987), interpreted to have formed when fourth-order sea level fell beneath the Paradox shelf.
The lowstand systems tract (LST) consists of wedges of evaporite and quartz siliciclastics restricted to topographically low intrashelf depressions (figs. 12-14). Lowstand wedges range in thickness from 20 ft to 60 ft (6-18 m) and contain a lower evaporite-rich portion composed of mosaic anhydrite and an upper siliciclastic-rich portion. The wedges occupy depositional troughs and thin laterally by onlap against carbonate depositional highs on the shelf.
In the McElmo Creek core cross section (fig. 14), the lowstand wedge (Carter Navajo 115-1 well) contains two onlapping high-frequency cycles that are restricted within a topographic low. These cycles indicate the persistence of fifth-order relative sea-level oscillation during times of fourth-order lowstand. In detail (fig. 14), the lower cycle shoals from subaqueous nodular, mosaic anhydrite (fig. 19F) to mudcracked cryptalgal laminite. The depositional relief at the top of this cycle indicates a minimum relative fourth-order sea-level fall of 25-35 m (80-115 ft).
The upper cycle shoals from restricted muddy carbonate (lagoon) to laminated calcareous siltstone with desiccation cracks, scours, and starved ripples (QSF) (fig. 19D). This siltstone can be traced updip to the shelf edge (Carter Navajo 114-7 well), where it thins from 20 ft (6 m) to 2 ft (0.6 m). Here the siltstone sharply overlies shelf carbonate and contains within it reworked cobbles of lithified oolitic grainstone full of oomoldic porosity (fig. 19C). This indicates the following sequence of events: (1) deposition of oolitic grainstone on the shelf as the capping phase of a high-frequency cycle (cycle 7); (2) exposure of the shelf and subaerial leaching, developing oomoldic porosity, probably contemporaneous with deposition of the lower onlapping cycle in the lowstand wedge; and (3) siliciclastic transport across the shelf, feeding the upper onlapping cycle, with erosion of leached grainstone and formation of oolitic lithoclasts.
At the shelf Honaker Trail section fourth-order lowstands are marked mainly by lowstand subaerial diagenesis (caliches, moldic porosity, etc.). At a few of the boundaries (e.g., base Desert Creek sequence, HT4), siliciclastic sands fill minor incisions in the underlying carbonate and are interpreted as a fourth-order lowstand drape on the shelf (figs. 19A,B). However, as alluded to earlier, not all sequence boundaries are overlain by quartz siltstones.
The transgressive systems tract (TST), deposited during a fourth-order rise in sea level, is composed primarily of shales and shaly carbonate mudstones (BLM facies) that represent the condensed section of the sequence (figs. 12 and 13). These shaly intervals thicken into the basin [up to 40 ft (12 m) thick] and thin updip onto the shelf [less than 10 ft (3 m) thick], essentially mantling the underlying sequence boundaries. Typically, however, there is a thin [less than 10 ft (3 m) thick] transgressive oolitic grainstone between the underlying fourth-order sequence boundary and the condensed section (fig. 19A). The TST may contain one or two recognizable thin high-frequency cycles (e.g., base of the Desert Creek sequence, HT4). The top of the TST, termed the maximum flooding surface (MFS) (Vail, 1987), is always marked by the vertical facies change from BLM to SF, and in outcrop it lies within the recessive weathering part of the sequence (fig. 9). No downlap of strata against this surface is observed.
The highstand systems tract (HST), which records a decline in the rate of fourth-order rise and the early portion of the fourth-order fall, is characterized by an aggradational stack of shelf carbonate [up to 200 ft (60 m) thick] and a thinner carbonate section within intrashelf depressions (figs. 12-14). The depositional topography and facies makeup of the McElmo Creek cross section (fig. 14) can be used to divide the HST into two phases, an early highstand and a late highstand. The early highstand phase consists of stacked, aggradational, high-frequency subtidal cycles composed primarily of sponge facies shoaling into algal facies with a thin skeletal cap. Shelf-to-basin depositional relief progressively increases with each successive cycle. The late highstand phase consists of stacked, aggradational, high-frequency exposure cycles dominated by intermediate facies shoaling to skeletal or nonskeletal capping facies. Shelf-to-basin depositional relief is maintained. High-frequency exposure cycles are also characteristic of the late highstand in the sequence at the Honaker Trail section.
Fourth-order sequences are constructed of component fifth-order cycles. At the Honaker Trail section 34 fifth-order cycles are recognized [average 19 ft (6.0 m) per cycle] (figs. 8, 10, and 11). In the Desert Creek subsurface interval 7 shelf cycles occur [average 23 ft (7.0 m) per cycle] (fig. 14). The tie from outcrop to subsurface is facilitated by the alternating clastic-rich and carbonate-dominant intervals. The high-frequency cycles are apparently regionally correlative, at least from the Honaker Trail section to McElmo Creek within the Desert Creek Interval. Overall, the cycles form predominantly aggradational, laterally continuous stacks that internally contain little evidence for lateral progradation, such as offlapping lateral facies changes (e.g., fig. 14).
Cycles are recognized on the basis of vertical facies associations that shallow upward. Internally, boundaries between facies components are transitional. Evidence for shoaling within individual cycles includes (1) a tendency for grain-supported textures and the grain size of carbonate allochems to increase upward; (2) an upward increase in mechanically generated sedimentary structures, such as ripples and crossbedding within the carbonate units of a cycle; (3) an upward increase in nonskeletal high-energy components, such as ooids, superficial ooids, oncolites, and intraclasts; (4) an upward increase in normal marine fauna, which may be abraded and well sorted toward the top of the cycle; (5) the occurrence of caliches and other indicators of subaerial exposure at the tops of some cycles; (6) a vertical decrease in quartz silt content upward; and (7) an overall vertical change in color and iron sulfide and organic matter contents from dark and pyritic (e.g., BLM, SF) to light and nonpyritic (e.g., SC, NSC).
Over half the cycles at the Honaker Trail and in the McElmo Creek example are exposure cycles that have upper boundaries marked by subaerial exposure features (caliches, moldic porosity, recrystallization, and minor mudcracked peritidal laminites) (figs. 15C,E and 23A). Exposure cycles may have erosional tops (e.g., cycle 17 at the Honaker Trail and cycle 7 at McElmo Creek) and are always overlain by deeper-water carbonate facies. The remainder of the cycles are subtidal cycles that have upper boundaries marked by an abrupt deepening (figs. 23B-D).
Figure 23--(A) Outcrop view of cycle 20 (an exposure cycle), composed of a shoaling facies succession of sponge facies (SF), gradational into intermediate facies (IF), gradational into nonskeletal capping facies (NSC). The top of cycle 20 contains evidence for subaerial exposure in the form of a laterally discontinuous laminar rind a few centimeters thick. Cycle 20 is overlain by trough crossbedded quartz sandstone (QSF) that grades up into overlying intermediate facies. That gradational contact is marked by burrowing in the upper part of the sandstone. (B) Outcrop view of cycle 22 (a subtidal cycle), consisting of a shoaling facies succession of black laminated mudstone (BLM), passing gradationally into sponge facies (SF), overlain by intermediate facies (IF) and skeletal cap facies (SC). The top of cycle 21 is top of sequence HT6 (upper Ismay) and BLM is interpreted as fourth-order MFS superimposed atop the sequence boundary. The top of cycle 22 is overlain by trough crossbedded quartz sandstone (QSF). (C) Outcrop photograph of cycle 28 (subtidal cycle) composed of silty intermediate facies (IF) shoaling to skeletal cap facies (SC). (D) Outcrop photograph of cycle 29 (subtidal cycle), with a thick lower unit of calcareous sandstone (QSF) that contains mudcracks, gradationally overlain by intermediate facies (IF) and skeletal cap facies (SC).
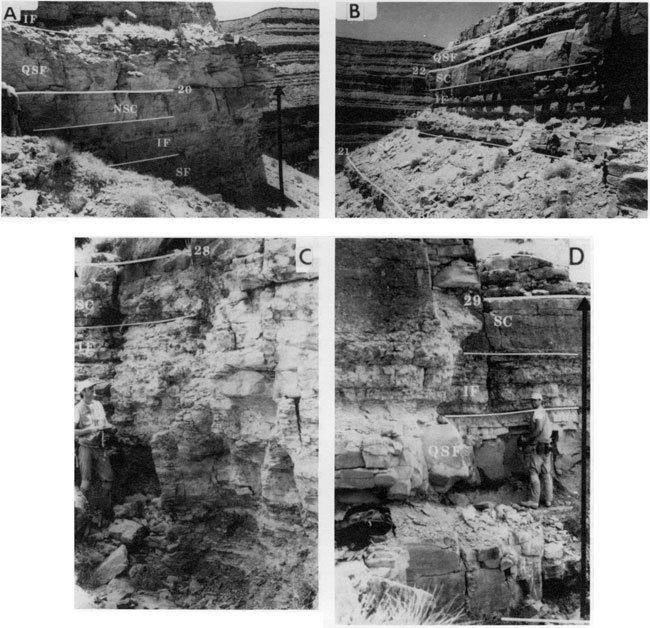
In evaluating criteria for distinguishing allocyclic versus autocyclic mechanisms for generating platform carbonate cycles and sequences, Hardie and Shinn (1986) and Goldhammer et al. (1987) pointed out that cycles or sequences composed of subtidal deposits capped by subaerial exposure surfaces (evidence for meteoric phreatic-vadose diagenesis) must result from relative sea-level oscillations, either high-frequency eustasy or tectonic "yo-yoing." Autocyclic mechanisms involving progradation must produce shallow ing-upward cycles or sequences capped by a progradational peritidal facies with features diagnostic of deposition within an intertidal-supratidal complex (Ginsburg, 1971; James, 1984; Hardie and Shinn, 1986).
As summarized earlier, all Paradox fourth-order sequences are bounded by regionally correlative sequence boundaries that contain evidence of subaerial exposure (laminar caliches plus significant moldic porosity, recrystallization, etc.). The surfaces are superimposed directly on subtidal deposits and thus indicate relative drops in fourth-order sea level. Also, in the McElmo Creek subsurface there is evidence for erosion at the top of the Desert Creek sequence and there exists the subaerially exposed fifth-order cycle (cycle 8) within the lowstand wedge, located approximately 30 m (100 ft) downdip from the fourth-order boundary on the shelf top (fig. 14). This constrains the amount of relative sea-level fall. In addition, all fourth-order sequence boundaries are traceable from the outcrop to the subsurface, where they can be correlated over 60-70 mi (100-110 km) across the Paradox shelf. Not one of the fourth-order sequences is capped by an intertidal-supratidal deposit (e.g., mudcracked laminite) that suggests progradational autocyclicity. This fact and the aggradational stacking of facies diminish the feasibility that the fourth-order sequences were generated through some progradational autocyclic mechanism. Thus we are left with a choice between the two allocyclic mechanisms-tectonic forcing or fourth-order eustasy.
Because the sequences are capped by subaerial diagenetic caps, if tectonics is to be invoked, then tectonic yo-yoing of the Paradox shelf is demanded, as opposed to simple nonuniform subsidence driven by faulting (downdropping or yo tectonics). The paleostructural interpretation of the Paradox basin is an extensional rhombochasm bounded by right-lateral master faults that were initiated in Atokan time. This interpretation is supported by thick alluvial and fluvial red bed sequences deposited along the southwest flank of the Uncompahgre uplift and by active fault movement (fig. 1) (Stevenson and Baars, 1988). Clearly, tectonic forcing of the Paradox shelf deserves serious consideration.
At present, there is sufficient data regarding tectonic forcing through stepwise subsidence to render this form of tectonics (i.e., yo tectonics) a plausible mechanism for the generation of meter-scale sedimentary cycles and larger sequences (Hardie et al., 1991). For example, modern manifestations of coseismic subsidence over large areas (equal to or greater than the Paradox shelf) associated with strong earthquakes have been reported along convergent margins and in intraplate regions (Plafker, 1965; Atwater, 1987). Although large areas can be downdropped by several meters, the data regarding recurrence frequencies are sparse, suggesting only that recurrence frequencies span the 10,000I 00,000-yr band (Hardie et al., 1991).
Modern data concerning yo-yo tectonics are scarce, and information regarding recurrence frequency, amount of vertical displacement, and the size of area involved is lacking. Cisne (1986) outlined a model of strike-slip faulting at the edges of carbonate platforms that demands a fault-bounded shelf edge. In this model the platform edge and the updip area located within 100 km (60 mi) of the shelf edge would experience high-frequency crustal oscillations as a result of yo-yoing (Cisne, 1986). Although this model is intriguing, there is no way to estimate recurrence frequencies and Desmoinesian block faulting coincident with the Desmoinesian Paradox shelf edge is needed.
Baars and Stevenson (1982) suggested that "small-scale oscillating vertical movements recurred along fault blocks throughout early Paleozoic time" (i.e., the Early Mississippian) across the "Four Comers Platform of northwestern New Mexico" (i.e., the San Juan basin) (fig. 1). They suggest that in the Pennsylvanian the same "small-scale basement structures ... actively controlled the distribution of Middle Pennsylvanian carbonate lithofacies" in the Paradox basin by providing positive fault blocks favorable to shallow-water carbonate production (Baars and Stevenson, 1982, p. 154). However, they did not suggest tectonic yo-yoing of the shelf, nor did they present data, such as isopachs of the Desmoinesian shelf or regional subsurface cross sections, that indicate faults cutting through the Desmoinesian section of the southwestern Paradox shelf (Baars and Stevenson, 1981, 1982; Stevenson and Baars, 1988; Baars, 1988). In fact, our own regional subsurface cross sections (figs. 12 and 13) and our inspection of unpublished seismic data across the shelf do not indicate any syn-Desmoinesian faulting of the southwestern Paradox shelf. It is more likely that localized tectonics in the form of gentle uplifts acted to influence the distribution of major algal mound development (Choquette and Traut, 1963).
If in fact tectonic yo-yoing was operative, it is unlikely that the entire Paradox shelf would have experienced synchronous and uniform amounts of uplift and downdrop, a consideration demanded by the lack of abrupt lateral thickness changes of the regionally correlative sequences. In addition, the regional correlation of fifth-order cycles and the repetitive stacking of facies within successive fifth-order cycles (compare the repetitious facies stacking in cycles 5 through 7 at McElmo Creek; fig. 14) are features unlikely to have developed from tectonic yo-yoing of the Paradox shelf. Furthermore, a comparison of the relatively small deviation in fifth-order cycle thickness [a range of 8-38 ft (2.4-12 m) per cycle] from the average cycle thickness [average ≈20 ft (6 m) per cycle] argues against repeated tectonic oscillations, as this would require uniform amounts of repetitive displacement.
The fourth-order sequences are bounded by regionally correlative subaerial exposure surfaces that indicate alternating submergence and subaerial exposure of the Paradox shelf with significant relative drops in sea level to ensure effective leaching and caliche formation. In this respect, the fourth-order Paradox sequences are similar to late Quaternary fourth-order cycles of various carbonate platforms [e.g., the Pliocene-Pleistocene of the Great Bahama Bank (Beach and Ginsburg, 1978), the Pleistocene of the Caicos platform (Wanless and Dravis, 1989), and the Pleistocene of the south Florida platform (Perkins, 1977)] in that both are essentially subtidal deposits capped by subaerial exposure surfaces ("diagenetic caps" in the form of laminar caliches, karstic dissolution pipes, soil breccias, etc.). Associated with both are freshwater, near-surface, early diagenetic features (e.g., leached ooids, neomorphic recrystallization). These and other late Quaternary cycles of alternating shallow-marine deposition and subaerial exposure are interpreted to have been controlled by late Quaternary glacio-eustatic sea-level oscillations [see Hardie and Shinn (1986) and Goldhammer et al. (1987,1990) for a review].
The calculated periods of late Quaternary cycles are similar to those derived for the Paradox fourth-order sequences. For example, the upper Pliocene to Holocene platform carbonates of the Great Bahama Bank (Beach and Ginsburg, 1978) contain 15 subtidal cycles with diagenetic soil caps representing the last 3.2 m.y., yielding an average cycle duration of 213,000 years per cycle (Hardie and Shinn, 1986).
Thus, by analogy with late Quaternary cycles, which are widely accepted as eustatic in origin, we favor eustatic sealevel oscillations as the mechanism responsible for the development of the fourth-order Paradox sequences. Recall from table 3 that the periodicities of the Paradox sequences range from 13 8,000 to 345,000 years per sequence. Ignoring for the time being the 4-m.y. estimate for the Desmoinesian (Odin and Gale, 1982; Lippolt et al., 1984), the range of fourth-order periodicities varies from 216,000 to 345,000 years per sequence, that is, medial fourth-order.
This is significant because numerous other examples of Pennsylvanian cyclicity show that the major cycles are medial fourth-order in duration (table 4). For example, Heckel (1983, 1986, 1989) in a synthesis of mixed clastic and carbonate cyclothems from the US midcontinent, calculated periodicities of between 235,000 and 400,000 years for regionally extensive, major fourth-order cycles (cyclothems). For analogous transgressive-regressive coal-bearing cycles from the Appalachian basin, Busch and Rollins (1984) derived periodicities of 400,000-450,000 years per cycle for the most obvious fundamental cycles [ranging in thickness from 5 m to 30 m (16-100 ft)] that correlate for over 200 mi (320 km). In their recent compilation of depositional sequences in the southwestern United States, Ross and Ross (1987) reported 23 regionally significant fourth-order sequences for the Desmoinesian, with an average duration of 390,000 years. Ramsbottom (1979) has recognized a cyclic hierarchy within the British Carboniferous containing a fundamental cycle (his "cyclothem"), with a period in the 200,000-500,000-year range. Goldstein (1988) reported mixed clastic and carbonate cycles capped by paleosols from the Virgilian Holder formation of New Mexico that have an average periodicity of 300,000 years. Driese and Dott (1984) calculated a range in cycle period for the 17 mixed sandstone and carbonate cycles of the Middle Pennsylvanian Morgan Formation of between 470,000 and 880,000 years. Finally, Algeo and Wilkinson (1988), in a review of Phanerozoic cycle periods, found that for Late Mississippian through Late Pennsylvanian cycles a statistically significant number of mesoscale cycles [1-100 m (3-300 ft) thick] clustered about a 400,000-year period.
Table 4--Summary of Pennsylvanian fourth-order stratigraphic cyclicity.
| Source | Stratigraphic Unit | Cycle Periodicity (Years) |
|---|---|---|
| This study | Desmoinesian Paradox formation; SE Utah, SW Colorado; 29 regionally correlative, basinal shale-evaporite cycles | 230,000-385,000 |
| Driese and Dott (1984) | Middle Pennsylvanian Morgan Formation; northern Utah and Colorado; 17 mixed clastic-carbonate cycles | 470,000-800,000 |
| Heckel (1986, 1989) | Middle Pennsylvanian "cyclothems" from the US midcontinent; 25 shale-based mixed clastic-carbonate cycles | 235,000-400,000 |
| Busch and Rollins (1984) | Pennsylvanian "cyclothemic PAC sequences" from northern Appalachian basin; 12 regionally extensive mixed clastic-carbonate cycles with coal horizons | 400,000-450,000 |
| Ross and Ross (1987) | Desmoinesian depositional sequences of southwestern US; 23 regionally significant sequences | 390,000 |
| Ramsbottom (1979) | Carboniferous "cyclothems" of Britain | 200,000-500,000 |
| Goldstein (1988) | Virgilian Holder formation of New Mexico; mixed clastic-carbonate cycles | 300,000 |
| Algeo and Wilkinson (1988) | Compilation of Carboniferous mesoscale cycles | 400,000 |
Without exception, all these examples of Pennsylvanian cyclicity are interpreted by the various researchers as eustatic in origin, caused by the waxing and waning of glaciers as the Gondwana supercontinent drifted near and across the south pole (Crowell, 1978). Crowell pointed out that the time span of Gondwanan glaciation (about 90 m.y.) in the southern hemisphere coincides with the Carboniferous interval of stratigraphic cyclicity in the northern hemisphere.
Many of the examples of Pennsylvanian cyclicity, including the Paradox sequences, have other characteristics consistent with a glacio-eustatic mechanism. First, several of the examples are lithologically similar to the late Quaternary fourth-order cycles from the Bahamas and south Florida. That is, they are diagenetic cycles that consist of shallow-marine carbonates (phylloid-algae bioherms, ooid grainstones, etc.) that are capped by subaerial caliches [see Heckel (1983) and Goldstein (1988)]. Second, the sequences tend to be "regressive skewed"; that is, there is a sedimentologic tendency toward thin, argillaceous, condensed transgressive phases and thick regressive limestones. This asymmetric trend in sequence components reflects the mechanics of the actual buildup and decay of ice caps. The Pleistocene sealevel curve has a sawtooth shape, inferred from dated coral reef terraces (Steinen et al., 1973; Aharon, 1984) and oxygen isotope data (Imbrie, 1985) with relatively rapid rises and slow falls, reflecting the slow buildup and rapid decay of ice sheets.
The amplitude of fourth-order Pennsylvanian eustasy is believed to be fairly high. Ross and Ross (1987) indicate an amplitude of 50-150 m (160-490 ft), and Wilson (1967) speculated minimum eustatic drops in sea level for the cyclic Virgilian Holder formation of 30-50 m (100-160 ft). Heckel's (1989) interpretation of the black-shale core facies of the midcontinent cyclothems requires water depth changes of the order of 100 m (300 ft). The high-amplitude fluctuations and the relative shape of the inferred eustatic curve are consistent with a glacio-eustatic interpretation.
If, as we believe, the fourth-order sequences are eustatic in origin, then we still must explain the origin of the higher-frequency fifth-order cycles that make up the sequences. One of the central themes that emerges from the stratigraphy of the Paradox shelf is that of composite stratigraphic cyclicity, in which small depositional cycles build into larger sequences in an ordered hierarchy. Recognition of vertical stacking patterns (thickness, facies character, early diagenetic attributes) of the high-frequency fifth-order cycles is the key to unraveling composite stratigraphies.
In the Paradox example the number of fifth-order cycles per sequence ranges from 3 to 9. In the thickest fourth-order sequences, which have the highest number of fifth-order cycles (e.g., sequences HT3, HT4, HT8), this value ranges from 7 to 9 (fig. 11). However, most of the shelf sequences may actually be incomplete with respect to the true number of fifth-order sea-level cycles per sequence because the fourth-order low stand wedges contain a few fifth-order cycles that onlap below the shelf top in topographic depressions. Thus the updip shelf sections may not contain every fifth-order stratigraphic cycle and thus may not record the maximum number of fifth-order cycles. In what follows we address the possible mechanisms that might have generated the composite stratigraphic cyclicity of the Paradox shelf.
An explanation for composite stratigraphic cyclicity calling solely on tectonics would require superimposed multiple orders of yo-yoing. If we view the fourth-order sequences as eustatic and call on fifth-order yo-yoing to generate the component cycles, then we must place strict limitations on the timing and amount of high-frequency yo-yoing to generate the repetitive stacks of fifth-order cycles. Based on uncertain recurrence frequencies of major earthquakes [see Hardie et al. (1991)] and lacking a tectonic model that would predict superimposed high-frequency relative crustal oscillations, we have no way of evaluating the model at this time.
The concept of high-frequency composite eustasy is an established one (Goldhammer et al., 1990), exemplified by the Pliocene-Pleistocene isotopic records of deep-sea cores of the Caribbean (Broecker and van Donk, 1970) and the Indian Ocean (Hays et al., 1976) and published Pleistocene sea-level curves derived from uplifted successions of dated coral reef terraces (Steinen et al., 1973; Aharon, 1984). In these and other examples composite eustasy has resulted from glacio-eustatic sea-level oscillations generated in response to Milankovitch orbital forcing.
Based on (1) the eustatic interpretation of the fourth-order sequences, (2) the high probability of glacio-eustasy in the Middle Pennsylvanian (Wanless and Shepard, 1936; Crowell, 1978; Fischer, 1986), and (3) the composite stratigraphic cyclicity of the Paradox sequences, glacio-eustasy triggered by astronomical (Milankovitch) phenomena deserves consideration. The issue now becomes which orders of stratigraphic cyclicity equate to the various Milankovitch orbital cycles. In effect, how should we link our stratigraphic cycles to the orbital periods? Based on the ages and the calculation of fourth-order sequence and fifth-order cycle periods (table 3), there appear to be two viable scenarios: (1) a long eccentricity-obliquity model and (2) a short eccentricity-precession model.
According to the ages given by van Eysinga (1975), Harland et al. (1982, 1989), Palmer (1983), and Ross and Ross (1987), the duration of fourth-order sequences ranges from 216,000 to 345,000 years per sequence (table 3). These values fall in the vicinity of the earth's long eccentricity cycle with a period of 413,000 years (Berger, 1977, 1984). By considering dating errors, the Paradox fourth-order sequences could reflect the waxing and waning of glaciers in response to net solar insolation changes driven by the long eccentricity cycle. Indeed, Heckel (1986) and Fischer (1986) have argued that late Carboniferous large, rhythmic marine transgressions and regressions of the US midcontinent were driven by the Milankovitch long eccentricity cycle, a view championed by Ross and Ross (1987). A review of the fourth-order cycle periods in table 4 supports the notion of the dominance of the long eccentricity cycle.
Recalling the 9:1 ratio of fifth-order cycles per fourth-order Paradox sequence, the fifth-order periods range from 24,000 to 3 8,000 years per cycle with a mean value of 31,230 years (table 3). Recently, Berger et al. (1989) recalculated the predicted obliquity and precessional periods back through geologic time, accounting for the effect of the shortening of the earth-moon distance and the concomitant shortening of the length of a day through time (Berger et al., 1989; table 2, p. 558). Because of these phenomena, the fundamental astronomical periods for obliquity and precession must have been less than their present values. For the obliquity the value is reduced from 41,000 years to 34,000 years, and for precession the values are shortened from the periods of 19,000 and 23,000 years to 17,400 and 20,700 years, respectively. There is no change, however, in the earth's short eccentricity cycle (a quasi -period of about 100,000 years) or in the earth's long eccentricity cycle (a fixed period of 413,000 years). Within the limitation of available age dates, it is conceivable to view the Paradox fifth-order cycles as a record of the earth's obliquity cycle, with a period close to 34,000 years per cycle.
Supporting the contention of Milankovitch-forced glacio-eustasy, Heckel (1986, 1989) classified midcontinent Pennsylvanian cycles into minor cycles (with periods from 44,000 to 118,000 years) and major cycles (with periods from 235,000 to 393,000 years). Heckel (1986, 1989) suggested that these periods and the hierarchy of minor and major cycles can best be explained by glacio-eustasy driven by the earth's orbital cycles in accordance with the Milankovitch insolation theory, similar to the Pleistocene climatic forcing (Hays et al., 1976; Imbrie and Imbrie, 1980; Imbrie, 1985). Minor cycles reflect the obliquity cycle (dominant period of 41,000 years) and the short eccentricity cycle (averaging 100,000 years but ranging from 95,000 to 125,000 years; Berger, 1977), whereas the major cycles record the long eccentricity cycle. Fischer (1986) pointed out that in the Carboniferous the shorter Milankovitch rhythms, particularly the precessional cycle (two dominant periods averaging 19,000 and 23,000 years), appear to have been suppressed in favor of the long eccentricity cycle. Fischer (1986) concluded that this "red shift" seems more pronounced in the Carboniferous than in the Pleistocene, indicating that Carboniferous climates "reacted with greater inertia" (Fischer, 1986, p. 371).
Quaternary and Miocene analogues supporting the existence of the earth's long eccentricity cycle as recorded in deep-sea carbonate sediments are provided by two different cores from the Pacific (Moore et al., 1982). In their variance spectrum of the Quaternary core (Moore et al., 1982, fig. 3), peaks corresponding to the 400,000- and 100,000-year eccentricity cycles and the 41,000-year obliquity cycle are illustrated; Moore et al. (1982) related these to Milankovitch phenomena. In their Miocene example the 400,000-year eccentricity cycle is dominant, which Moore et al. again related to the earth's long eccentricity cycle.
Thus the composite stratigraphic cyclicity of the Paradox could be modeled as two superimposed glacio-eustatic sealevel oscillations, with the fourth-order driver depicting the earth's long eccentricity cycle (413,000 years) and the fifth-order fluctuation responding to the obliquity cycle (approximately 34,000 years).
By utilizing the age dates of Odin and Gale (1982), Lippolt et al. (1984), and Klein (1990), we calculate that the duration of fourth-order sequences averages 138,000 years per sequence (table 3). This value is close to the earth's short eccentricity cycle with a quasi-period of approximately 100,000 years (the modulation envelope ranges from 95,000 to 123,000 years; Berger, 1977). Thus the Paradox fourth-order sequences could conceivably represent the short eccentricity cycle. If this were the case, then the component fifth-order Paradox cycles would average 15,300 years per cycle and tie in more closely to the precessional cycle, which in the Pennsylvanian modulated between 17,400 and 20,700 years (Berger et al., 1989).
To aid in evaluating this second Milankovitch model, we performed relative time-series analysis on the fifth-order cyclic succession measured at the Honaker Trail (figs. 8, 10, and 11). Underlying the spectral analysis of the Paradox record is the assumption that all fifth-order depositional cycles are of equal duration. The Honaker Trail section was analyzed using the maximum entropy spectral analysis (MESA) technique of Burg (1967) in an algorithm from Press et al. (1986). First, we used the MESA technique to analyze the raw cycle thickness data, which were converted to oscillate about a zero point by subtracting the average cycle thickness from the thickness value of each individual cycle (the "-" average curve in fig. 24A). Second, we utilized the MESA technique to analyze the log-transformed thickness data (the log 10 transform curve in fig. 24A).
Figure 24--Relative time-series analysis of fifth-order cycle succession at the Honaker Trail. (A) Cycle thickness versus cycle number ("Raw Data") and two transformations of the raw data. The "(- Average)" transformation is simply cycle thickness minus the average thickness; the "Log 10 Transform" is the log 10 transformation of the "(- Average)" data. (B) Frequency spectrum for the "(Average)" data set derived from maximum entropy spectral analysis (MESA). (C) Frequency spectrum for the "Log 10 Transform" derived from MESA. For both data sets the dominant frequency occurs at 0. 175 (refer to text).
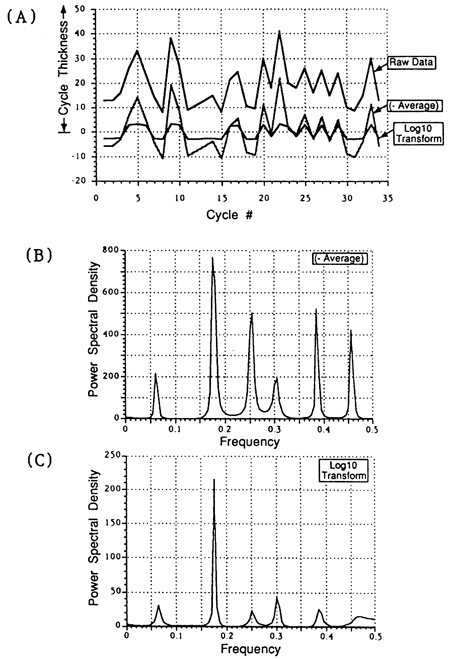
Application of the MESA technique to these data yields frequency peaks expressed as power spectral density (figs. 24B,C). These spectral peaks indicate underlying lower-frequency stratigraphic rhythms, where 1/frequency yields the ratio of fundamental fifth-order cycles to lower-frequency cycles. For both the normal and the log-transformed data sets, the strongest peak occurs at a frequency of 0.175, indicating a 5.71 ratio of two superimposed orders of stratigraphic cyclicity. Assuming that the fundamental fifth-order cycles represent precession with a period modulating between 17,400 and 20,700 years, the 5.71 ratio yields a fourth-order cycle (with values ranging from 99,000 to 118,000 years), suggesting the short eccentricity cycle.
Intriguing as these results are, this analysis assumes that all fifth-order eustatic oscillations of sea level were recorded as fifth-order stratigraphic cycles on the Paradox shelf; that is, the shelf does not contain any fifth-order missed beats [see Goldhammer et al. (1990) for a discussion of the problem of missed beats in cyclic platform sections]. This assumption is probably not true based on the existence of fifth-order cycles trapped downdip in the lowstand wedge of the lower Ismay sequence (HT5) on top of the Desert Creek sequence (fig. 14). We noted similar lowstand fifth-order cycles within the Desert Creek sequence (HT4) restricted to intrashelf depressions overlying the Akah 3 sequence (fig. 12).
Based on our assessment of all possible models, we strongly favor high-frequency composite eustasy as the mechanism responsible for the composite stratigraphic cyclicity of the Paradox shelf. The multiple orders of solar insolation variation predicted by the Milankovitch theory make it the only testable model for composite eustasy on the fourth- and fifth-order time scales. However, the bridge from recognition of a composite stratigraphy to proof of Milankovitch forcing is not easily crossed. Uncertainty in age dating, incompleteness of the record, variable subsidence and sedimentation rates, and errors inherent in projecting astronomical parameters and resulting climatic change back in time can individually or in combination render a stratigraphy illegible, even if it was laid down at a time when sea level resonated to a Milankovitchian tune.
By utilizing Milankovitch astronomical forcing of glacio-eustasy as a mechanism, we have evaluated two scenarios, both of which are viable based on published radiometric ages. Both scenarios call on a composite mixture of fifth-order eustasy and fourth-order eustasy acting in concert. In light of all the available evidence, we cannot rule out one over the other but can only conclude that Milankovitch glacio-eustasy was certainly possible.
In addition to the obvious fifth-order and fourth-order cyclicity, a longer-term lower-frequency trend or accommodation cycle is observed at the Honaker Trail section and in the subsurface. This third-order trend is delineated by the vertical stacking patterns of the fourth-order sequences (figs. 7-9), which progressively thin from the Akah 2 sequence [approximately 160 ft (49 m) thick] to the upper Ismay sequence [57.5 ft (17.5 m) thick] and subsequently thicken upward to the upper Honaker Trail sequence [156.5 ft (47.70 m) thick]. In addition, the number of fifth-order cycles per fourth-order sequence progressively decreases and increases coincident with the thinning-thickening trend (i.e., sequence HT3, 7 cycles; HT4, 8 cycles; HT5, 3 cycles; HT6, 3 cycles; HT7, 4 cycles; HT8, 9 cycles). The Honaker Trail Fischer plot (fig. 10) also illustrates this third-order relative decrease and increase in accommodation.
This long-term trend is probably related to long-term subsidence patterns. However, it is interesting to note that the same overall pattern of third-order change is reported by Ross and Ross (1987, fig. 3) for the upper fourth-order sequences of the southwestern United States (their Altamont through Hertha sequences) and by Heckel (1986, fig. 2) for the late Desmoinesian (his Verdigris through Lost Branch cyclothems), suggesting the presence of a third-order eustatic trend. In addition, Berger's (1977) expansion series of the eccentricity actually predicts a lower-frequency forcing of the 400,000-year eccentricity cycle. The 400,000-year cycles tend to cluster into sets of 5 or 6, suggesting a 2-2.4-m.y. underriding eccentricity component.
To gain insight into the mechanics by which composite stratigraphic cyclicity results from composite eustasy, we simulated the outcrop and subsurface stratigraphy using the MR. SEDIMENT computer program [Dunn et al., 1986; details of the model have been outlined by Dunn (1990) and Goldhammer et al. (1987)]. The simulations demonstrate the hierarchy of stratigraphic forcing generated by three superimposed orders of relative sea-level oscillation and portray the relationship between vertical facies successions, sequence and cycle stacking patterns, and the formation of subaerial versus subtidal cycle boundaries. We performed both one-dimensional and two-dimensional simulations.
In addition, the simulations allow us to test the hypothesis that the Paradox stratigraphic cyclicity resulted from Milankovitch-driven glacio-eustasy. We have chosen to model the Paradox composite cyclicity by superimposing fifth-, fourth-, and third-order eustasy for the sake of graphical presentation, but we must stress that there is no unique solution provided by the simulations. In performing the simulations, we have opted to model the high-frequency composite eustasy in accordance with the long eccentricity-obliquity model to honor the observed 9:1 ratio of fifth- to fourth-order cyclicity. The exact values for the input parameters provide only one solution in that all parameters are interrelated. However, we are not tied to these exact values.
The Paradox sequences and cycles are interpreted as largely aggradational; thus they can be modeled as one-dimensional stacks. One of the prime objectives of the modeling was to constrain the input variables to be geologically reasonable. The input parameters for the MR. SEDIMENT program include subsidence, sedimentation, and eustasy.
The input subsidence value is the rate at which the sediment column subsides (in meters per 1,000 years). It is the total subsidence that the sediment column experienced and thus includes the effects of compaction, isostatic loading, and tectonic subsidence. For the Paradox shelf a long-term subsidence rate of 0. 15 m/1,000 years was calculated by backstripping the Paleozoic section (fig. 5). In the simulations this value was held constant, with the assumption that long-term subsidence rates change at a significantly slower rate than rates of eustatic change, especially in a glacio-eustatic period.
We used a depth-dependent sedimentation function that has a maximum sedimentation rate of 0.40 m/1,000 years at water depths between 0 and 5 m (0-15 ft). Holocene accumulation rates on shallow-water carbonate platforms vary from 0.1 m to 1.0 m per 1,000 years (Stockman et al., 1967; Taft et al., 1968; Neumann and Land, 1975; Harris, 1979; Schlager, 1981). It is well established that shallow-water platform carbonate production is depth dependent (Wilson, 1975; Schlager, 1981). Although the general shape of this depth-dependent function is known (Wilson, 1975; Schlager, 1981), the actual depth-dependent sedimentation values vary as a function of the particular data set.
As outlined in the discussion of facies, we assigned water depth ranges to certain facies. To simplify the simulations, we lumped together the algal and intermediate facies in the same depth range and the skeletal and nonskeletal capping facies in the same range. In addition, a depth-related sedimentation trigger, termed "lag depth," was incorporated. This function sets the minimum depth of water required for carbonate sedimentation to resume following subaerial exposure. A lag depth of 1 m (3 ft) was used, following arguments outlined by Goldhammer et al. (1987). A rate of caliche formation (0.01 m/1,000 years; Goldhammer et al., 1987) was used when the top of the sediment column was exposed.
Several different orders of eustasy were utilized in accordance with a Milankovitch-forced glacio-eustatic model. For fourth-order eustasy we used an asymmetric sawtooth-shaped curve with a period of 400,000 years. The periodicity approximates that of the long eccentricity cycle, and the sawtooth shape reflects the hypothesis that ice caps melt faster than they grow (Hays et al., 1976; Heckel, 1986). This sawtooth variation of the fourth-order driver is also characteristic of the Pleistocene, judging by the shape of Pleistocene sea-level curves (Steinen et al., 1973; Aharon, 1984; Imbrie, 1985). Fourth-order amplitude was varied between 25 m and 28 m (82-92 ft). This is constrained by the shelf to basin cross section at McElmo Creek, where the top of the lowest onlapping fifth-order cycle within the spatially restricted lowstand wedge is 33 m (108 ft) beneath the underlying sequence boundary on the shelf (fig. 14). It must be stressed that the top of this fifth-order cycle is mudcracked (the facies is a peritidal laminite) and that it sits well beneath the antecedent shelf edge. Decompacting the basinal section and restoring the shelf to basin geometry suggest a value of approximately 25 m (82 ft).
For fifth-order eustasy a sinusoidal wave with a period of 40,000 years was used, approximating the obliquity cycle. The amplitude of this oscillation (9 m) was constrained by the stacking patterns of the fifth-order cycles, which tend to thin upward toward the top of a sequence, indicating that the relative amplitude had to be less than that of the fourth-order driver. Supporting this is the systematic gradual shift in facies types that comprise fifth-order cycles at the base of a sequence compared with those that make up cycles at the top of a sequence. If the fifth-order oscillation dominated the fourth-order wave, the succession of facies within each fifth-order cycle would not vary greatly, depending on the cycle position within a sequence. The actual amplitude of 9 m (30 ft) was derived by trial and error, honoring the water-depth limitations for the facies, the fourth-order amplitude, rates of subsidence, etc. The important point is the relative amplitude ratio between the two different orders. This relative amplitude ratio, with fourth-order sea level forcing fifth-order eustasy, is characteristic of other Pennsylvanian cyclic strata [see, for example, Heckel (1986)].
For third-order eustasy a sinusoidal wave was added to the higher-frequency waves because of the underlying long-term accommodation cycle. The form of the wave is not strictly a sine curve but approaches it in shape. Our intent was to force the fourth-order sequences to thin upward progressively, followed by thickening upward. The period was set equal to 2.4 m.y., based on the feasibility of a longer-term eccentricity cycle (Berger, 1977). The Fischer plot for the entire outcrop succession indicates a long-term accommodation amplitude of 15-20 m (49-66 ft) (fig. 10). We want to remind the reader that we could have just as readily modeled the third-order component as a long-term subsidence variation, but the effects of the third-order forcing are best portrayed by building it in as a eustatic function.
In accordance with a Milankovitch glacio-eustatic model, we added a minor short eccentricity component [120,000-year sinusoidal wave; 1 m (3 ft) amplitude] and a minor precessional component [20,000-year sinusoidal wave; 2 m (7 ft) amplitude]. Because our basic fifth-order cycle is approximately 40,000 years in duration, it would be difficult to "read" a 20,000-year component in the rock record. There may be some evidence, however, for a subtle 120,000-year cycle, as reflected by the occurrence of the quartz sandstone facies every third cycle within sequence HT8. The important message is that the interaction of the precession and the short eccentricity (i.e., the climatic precession; Fischer, 1986) may have had a minimal effect in the Middle Pennsylvanian.
Initially, the shelf section from the Desert Creek subsurface interval (McElmo Creek) was simulated (figs. 25 and 26). The simulation was run over 880,000 years at a time step of 2,000 years. Figure 25 illustrates the sea level-subsidence-sedimentation history. In this diagram time moves forward from base to top (0-880,000 years), sea level rises to the right and falls to the left, white depicts marine submergence and sediment aggradation, and black depicts subaerial exposure. The top of the sediment column is represented by the thin black line that intersects the sea-level curve on exposure. On exposure the sediment column subsides at the fixed rate of background subsidence (top of black area sloping to the left). The simulated stratigraphy consists of fifth-order cycles (marked by vertical arrows) composed of various facies. Subtidal cycles are marked by flooding surfaces (as indicated by deepening facies), and exposure cycles are marked by thin caliche caps (dated to the right in thousands of years). The fourth-order sequence stratigraphy interpretation is shown to the right in fig. 25.
Figure 25--Stratigraphic simulation of one of the fourth-order Paradox sequences (Desert Creek sequence) at McElmo Creek, with the sea-level, subsidence, and sedimentation history and corresponding simulated stratigraphy. Input parameters, water-depth-dependent facies, and depth-dependent sedimentation curve are discussed in the text. Numbers to the right of simulated cycles refer to age of cycle formed during simulation, which ran from 0 to 880,000 years. These cycles, also marked by thick black lines are exposure cycles. SB, sequence boundary; MFS, maximum flooding surface.
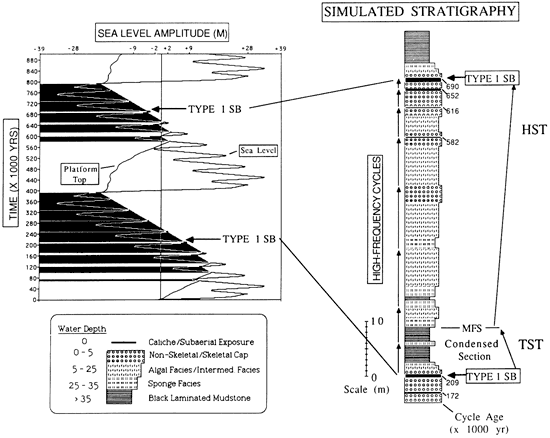
The simulation illustrates several important facets of the Paradox cyclicity (fig. 25). First, one can observe how the fourth-order oscillation forces the fifth-order waves. The fourth-order fluctuation together with subsidence creates the space for sedimentation and controls the overall water-depth profile, thus effectively controlling the vertical facies distribution. The fifth-order fluctuations act to fine-tune the stratigraphy, creating more subtle internal facies changes, and more subtle stratigraphic cycle boundaries.
Second, one can observe the delicate interplay among subsidence, sedimentation, and sea level. Note that with the rapid fourth-order rise in sea level, sedimentation rates are reduced substantially because of the decline in sediment production rates during deposition of the black laminated mudstone and sponge facies [water depths of 25-35 m (82-115 ft)]. This results in the generation of a fourth-order condensed section because of the deeper water conditions and the reduced sedimentation rates, composed of essentially two thin fifth-order cycles that are dominated by deeper-water facies. With a fourth-order fall in sea level, the water depths are reduced, which causes depth-dependent sedimentation to increase, resulting in sediment aggrading to within the "optimum window" of sediment production [<25 m (<82 ft)]. Thus cycles 3 and 4 build up to shallower water depths with successively shallower facies but still do not expose the deposits (they are subtidal cycles). These cycles expand in thickness compared to underlying cycles 1 and 2 because they developed within the optimum window for sedimentation and because there was still plenty of previously formed space available to accommodate their aggradation. During cycle 5, sedimentation is operating at maximum efficiency, the fourth-order fall starts to dominate the system, and shallow-water facies (algal and capping facies) easily aggrade to sea level, at which point a subaerial exposure surface is formed.
The remaining fifth-order cycles (cycles 6-8) are increasingly regressive skewed; that is, they thin upward, are all capped by exposure surfaces, and consist of shallowest-water facies. As these cycles become subaerially exposed, near-surface meteoric diagenesis (leaching, recrystallization) occurs in the capping facies of these cycles. Because of its position at the back end of the fourth-order fall, the last fifth-order eustatic oscillation does not flood the platform in the updip shelf position, and thus the last stratigraphic cycle (cycle 8, dated at 690,000 years) experiences close to 100,000 years of subaerial exposure. This exposure surface capping cycle 8 marks the fourth-order sequence boundary and is the thickest caliche cap generated. Many of the underlying fifth-order cycles previously exposed on a fifth-order time scale would be subject to yet another prolonged period of meteoric diagenesis. With renewed fourth-order rise, a thin veneer of transgressive capping facies (ooid grainstone) is deposited and subsequently deepens upward into black laminated mudstone.
In terms of sequence stratigraphy, the thick caliches that bound the fourth-order sequences are type 1 sequence boundaries (van Wagoner et al., 1988), which formed because the rate of fourth-order eustatic fall exceeded the rate of subsidence, as the simulation demonstrates. The first two thin fifth-order cycles, which are predominantly black laminated mudstone facies constitute the condensed section at the top of the transgressive systems tract. The one-dimensional model does not create a lowstand deposit, other than the subaerial exposure surface, but it is during the lengthy period of subaerial exposure associated with the sequence boundary that lowstand conditions exist. This surface would correlate with the downdip wedge of evaporites and siliciclastics. Because of the asymmetry of the fourth-order sea-level curve, the transgressive systems tract is thin, and the fourth-order transgressive surface lies immediately above a thin deposit of capping facies (ooid grainstone). The highstand systems tract consists of an early highstand phase composed of fifth-order subtidal cycles and a late highstand phase characterized by fifth-order exposure cycles.
The simulated stratigraphy can be directly compared with the core descriptions from the shelf section at McElmo Creek (fig. 26). The actual stratigraphy contains seven recognizable fifth-order cycles, but we suggest that in reality the first cycle actually contains two fifth-order beats of eustasy amalgamated in the black laminated mudstone facies, as the simulation demonstrates. In this case the fourth-order sequence at McElmo Creek would contain eight fifth-order cycles. The correlation between the simulated section and the actual section is excellent with respect to fifth-order cycle stacking patterns, vertical facies distribution, and the location of exposure surfaces and moldic porosity (subaerial leaching).
Figure 26--Comparison of simulated stratigraphy with actual stratigraphy from the shelf section at McElmo Creek within the Desert Creek sequence (HT4). The fourth-order sequence consists of several fifth-order cycles.
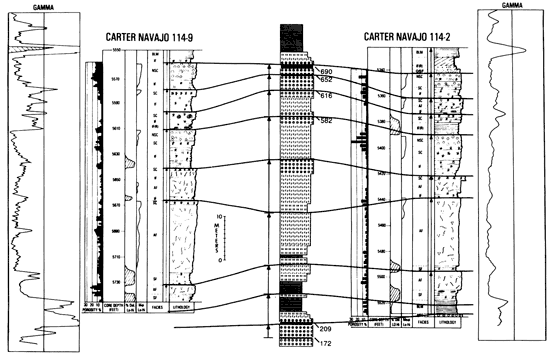
Next, the entire measured section at the Honaker Trail was simulated using the same input values as those described earlier (figs. 27A,B). The simulation ran over 3.2 m.y. with a step size of 2,000 years. As before, fourth-order sequences with component fifth-order cycles were produced. Figure 27B directly compares the measured section with the simulated stratigraphy. The effect of adding the third-order 2.4m.y. eustatic component is progressive thinning upward followed by thickening upward of the fourth-order sequences. In addition, the number of fifth-order cycles per sequence progressively declines and then increases. Both these results are a direct consequence of the hierarchy of stratigraphic forcing. The third-order accommodation cycle forced the fourth-order eustatic oscillations to produce both complete sequences [with a maximum number of fifth-order cycles per sequence, a well-developed transgressive black laminated mudstone, and a thin subaerial sequence boundary (e.g., HT2, HT3, and HT8)] and incomplete sequences [with a minimum number of fifth-order cycles per sequence, no well-developed transgressive shaly mudstone, and a thick subaerial exposure surface that records several beats of fifth-order eustasy below the top of the shelf (e.g., HT4 through HT7)]. The modeling predicts prolonged subaerial exposure at fourth-order sequence boundaries during the third-order fall. Note that the simulation suggests 200,000 to 300,000 years of subaerial exposure at these fourth-order boundaries (e.g., tops of HT4 through HT7).
Figure 27--(A) Stratigraphic simulation of the Honaker Trail section, illustrating the combined sealevel, subsidence, and sedimentation history on the left-hand side and the simulated stratigraphic output on the right. (B) Stratigraphic simulation of the Honaker Trail section, comparing the simulated cyclic and facies stratigraphy with the actual measured section, correlating fourth-order sequences. Refer to text for discussion of input parameters and simulated output. [Larger version of this figure available in the PDF of this article.]
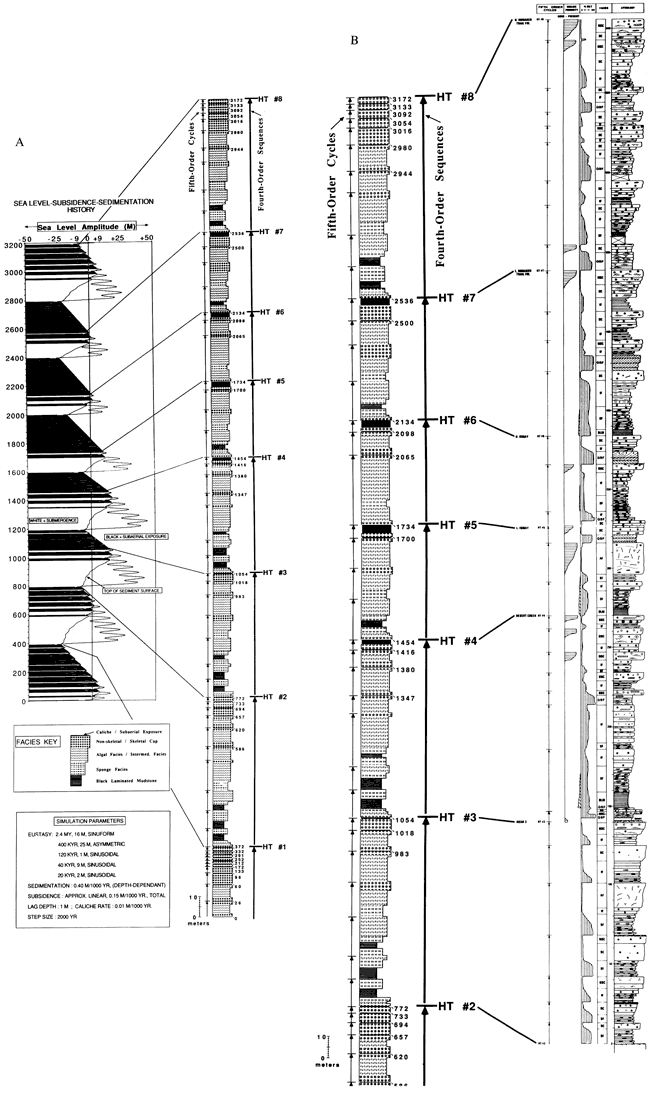
To investigate questions regarding the lateral distribution of facies, lateral continuity of individual high-frequency cycles, and overall stratal geometries within fourth-order systems tracts, we performed a two-dimensional simulation. Dunn (1990) wrote a two-dimensional computer program (DR. SEDIMENT) designed to handle the lateral transport of sediment and progradation of the shoreline across shallow carbonate platforms. The details of the program can be found in Dunn's (1990) dissertation, but in essence the model calculates two-dimensional cyclostratigraphy of either vertically aggrading subtidal platform deposits or prograding tidal flat deposits across the depositional strike of a carbonate platform. The platform may experience simple rotational subsidence about a fixed hinge line or undergo differential flexural subsidence. An important facet Of DR. SEDIMENT is that, despite the graphical presentation of two-dimensional simulations as a series of one-dimensional boreholes, the program is seamless, keeping track in space and time of all points across the entire cross-sectional area being modeled.
We generated a synthetic cross section (fig. 28) of the Paradox shelf assuming an across-strike width of 190 km (118 mi) with a gentle basinward dip and kept track of 20 depositional sites graphically. The initial starting conditions fixed point I at 0 water depth and 0 rate of subsidence, and fixed point 20 at 12 m (39 ft) water depth and a rate of subsidence of 0.20 m/1,000 years. Initial water depths and subsidence values for intervening sites were linearly interpolated. All other variables (depth-dependent sedimentation, depth-dependent facies, eustasy, lag depth) were identical with those utilized in the one-dimensional simulations (fig. 25). No third-order eustatic component was added.
Figure 28--Two-dimensional forward model of the Paradox shelf cyclostratigraphy generated by the computer program DR. SEDIMENT (Dunn, 1990). Input parameters are discussed in the text. Combined sea-level, subsidence, and sedimentation histories of six of the sites illustrate the interaction of sedimentation and accommodation changes. Individual "boreholes" record the facies and fifth- and fourth-order cyclicity at each site. Cycle ages (in thousands of years) are shown to the right of "boreholes." Fourth-order sequence boundaries denoted by thick black lines. Fifth-order cycle boundaries marked by thin black lines. See text for discussion. [Larger version of this figure available in the PDF of this article.]
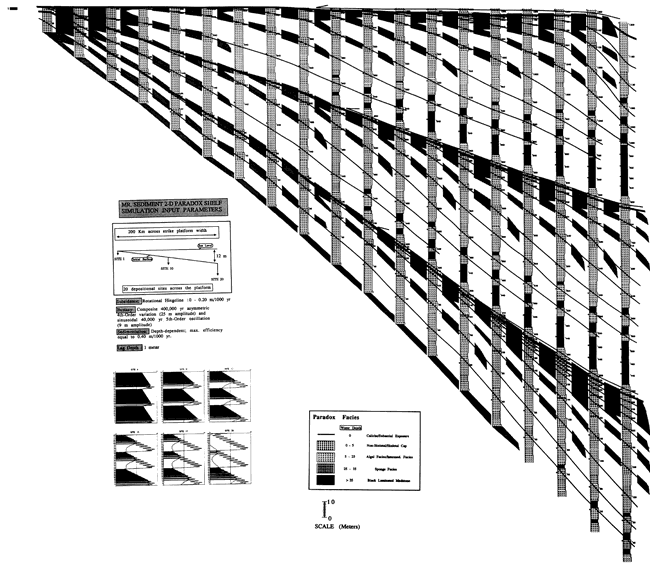
The simulated two-dimensional cross section illustrated in fig. 28 contains three fourth-order depositional sequences bounded by sequence-bounding subaerial unconformities. Each sequence contains a thin transgressive carbonate grainstone (nonskeletal cap facies) that onlaps the underlying fourth-order sequence boundary. This in turn is overlain by a series of offlapping fifth-order cycles (up to a maximum of 10 per sequence), each of which has a fifth-order transgressive component followed by a fifth-order highstand component. Note the lateral and vertical facies changes that occur both within individual cycles and within sequences as a whole. Note that the black laminated mudstone facies is not a homogeneous lithologic entity but is interbedded with both the sponge facies and the algal facies, reflecting the fifth-order eustasy. Because the computer dates the individual fifth-order cycle tops at each locality, the cycles are easily correlated laterally to reveal the geometry of stratal surfaces.
In terms of fourth-order systems tracts, the landward thinning wedge of the black laminated mudstone facies, which dominates the basal portion of fourth-order sequences, constitutes the TST. The series of offlapping fifth-order cycles above this make up the HST. The downdip terminations of each individual fifth-order cycle (where it changes facies laterally into black laminated mudstone) collectively approximate the fourth-order downlap surface or maximum flooding surface of Vail (1987).
The two-dimensional simulation sheds light on the vertical and lateral distribution of source and seal facies (black laminated mudstone facies) and on the lateral and vertical continuity of the reservoir (algal and nonskeletal or skeletal cap facies). In particular, the internal architecture of the nonskeletal or skeletal cap facies (i.e., ooid grainstones) consists of a series of spatially separate lenses that emanate from a master fourth-order sequence boundary and terminate downdip by means of a facies change. These isolated lenses could constitute multiple pay zones interbedded with less permeable intermediate facies. In addition, the simulation aids in reservoir correlation problems. For example, in the middle fourth-order sequence (fig. 28) there are three intervals of ooid grainstone facies toward the top of the sequence in the last borehole on the far right-hand side of the figure (borehole 20). Each interval corresponds to an individual fifth-order cycle. The third borehole to the left (18) also contains three ooid grainstone reservoir intervals, but the lower and middle intervals here do not correlate with the lower and middle intervals in borehole 20. Likewise, the top interval at site 18 is actually 3 superimposed ooid grainstone intervals, of which only the uppermost interval correlates with the topmost interval at site 20.
The Middle Pennsylvanian (Desmoinesian) shelf carbonates of the southwestern Paradox basin are an excellent example of composite stratigraphic cyclicity composed of fifth-order cycles grouped into fourth-order sequences, which in turn stack vertically to define a third-order accommodation cycle. At the core of this hierarchical scheme are the meter-scale fifth-order depositional cycles, each of which shoals upward and is bounded by a subaerial or submarine diastem. Within the next level of the hierarchy, the vertical stacking patterns (systematic variation in the thickness, facies makeup, and early diagenetic features) of the fundamental fifth-order cycles describe fourth-order sequences. At the outmost level, on vertical scales of hundreds of meters and over time spans of millions of years, a third-order sequence is defined by thickness trends of the fourth-order packages.
After an evaluation of autocyclic, tectonic, and eustatic mechanisms for the generation of the Paradox cyclicity, we have called on high-frequency composite eustasy as a means of interpreting the composite stratigraphic cyclicity of the Paradox shelf. This interpretation follows from (1) the facies architecture and fifth-order cycle stacking patterns within a fourth-order sequence, (2) regionally correlative subaerial exposure surfaces that cap the fourth-order sequences, (3) the similarity between the Paradox fourth-order sequences and Pliocene-Pleistocene analogues known to have eustatic origins, and (4) the high probability of glacio-eustasy in the Middle Pennsylvanian. Tectonic control cannot be completely ruled out, but as yet there are no subsidence models that include composite cyclicity at fourth- and fifth-order time scales.
Using published radiometric age dates, we have evaluated two variants of Milankovitch glacio-eustasy as possible mechanisms for producing the observed stratigraphic cyclicity. Both the long eccentricity-obliquity and the short eccentricity-precession models call on a Pennsylvanian sea-level history containing a combination of fourth- and fifth-order oscillations. In light of all available evidence and the uncertainties inherent in Paleozoic age dates, we cannot rule out one over the other but can only conclude that Milankovitch glacio-eustasy was certainly possible.
The plausibility of composite eustatic control of fifth-order cycle, fourth-order sequence, and third-order sequence formation was demonstrated through computer simulations. An important message that arose from the simulations was that of the "hierarchy of stratigraphic forcing." Order within the hierarchy is maintained by systematic control of high-frequency cycle characteristics (thickness, facies makeup, diagenetic features, etc.) by longer-term changes in accommodation. Starting with the elemental shoaling-upward cycles and working at progressively larger scales, composite stratigraphies can be constructed even in seemingly monotonous stacks of platform cycles. An understanding of cyclostratigraphy facilitates prediction and correlation of cycle, sequence, facies, and early diagenetic stacking patterns in platform carbonates.
We would like to thank S. Schutter of the Exxon Production Research Company for tutoring us on the Pennsylvanian stratigraphy and cyclicity of the Paradox basin and for carefully reviewing the manuscript. S. Schutter and P. Lehmann helped refine our core descriptions. We also acknowledge the thorough and thoughtful reviews of P. M. Harris, D. Baars, G. Stevenson, E. Franseen, M. Kozar, and P. Wong. We are especially grateful to L. A. Hardie and L. Hinnov for timely and critical reviews and discussions pertaining to the interpretation of the Paradox cyclicity. E. Mutti (Parma, Italy) also offered useful suggestions. We are indebted to M. G. Fitzgerald and R. G. Todd of EPR for allowing us to complete this study and publish the results.
Aharon, P., 1984, Implications of the coral-reef record from New Guinea concerning the astronomical theory of ice ages; in, Milankovitch and Climate, A. Berger, J. Imbrie, J. Hays, G. Kukla, and B. Saltzman, eds.: Reidel Publishing Co., Boston, p. 379-389
Algeo, T. J., and Wilkinson, B. H., 1988, Periodicity of mesoscale Phanerozoic sedimentary cycles and the role of Milankovitch orbital modulation: Journal of Geology, v. 96, p. 313-322
Atwater, B. F., 1987, Evidence for great Holocene earthquakes along the outer coast of Washington state: Science, v. 236, p. 942-944
Baars, D. L., 1988, The Paradox basin; in, Sedimentary Cover--North America Craton, U.S., L. L. Sloss, ed.: Boulder, Colorado, Geological Society of America, The Geology of North America, v. D-2
Baars, D. L., and Stevenson, G. M., 1981, Tectonic evolution of the Paradox basin, Utah and Colorado; in, Geology of the Paradox Basin, D. L. Wiegand, ed.: Rocky Mountain Association of Geologists, 1981 Field Conference, p. 23-31
Baars, D. L., and Stevenson, G. M., 1982, Subtle stratigraphic traps in Paleozoic rocks of Paradox Basin; in, The Deliberate Search for the Subtle Trap, M. T. Halbouty, ed.: American Association of Petroleum Geologists, Memoir 32, p. 131-158Barrell, J., 1917, Rhythms and the measurement of geologic time: Geological Society of America, Bulletin, v. 28, p. 745-904
Bathurst, R. G. C., 1976, Carbonate sediments and their diagenesis: Elsevier, New York, 658 p.
Beach, D. K., and Ginsburg, R. N., 1978, Facies succession of Pliocene-Pleistocene carbonates, northwestern Great Bahama Bank: American Association of Petroleum Geologists, Bulletin, v. 64, p. 1,634-1,642
Berger, A. L., 1977, Support for the astronomical theory of climate change: Nature, v. 269, p. 44-45
Berger, A. L., 1984, Accuracy and frequency stability of the Earth's orbital elements during the Quaternary; in, Milankovitch and Climate, A. Berger, J. Imbrie, J. Hays, G. Kukla, and B. Saltzman, eds.: Reidel Publishing Co., Boston, p. 3-39
Berger, A., Loutre, M. F., and Dehant, V., 1989, Influence of the changing lunar orbit on the astronomical frequencies of pre-Quaternary insolation patterns: Paleoceanography, v. 4, p. 555-564
Bond, G. C., and Kominz, M. A., 1984, Construction of tectonic subsidence curves for the early Paleozoic miogeocline, southern Canadian Rocky Mountains--implications for subsidence mechanisms, age of breakup, and crustal thinning: Geological Society of America, Bulletin, v. 95, p. 155-173
Borer, J. M., and Harris, P. M., 1989, Depositional facies and cycles in Yates Formation outcrops, Guadalupe Mountains, New Mexico; in, Subsurface and Outcrop Examination of the Capitan Shelf Margin, Northern Delaware Basin, P. M. Harris and G. A. Grover, eds.: Society of Economic Paleontologists and Mineralogists, Core Workshop 13, p. 305-318
Bott, M. H. P., 1982, The interior of the earth: 2d ed., Elsevier, New York, 403 p.
Broecker, W. S., and van Donk, J., 1970, Insolation changes, ice volumes, and the oxygen 18 record of deep-sea cores: Reviews of Geophysics and Space Physics, v. 8, p. 169-197
Burg, J. P., 1967, Maximum entropy spectral analysis (abs.): 37th Annual International Society of Exploration Geophysics Meeting, Oklahoma City, Oklahoma
Busch, R. M., and Rollins, H. B., 1984, Correlation of Carboniferous strata using a hierarchy of transgressive-regressive units: Geology, v. 12, p. 471-474
Byers, C. W., 1977, Biofacies patterns in euxinic basins--a general model; in, Deep-Water Carbonate Environments, H. E. Cook and P. Enos, eds.: Society of Economic Paleontologists and Mineralogists, Special Publication 25, p. 5-18
Candelaria, M. P., 1989, Shallow marine sheet sandstones, upper Yates Formation, northwest shelf, Delaware basin, New Mexico; in, Subsurface and Outcrop Examination of the Capitan Shelf Margin, Northern Delaware Basin, P. M. Harris and G. A. Grover, eds.: Society of Economic Paleontologists and Mineralogists, Core Workshop 13, p. 319-324
Choquette, P. W., 1983, Platy algal reef mounds, Paradox Basin; in, Carbonate Depositional Environments, P. A. Scholle, D. G. Bebout, and C. H. Moore, eds.: American Association of Petroleum Geologists, Memoir 33, p. 454-462
Choquette, P. W., and Traut, J. D., 1963, Pennsylvanian carbonate reservoirs, Ismay field, Utah and Colorado; in, Shelf Carbonates of the Paradox Basin, R. O. Bass, ed.: Four Comers Geological Society, 4th Field Conference Guidebook, p. 157-184
Cisne, J. L., 1986, Earthquakes recorded stratigraphically on carbonate platforms: Nature, v. 323, p. 320-322
Crevello, P., Sarg, J. F., Read, J. F., and Wilson, J. L., eds., 1989, Controls on carbonate platform to basin development: Society of Economic Paleontologists and Mineralogists, Special Publication 44, 405 p.
Crowell, J. C., 1978, Gondwana glaciation, cyclothems, continental positioning, and climate change: American Journal of Science, v. 278, p. 1,345-1,372
Dawson, W. C., 1988, Ismay reservoirs, Paradox basin--diagenesis and porosity development: Rocky Mountain Association of Geologists, 1988 Carbonate Symposium, p. 163-174
Donovan, D. T., and Jones, E., 1979, Causes of worldwide changes in sea level: Journal of the Geological Society of London, v. 136, p. 187-192
Driese, S. G., and Dott, R. H., 1984, Model for sandstone-carbonate "cyclothems" based on upper member of Morgan Formation (Middle Pennsylvanian) of northern Utah and Colorado: American Association of Petroleum Geologists, Bulletin, v. 68, p. 574597
Dunn, P. A., 1990, Diagenesis and cyclostratigraphy-an example from the Middle Triassic Latemar platform, Dolomites Mountains, northern Italy: Ph.D. dissertation, Johns Hopkins University, Baltimore, Maryland
Dunn, P. A., Goldhammer, R. K., and Hardie, L. A., 1986, MR. SEDIMENT--A computer model for carbonate cyclicity (abs.): Geological Society of America, Abstracts with Programs, v. 18, p. 590
Elias, G. K., 1963, Habitat of Pennsylvanian algal bioherms, Four Comers area; in, Shelf Carbonates of the Paradox Basin, R. O. Bass, ed.: Four Comers Geological Society, 4th Field Conference Guidebook, p. 185-203
Embry, A. E., and Klovan, J. E., 1971, A Late Devonian reef tract on northeastern Banks Island, Northwest Territories: Bulletin of Canadian Petroleum Geology, v. 19, p. 730-781
Esteban, M. A., and Klappa, C. F., 1983, Subaerial exposure; in, Carbonate Depositional Environments, P. A. Scholle, D. G. Bebout, and C. H. Moore, eds.: American Association of Petroleum Geologists, Memoir 33, p. 2-54
Fischer, A. G., 1964, The Lofer cyclothems of the Alpine Triassic; in, Symposium on Cyclic Sedimentation, D. F. Merriam, ed.: Kansas Geological Survey, Bulletin 169, p. 107-149 [available online]
Fischer, A. G., 1986, Climatic rhythms recorded in strata: Annual Reviews of Earth and Planetary Science, v. 14, p. 351-376
Fischer, A. G., and Sarnthein, M., 1988, Airborne silts and dune-derived sands in the Permian of the Delaware basin: Journal of Sedimentary Petrology, v. 58, p. 637-643
Folk, R. L., 1978, Angularity and silica coatings of Simpson Desert sand grains, Northern Territory, Australia: Journal of Sedimentary Petrology, v. 48, p. 611-624
Ginsburg, R. N., 1971, Landward movement of carbonate mud--new model for regressive cycles in carbonates (abs.): American Association of Petroleum Geologists, Bulletin, v. 55, p. 340
Goldhammer, R. K., and Elmore, R. D., 1984, Paleosoils capping regressive carbonate cycles in the Pennsylvanian Black Prince Limestone, Arizona: Journal of Sedimentary Petrology, v. 54, p. 1,124-1,137
Goldhammer, R. K., Dunn, P. A., and Hardie, L. A., 1987, High-frequency glacio-eustatic sea level oscillations with Milankovitch characteristics recorded in Middle Triassic platform carbonates in northern Italy: American Journal of Science, v. 287, p. 853892
Goldhammer, R. K., Dunn, P. A., and Hardie, L. A., 1990, Depositional cycles, composite sea level changes, cycle stacking patterns, and the hierarchy of stratigraphic forcing--examples from platform carbonates of the Alpine Triassic: Geological Society of America, Bulletin, v. 102, p. 535-562
Goldstein, R. H., 1988, Paleosols of Late Pennsylvanian cyclic strata, New Mexico: Sedimentology, v. 35, p. 777-804
Grabau, A. W., 1913, Principles of stratigraphy: Seiler and Co., New York, 1, 185 p.
Haq, B. U., Hardenbol, J., and Vail, P. R., 1987, Chronology of fluctuating sea levels since the Triassic: Science, v. 235, p. 1,156-1,166
Hardie, L. A., and Shinn, E. A., 1986, Carbonate depositional environments, modern and ancient--3, tidal flats: Colorado School of Mines Quarterly, v. 81, no. 1, 74 p.
Hardie, L. A., Bosellini, A., and Goldhammer, R. K., 1986, Repeated subaerial exposure of subtidal carbonate platforms, Triassic, northern Italy--evidence for high frequency sea level oscillations on a 10,000 year scale: Paleoceanography, v. 1, p. 447457
Hardie, L. A., Dunn, P. A., and Goldhammer, R. K., 1991, Field and modeling studies of Cambrian carbonate cycles, Virginia Appalachians--discussion: Journal of Sedimentary Petrology, v. 61, no.4,p.636-646
Harland, W. B., Armstrong, R. L., Cox, A. V., Craig, L. E., Smith, A. G., Smith, D.G., 1989, A geologic time scale: Cambridge University Press, New York, 128 p.
Harland, W. B., Cox, A. V., Llewellyn, P. G., Picton, C. A., Smith, A. G., and Walters, R., 1982, A geological time scale: Cambridge University Press, New York, 128 p.
Harris, P. M., 1979, Facies anatomy and diagenesis of a Bahamian ooid shoal: Sedimenta VII, University of Miami Comparative Sedimentology Laboratory, 163 p.
Hays, J. D., Imbrie, J., and Shackleton, N. J., 1976, Variation in the earth's orbit-pacemaker of the ice ages: Science, v. 194, p. 1,121-1,132
Heckel, P. H., 1983, Diagenetic model for carbonate rocks in midcontinent Pennsylvanian eustatic cyclothems: Journal of Sedimentary Petrology, v. 53, p. 733-760
Heckel, P. H., 1986, Sea-level curve for Pennsylvanian eustatic marine transgressive-regressive depositional cycles along midcontinent outcrop belt, North America: Geology, v. 14, p. 330-334
Heckel, P. H., 1989, Current view of midcontinent Pennsylvanian cyclothems; in, Middle and Late Pennsylvanian Chronostratigraphic Boundaries in North-Central Texas--Glacial-Eustatic Events, Biostratigraphy, and Paleoecology, D. R. Boardman, J. E. Barrick, J. Cocke, and M. K. Nestell, eds.: Texas Tech University, Studies in Geology 2, p. 17-34
Herrod, W. H., and Gardner, P. S., 1988, Upper Ismay reservoir at Tin Cup Mesa field: Rocky Mountain Association of Geologists, 1988 Carbonate Symposium, p. 175-192
Herrod, W. H., Roylance, M. H., and Strathouse, E. C., 1985, Pennsylvanian phylloid algal mound production at Tin Cup Mesa field, Paradox Basin, Utah; in, Rocky Mountain Carbonate Reservoirs, M. W. Longman, K. W. Shanley, R. F. Lindsay, and D. E. Eby, eds.: Society of Economic Paleontologists and Mineralogists, Core Workshop 7, p. 409-446
Hine, A. C., and Steinmetz, J. C., 1984, Cay Sal Bank, Bahamas--a partially drowned carbonate platform: Marine Geology, v. 59, p.135-164
Hite, R. J., 1970, Shelf carbonate sedimentation controlled by salinity in the Paradox basin, southeast Utah; in, Third Symposium on Salt, J. L. Ron and L. F. Dellwig, eds.: Northern Ohio Geologic Society, v. 1, p. 48-66
Hite, R. J., and Buckner, D. H., 1981, Stratigraphic correlations, facies concepts, and cyclicity in Pennsylvanian rocks of the Paradox basin; in, Geology of the Paradox Basin, D. L. Wiegand, ed.: Rocky Mountain Association of Geologists, 1981 Field Conference, p. 147-159
Houlik, C. W., 1973, Interpretation of carbonate-detrital silicate transitions in the Carboniferous of western Wyoming: American Association of Petroleum Geologists, Bulletin, v. 57, p. 498-509
Imbrie, J., 1985, A theoretical framework for the Pleistocene ice ages: Journal of the Geological Society of London, v. 142, p. 417-432
Imbrie, J., and Imbrie, J. Z., 1980, Modeling the climatic response to orbital variations: Science, v. 207, p. 943-953
James, N. P., 1984, Shallowing-upward sequences in carbonates; in, Facies Models, R. G. Walker, ed.: Geoscience Canada Reprint Series 1, p. 213-228
James, N. P., and Choquette, P. W., 1984, Diagenesis 9, limestones--the meteoric diagenetic environment: Geoscience Canada, v. 11, p. 161-193
Kendall, G. St. C., and Schlager, W., 1981, Carbonates and relative changes in sea level: Marine Geology, v. 44, p. 181-212
Klein, G. de V., 1990, Pennsylvanian time scales and cycle periods: Geology, v. 18, p. 455-457
Lippolt, H. J., Hess, J. C., and Burger, K., 1984, Isotopische alter von pyroklastischen sanidinen aus kaolin- Kohlentonstein als korrelationsmarken fur das mittel-ueroaische Oberkarbon: Forschrift Geologisches, Rheinland und Westfalen, v. 32, p. 119-150
Loope, D. B., 1985, Episodic deposition and preservation of eolian sands--a late Paleozoic example from southeastern Utah: Geology,v.13,p.73-76
Mazzullo, S. J., and Hedrick, C. L., 1985, Lithofacies, stratigraphy and depositional models of the back-reef Guadalupian section (Queen, Seven Rivers, Yates, and Tansill Formations)--day 1 road log and locality guide; in, Permian Carbonate/Clastic Sedimentology, Guadalupe Mountains, B. K. Cunningham, and C. L. Hedrick, eds.: Pemian Basin Section, Society of Economic Paleontologists and Mineralogists, Publication 85-24, p. 3-19
Mazzullo, S. J., Mazzullo, J., and Harris, P. M., 1985, Eolian origin of quartzose sheet sands in Permian shelf facies, Guadalupe Mountains; in, Permian Carbonate/Clastic Sedimentology, Guadalupe Mountains, B. K. Cunningham, and C. L. Hedrick, eds.: Permian Basin Section, Society of Economic Paleontologists and Mineralogists, Publication 85-24, p. 71
Meissner, F. F., 1972, Cyclic sedimentation in Middle Permian strata of the Permian basin, west Texas and New Mexico; in, Cyclic Sedimentation in the Permian Basin, 2d ed., J. C. Elam and S. Chuber, eds.: West Texas Geologic Society, Publication 72-60,p.203-232
Merrell, H. W., 1957, Petrology and sedimentation of significant Paradox shales: M.S. thesis, University of Utah, Salt Lake City, 40 p.
Miall, A. D., 1984, Principles of sedimentary basin analysis: Springer-Verlag, New York, 409 p.
Mitchum, R. M., 1960, McElmo Creek carbonate reservoir, Paradox basin, Utah: Jersey Production Research Co., Geological Report GLA-1S-60, 29 p.
Moore, T. C., Jr., Pisias, N. G., and Dunn, D. A., 1982, Carbonate time series of the Quaternary and late Miocene sediments in the Pacific Ocean--a spectral comparison: Marine Geology, v. 46, p. 217-233
Multer, H. G., 1971, Cementation and recrystallization of Miami Limestone ooids; in, Carbonate Cements, O. P. Bricker, ed.: Johns Hopkins University, Studies in Geology 19, p. 137-138
Neumann, A. C., and Land, L. S., 1975, Lime mud deposition and calcareous algae in the Bight of Abaco, Bahamas--a budget: Journal of Sedimentary Petrology, v. 45, p. 763-786
Odin, G. S., and Gale, N. H., 1982, Mise a jour d'echelles des temps caledoniens et hercyniens: Academle des Sciences, Comptes Rendus, v. 294, ser. 2, p. 453-456
Ohlen, H. R., and McIntyre, L. B., 1965, Stratigraphy and tectonic features of Paradox basin, Four Comers area: American Association of Petroleum Geologists, Bulletin, v. 49, p. 2,0202,040
Palmer, A. R., 1983, The Decade of North American Geology 1983 geologic time scale: Geology, v. 11, p. 503-504
Perkins, R. D., 1977, Depositional framework of Pleistocene rocks in south Florida: Geological Society of America, Memoir 147, p. 131-198
Peterson, J. A., and Hite, R. J., 1969, Pennsylvanian evaporite-carbonate cycles and their relation to petroleum occurrence, southern Rocky Mountains: American Association of Petroleum Geologists, Bulletin, v. 53, p. 884-908
Peterson, J. A., and Ohlen, H. R., 1963, Pennsylvanian shelf carbonates, Paradox Basin; in, Shelf Carbonates of the Paradox Basin, R. O. Bass, ed.: Four Comers Geological Society, 4th Field Conference Guidebook, p. 65-79
Pindell, J. L., and Dewey, J. F., 1982, Permo-Triassic reconstruction of western Pangaea and the evolution of the Gulf of Mexico/Caribbean region: Tectonics, v. 1, p. 179-211
Pitman, W. C., 1978, Relationship between eustasy and stratigraphic sequences of passive margins: Geological Society of America, Bulletin, v. 89, p. 1,389-1,403
Plafker, G., 1965, Tectonic deformation associated with the 1964 Alaskan earthquake: Science, v. 148, p. 1,675-1,687
Pray, L. C., and Wray, J. L., 1963, Porous algal facies (Pennsylvanian) Honaker Trail, San Juan Canyon, Utah; in, Shelf Carbonates of the Paradox Basin, R. O. Bass, ed.: Four Comers Geological Society, 4th Field Conference Guidebook, p. 204234
Press, W. H., Flannery, B. P., Tenkolsky, S. A., and Vetterling, W. T., 1986, Numerical recipes--the art of scientific computing: Cambridge University Press, New York, 818 p.
Purdy, E. G., 1968, Carbonate diagenesis--an environmental survey: Geologica Romana, v. 7, p. 183-228
Ramsbottom, W. H. C., 1979, Rates of transgression and regression in the Carboniferous of NW Europe: Geological Society of London Journal, v. 136, p. 147-153
Read, J. F., and Goldhammer, R. K., 1988, Use of Fischer plots to define third-order sea-level curves in Ordovician peritidal cyclic carbonates, Appalachians: Geology, v. 16, p. 895-899
Reineck, H. E., 1975, German North Sea tidal flats; in, Tidal Deposits, R. N. Ginsburg, ed.: Springer-Verlag, New York, p. 5-12
Reineck, H. E., and Singh, I. B., 1980, Depositional sedimentary environments: 2d ed., Springer-Verlag, New York, 439 p.
Rona, P. A., 1973, Relations between rates of sediment accumulation on continental shelves, sea-floor spreading, and eustasy inferred from the central North Atlantic: Geological Society of America, Bulletin, v. 84, p. 2,851-2,872
Ross, C. A., 1986, Paleozoic evolution of southern margin of Permian basin: Geological Society of America, Bulletin, v. 97, p. 536-554
Ross, C. A., and Ross, J. R. P., 1987, Late Paleozoic sea levels and depositional sequences: Cushman Foundation for Foraminiferal Research, Special Publication 24, p. 137-149
Schlager, W., 1981, The paradox of drowned reefs and carbonate platforms: Geological Society of America, Bulletin, v. 92, p. 197-211
Shinn, E. A., 1973, Sedimentary accretion along the leeward, SE coast of Qatar Peninsula, Persian Gulf; in, The Persian Gulf, B. H. Purser, ed.: Springer-Verlag, New York, p. 199-2 10
Silver, B. A., and Todd, R. G., 1969, Permian cyclic strata, northern Midland and Delaware basins, west Texas and southeastern New Mexico: American Association of Petroleum Geologists, Bulletin, v. 53, p. 2,223-2,251
Sloss, L. L., 1963, Sequences in the cratonic interior of North America: Geological Society of America, Bulletin, v. 74, p. 93-113
Steckler, M. S., and Watts, A. B., 1978, Subsidence of the Atlantic-type continental margin off New York: Earth and Planetary Science Letters, v. 4 1, p. 1-13
Steinen, R. P., Harrison, R. S., and Matthews, R. K., 1973, Eustatic lowstand of sea level between 125,000 and 105,000 B.P.--evidence from the subsurface of Barbados, West Indies: Geological Society of America, Bulletin, v. 84, p. 63-70
Stevenson, G. M., and Baars, D. L., 1988, Overview--carbonate reservoirs of the Paradox basin: Rocky Mountain Association of Geologists, 1988 Carbonate Symposium, p. 149-162
Stockman, K. W., Ginsburg, R. N., and Shinn, E. A., 1967, The production of lime mud by algae in south Florida: Journal of Sedimentary Petrology, v. 37, p. 633-648
Suess, E., 1888, Das Antlitz der Erder, v. 2: Clarendon Press, Oxford, 254 p.
Taft, W. M., Arrington, F., Haimovitz, A., MacDonald, C., and Woolheater, C., 1968, Lithification of modern carbonate sediments at Yellow Bank, Bahamas: Bulletin of Marine Science, Gulf and Caribbean, v. 18, p. 762-828
Vail, P. R., 1987, Seismic stratigraphy interpretation procedure; in, Atlas of Seismic Stratigraphy, A. W. Bally, ed.: American Association of Petroleum Geologists, Studies in Geology 27, v. 1, P. 1-11.
Vail, P. R., Hardenbol, J., and Todd, R. G., 1984, Jurassic unconformities, chronostratigraphy, and sea-level changes from seismic stratigraphy and biostratigraphy; in, Interregional Unconformities and Hydrocarbon Accumulation, J. S. Schlee, ed.: American Association of Petroleum Geologists, Memoir 36, p. 129-144
Vail, P. R., Mitchum, R. M., Jr., and Thompson, S., III, 1977, Seismic stratigraphy and global changes of sea level; in, Seismic Stratigraphy-Applications to Hydrocarbon Exploration, C. E. Payton, ed.: American Association of Petroleum Geologists, Memoir 26, p. 83-97
Van Eysinga, F. W. B., 1975, Geologic time table: Elsevier Scientific Publishing Co., Amsterdam, 1 p.
Van Wagoner, J. C., Mitchum, R. M., Jr., Posamentier, H. W., and Vail, P. R., 1987, The key definitions of stratigraphy; in, Atlas of Seismic Stratigraphy, A. W. Bally, ed.: American Association of Petroleum Geologists, Studies in Geology 27, v. 1, p. 11-14
Van Wagoner, J. C., Posamentier, H. W., Mitchum, R. M., Vail, P. R., Sarg, J. F., Loutit, T. S., and Hardenbol, J., 1988, An overview of the fundamentals of sequence stratigraphy and key definitions; in, Sea-Level Changes-An Integrated Approach, C. K. Wilgus, B. S. Hastings, H. Posamentier, J. Van Wagoner, C. A. Ross, and G. St. C. Kendall, eds.: Society of Economic Paleontologists and Mineralogists, Special Publication 42, p. 39-46
Walkden, G. M., 1974, Paleokarstic surfaces in the upper Visean (Carboniferous) limestones of the Derbyshire block, England: Journal of Sedimentary Petrology, v. 44, p. 1,232-1,247
Walls, R. A., Harris, W. B., and Nunan, W. E., 1975, Calcareous crust (caliche) profiles and early subaerial exposure of Carboniferous carbonates, northeastern Kentucky: Sedimentology, v. 22, p. 417-440
Wanless, H. R., and Dravis, J. J., 1989, Carbonate environments and sequences of Caicos platform: 28th International Geological Congress, Fieldtrip Guidebook T 374, American Geophysical Union, 75 p.
Wanless, H. R., and Shepard, F. P., 1936, Sea level and climate changes related to late Paleozoic cyclothems: Geological Society of America, Bulletin, v. 47, p. 1, 177-1,206
Weller, M. W., 1964, Development of the concept and interpretation of cyclic sedimentation; in, Symposium on Cyclic Sedimentation, D. F. Merriam, ed.: Kansas Geological Survey, Bulletin 169, p. 607-619 [available online]
Wengerd, S. A., 1963, Stratigraphic section at Honaker Trail, San Juan Canyon, San Juan County, Utah; in, Shelf Carbonates of the Paradox Basin, R. O. Bass, ed.: Four Comers Geological Society, 4th Field Conference Guidebook, p. 235-243
Wengerd, S. A., and Matheny, M. L., 1958, Pennsylvanian System of Four Comers region: American Association of Petroleum Geologists, Bulletin, v. 42, p. 2,048-2,106
Wilson, J. L., 1967, Cyclic and reciprocal sedimentation in Virgilian strata of southern New Mexico: Geological Society of America, Bulletin, v. 78, p. 805-818
Wilson, J. L., 1975, Carbonate facies in geologic history: Springer-Verlag, New York, 471 p.
Kansas Geological Survey
Comments to webadmin@kgs.ku.edu
Web version April 30, 2010. Original publication date 1991.
URL=http://www.kgs.ku.edu/Publications/Bulletins/233/Goldhammer/index.html