Kansas Geological Survey, Bulletin 233, p. 273-291
by
Gerard C. Bond1 and Michelle A. Kominz2
1Lamont-Doherty Geological Observatory
2University of Texas
Some of the confusion in the literature on the history of eustatic sea level over time results from the incorrect assumption that the eustatic signal is given directly by vertical changes in water depths inferred from vertical facies patterns in stratigraphic sections. In particular, increases in water depth are often assumed to record an increase in eustatic sea level, and decreases in water depth are often assumed to record a decrease in eustatic sea level. Vertical changes in water depth, however, reflect only the local relative sea-level change, which is influenced by the balance between changes in the rate at which accommodation space forms (space available for sediments to fill) and changes in the rate at which sediment fills that space. Under certain conditions, which may not be uncommon in many areas, the balance may be such that no significant water depth change occurs, even during a relatively large third-order eustatic cycle, or such that shoaling occurs during a eustatic sea-level rise and deepening occurs during a eustatic sea-level fall. The key to sorting out the correct relation between eustatic sea level and vertical facies changes lies in first identifying the accommodation change, along with its timing and scale, and then determining whether that accommodation change (not the water depth change) occurred synchronously over a large region (continental or intercontinental). Using R2 analysis, a procedure we developed recently, we attempt to distinguish the local relative sea level from the regional or eustatic sea-level signal by recovering the accommodation history from detailed stratigraphic sections that can be correlated over large distances. We describe two examples from the late Middle Cambrian carbonate platform strata in the Cordillera of North America. In the first example, from the Pierson Cove and Trippe Formations in south-central Utah, the water depth changed little during a large (third-order?) accommodation cycle because the accumulation of sediment essentially kept pace with the change in accommodation. The form of the accommodation cycle in the Utah example is corroborated by the results of a Fischer plot of shoaling-upward meter-scale cycles in both formations. The Fischer plot is constrained by evidence, which we describe in another article (Bond et al., this volume) that the cycles are periodic (orbitally forced). In the second example, from the approximately correlative Arctomys and Waterfowl Formations in the southern Canadian Rockies, we have identified a similar-scale accommodation cycle in which the water depth decreased as accommodation increased and then increased as accommodation decreased. This complicated relation between the accommodation cycle and the water depth appears to be due to the effects of a large change in the sediment accumulation rate. The eustatic origin of the accommodation cycle observed in both examples is implied by the similarity in its timing and scale in several stratigraphic sections in the southern Canadian Rockies and in Utah. Demicco et al. (this volume) suggest a different relative sea-level history for the Arctomys and Waterfowl Formations in the southern Canadian Rockies. They suggest, mainly on the basis of water depth changes, that the Arctomys formed during a relative sea-level fall and that the Waterfowl formed during a relative sea-level rise. We do not disagree with their interpretation of the water depth change; our field data indicate the same water depth history in sections 40 km (25 mi) north of theirs. We also recognize in our R2 curves the same cycles that they describe within the Waterfowl Formation (one full cycle and part of another), but in our curves these cycles are strongly modulated by at least two lower orders of cyclicity with time scales of several millions of years to tens of millions of years. We suggest that their interpretation of the Arctomys-Waterfowl sea-level history applies only to the local relative sea-level change, probably mainly confined to the southern Canadian Rockies. Because of the effects of changing sediment accumulation rates, the local sea-level history for these strata is almost the reverse of the accommodation and, probably, the eustatic sea-level change. In addition, their field interpretations and modeling of the sea-level history for the Waterfowl Formation are limited by their emphasis on meter-scale cyclicity and the acquisition of data from a short stratigraphic section comprising only the Arctomys and Waterfowl Formations. Observations limited in this way tend to obscure the lower orders of cyclicity, which we argue from the results of our R2 analyses were important components of the eustatic signal in Middle and Late Cambrian time.
An Acrobat PDF file containing the complete paper is available (1.5 MB).
The application of seismic stratigraphic techniques to outcrops has been successful in reconstructing accommodation histories and inferring changes in eustatic sea level. These techniques work best, however, where it is possible to trace and correlate stratigraphic units over a large enough area to identify key features, such as sequence boundaries. The need for sufficient two- or even three-dimensional stratigraphic control tends to limit the most successful efforts to areas with good biostratigraphic correlations and, especially, good exposures.
In the many areas where such stratigraphic control is lacking, efforts to reconstruct accommodation changes and eustatic sea-level histories have employed more conventional techniques, commonly the analyses of facies changes or systems tracts that can be observed in a measured section. A problem with this approach is that facies do not have a consistent and predictable relation to changes in accommodation space. This has led to confusion and in some instances conflicting interpretations of accommodation events and their implications for sea-level changes from the same stratigraphic sections. A good example is the different interpretation of accommodation and sea-level change for the same Middle Cambrian strata in the southern Canadian Rockies (Bond et al., 1988, 1989; Demicco et al., this volume).
If the correct relation between vertical facies changes and accommodation can be identified, our knowledge and understanding of accommodation and eustatic changes through time can be greatly expanded through the acquisition of one-dimensional data from the many detailed stratigraphic sections that are available or can be measured. Even where there is sufficient control on lateral stratigraphic changes to estimate the position of sequence boundaries, vertical facies patterns are a source of additional information on accommodation histories and may be useful as a test of the sequence stratigraphic interpretation.
Here we review the problem of distinguishing facies patterns from accommodation changes. Using two examples from our recent work, we discuss how a procedure that we developed recently, R2 analysis (Bond et al., 1989), can be useful in sorting out the relation between facies changes and accommodation history. One of these examples is from a section of upper Middle Cambrian strata in Utah that we have analyzed for periodicity (Bond et al., this volume). The other is from approximately correlative upper Middle Cambrian deposits in the southern Canadian Rockies. The example in the southern Canadian Rockies contains the Arctomys and Waterfowl Formations, whose record of eustatic sea level suggested by Bond et al. (1989) has been questioned by Demicco et al. (this volume) and Demicco and Spencer (1990); we develop an argument that may reconcile our different points of view. The stratigraphic data used to construct the various curves described here are available from G. C. Bond on request.
The complicated relation between facies patterns and accommodation change is largely due to the influence of sediment accumulation rates, a concept that was clearly stated recently by Jervey (1988) in the context of sequence stratigraphy. We summarize the main points of his discussion in fig. 1. On the left are hypothetical changes in the rates of two processes; one is the production of accommodation space, which is the cumulative effect of tectonic subsidence, sediment compaction, and regional (or global) sea-level change, and the other is sediment accumulation, which depends on the many factors controlling the rates of sediment supply and rates of sediment deposition. In each of the three examples, A, B, and C (fig. 1), the change in accommodation is the same. Accommodation increases through the entire event, but the rate of increase is initially rapid and then slows. This accommodation change could be produced by changes in the rate of tectonic subsidence or by a eustatic rise and fall of sea level superimposed on a constant rate of tectonic subsidence that exceeds the rate of sea-level fall. We avoid scaling the duration or amplitude of the accommodation event, but it is intended to simulate broadly the third-order accommodation cycles that we have inferred from R2 analyses of Cambrian strata in North America. On average, these cycles probably span 2-10 m.y. and have meter to decimeter amplitudes (Bond et al., 1989).
Figure 1--The curves on the left-hand side give hypothetical changes in the rates of two processes, the production of accommodation space, and the accumulation of sediment. The change in accommodation rate is the same in all three examples. (A) The rate of sediment accumulation begins slower than the accommodation rate and then exceeds it. This causes water depths to decrease with time, producing a shoaling-upward vertical facies pattern. (B) The change in rate of sediment accumulation essentially matches the change in rate of accommodation. This causes water depth to change little with time, producing a vertical facies pattern with little net change in water depth indicators. (C) The sediment accumulation rate at first is higher than the accommodation rate and then decreases, becoming less than the accommodation rate. In this case water depth decreases as accommodation increases and then increases as accommodation decreases. The vertical facies patterns reflect shoaling as accommodation increases and then deepening as accommodation decreases. This is the opposite of the facies pattern produced by the same accommodation event in part A. The diagram is based on concepts discussed by Jervey (1988).
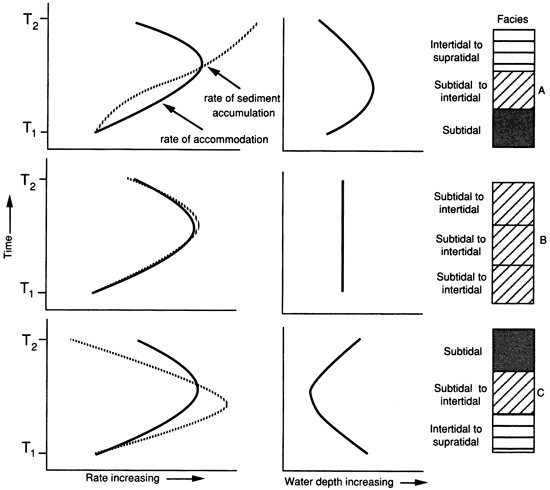
On this fixed change in accommodation rate we superimpose three different sediment accumulation rates. In the first the accumulation rate begins slower than the accommodation rate and then exceeds it. In this case water depth would initially increase and then decrease, producing a deposit that would begin with a relatively deep water facies and end with a shallow-water facies (fig. 1A). This example is often regarded as a common facies response to an increase followed by a decrease in accommodation or sea level [e.g., James (1984)].
In the second example the sediment accumulation rate matches the accommodation rate (fig. 1B). In this case there is little change in water depth through the accommodation event and the facies patterns probably change little, perhaps consisting mostly of intermediate to shallow-water facies. This type of facies response to accommodation has been suggested by Goldhammer et al. (1990) for platform carbonates of Triassic age in the Alps.
In the third example the sediment accumulation rate begins higher than the accommodation rate and then decreases, becoming less than the accommodation rate (fig. 1C). In this case the water depth would decrease as accommodation increases, and then water depth would increase as accommodation decreases. The facies pattern would record shoaling as accommodation increases and then deepening as accommodation decreases. This is the opposite of the facies pattern produced by the same accommodation event in the first example. Devlin et al. (1991) have suggested that this type of model may account for some of the sequence stratigraphic relations in Upper Cretaceous deposits in the foreland basin of southwestern Wyoming.
Because of the effects of sediment accumulation rates on the facies patterns, the interpretation of accommodation or sea-level history from vertical facies changes is far from straightforward. Suppose, for example, that the accommodation cycle in fig. 1 repeats again and again over time and that the repetition is due to eustatic sea-level rises and falls. In addition, suppose that the sediment accumulation rates vary from cycle to cycle and from place to place on the order that we suggest in the examples. For the same eustatic cycle the facies patterns and their implied water depths would be different from one part of a subsiding basin or margin to another. It might even be common to find reversals in the relation between water depth and eustatic change; that is, water depth might increase in one part of the basin or margin and decrease in another part in response to the same eustatic sea-level rise. Where vertical stratigraphic sections are an important (or the only) source of data for reconstructing accommodation or sea-level histories, it is necessary to somehow separate the effects of sedimentation rates on the stratigraphic response to accommodation signals.
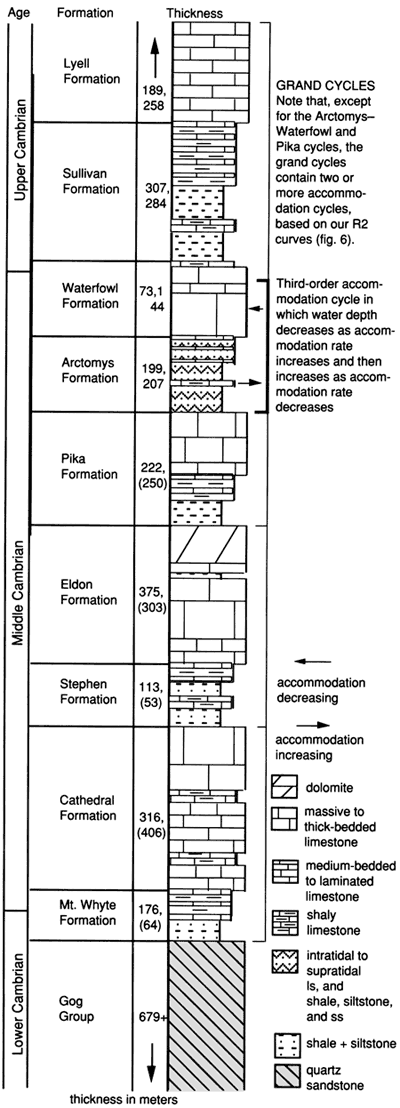
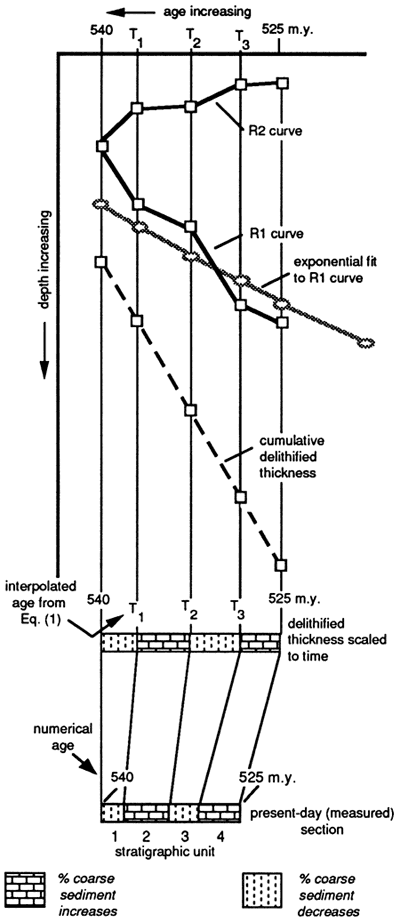
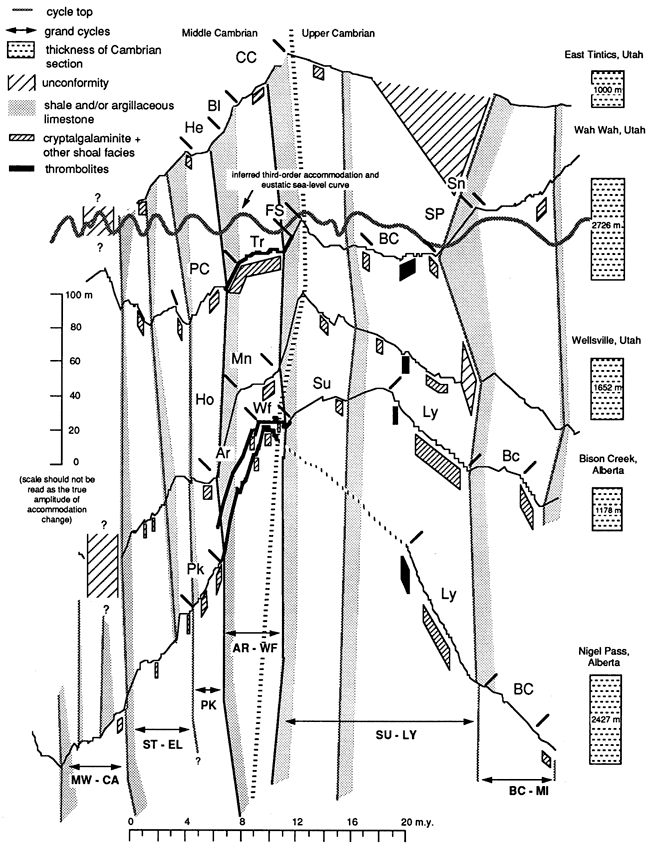
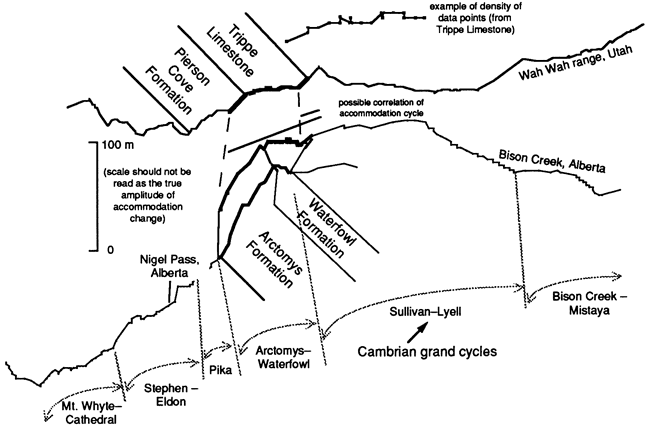
During our study of the evolution of the early Paleozoic passive margins in the Cordilleran and Appalachian miogeoclines of North America, we developed a method, R2 analysis, to extract information on accommodation history from vertical sections. The details of the procedure have been described elsewhere (Bond et al., 1988, 1989). Here, we briefly describe the procedure using a generalized stratigraphic section based on Middle and Upper Cambrian strata exposed near Mt. Wilson in the southern Canadian Rockies (figs. 2-4). These strata lie within an extensive early Paleozoic carbonate bank that formed within the Cordilleran passive margin (fig. 2) and contain the classic grand cycles (fig. 3) originally recognized by Aitken (1966, 1978). Each cycle begins with a relatively fine-grained deposit composed of siliciclastic and carbonate materials and grades upward into a coarser-grained and predominantly carbonate deposit. In the example in fig. 4 we construct the subsidence curves using composite thicknesses and average grain sizes of stratigraphic units so that each half-cycle produces one point. This was done to simplify the stratigraphic data and facilitate the discussion of the methodology in what follows.
Figure 2--Location of the Mt. Wilson section, which we use as an example to describe R2 analysis; the Nigel Pass section, which contains an example of the relation between accommodation, sediment accumulation, and facies shown diagrammatically in fig. 1C; and the sections modeled by Demicco et al. (this volume). Also shown are the major depositional elements of the early Paleozoic passive margin in the southern Canadian Rockies [from Aitken (1966, 1978)].
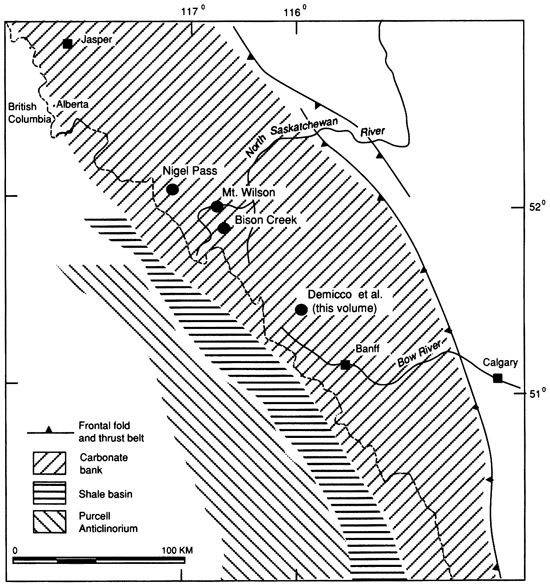
Figure 3--Generalized stratigraphic section, modified from Aitken (1966, 1978), of Cambrian strata in the carbonate bank of the southern Canadian Rockies (Gog Group though Lyell Formation). Grand cycles are from Aitken (1966, 1978). We consider one of these cycles, the Arctomys-Waterfowl cycle, to exemplify the relation between accommodation, sediment accumulation, water depth, and facies shown in fig. 1C. In the thickness column the top numbers are the thicknesses of the Nigel Pass section; the bottom numbers without parentheses are the thicknesses in the Bison Creek section, and the bottom numbers with parentheses are thicknesses of strata approximately 20 km to the south of the Bison Creek section in the same thrust panel.
The curve labeled R1 (first reduction) in fig. 4 is produced by removing the effects of sediment loading and compaction from the cumulative thickness curve for the section. The R1 curve can be thought of as an approximation of the accommodation space produced by the tectonic subsidence of the passive margin and by all "external" events superimposed on the tectonic subsidence. The curve labeled R2 (second reduction) in fig. 4 is produced by removing from the R1 curve the accommodation produced by the tectonic subsidence. We can be reasonably sure that the tectonic subsidence has decayed exponentially through time since the Middle and Upper Cambrian strata were deposited during the postrift phase of the passive margin (Bond and Kominz, 1984). Therefore, to remove the accommodation space produced by the tectonic subsidence, we fit an exponential curve to the R1 curve and subtract it from that curve. The exponential curve we use for this step has a decay constant of 62.8 m.y., which is the decay constant for the exponential subsidence of average ocean floor (Parsons and Sclater, 1977).
Figure 4--R1 and R2 curves for the Mt. Wilson section (located in fig. 2) constructed by assuming minimum delithification factors for the carbonate sediments and maximum delithification factors for the shaly sediments [delithification factors given by Bond and Kominz (1984)]. This has the effect of creating an irregular subsidence pattern directly related to the grand cycles [from Aitken (1966, 1978)], as seen in the Mt. Wilson section. The exponential curve has a decay constant of 62.8 m.y. and is fitted to the R1 curve. The exponential curve is assumed to approximate the accommodation space generated by thermal subsidence of the margin. By subtracting the exponential curve from the R1 curve, we obtain an R2 curve, which contains the external accommodation events superimposed on the thermal subsidence.
As can be seen in fig. 4, the R2 curve contains a number of distinct rising and falling segments. Each rising segment corresponds to the finer-grained part of a grand cycle, and each falling segment corresponds to the coarser-grained part of the cycle (see also fig. 3). The zigzag pattern in the R2 curve occurs because we applied appropriate delithification factors to the different lithologies in the stratigraphic section. We decompacted finer-grained sediments more than we decompacted coarser-grained sediments using the delithification factors outlined by Bond and Kominz (1984); we also assumed that organic deposits or boundstones, such as algal laminites, stromatolites, and thrombolites, even though fine grained, compacted little during burial. Although it is difficult to be certain of the exact compaction corrections as a function of the different lithologies in the sections we have analyzed, our assumption that fine-grained material compacts more than coarse-grained material (except for boundstones) is consistent with widely accepted views of compaction of siliciclastic and carbonate materials. Thus we interpret the R2 curve as a record of relatively short-term cyclic changes in accommodation space (or the rate of change in accommodation space) superimposed on a relatively long-term increase in accommodation space produced by the exponentially decaying tectonic subsidence of the passive margin. The short-term accommodation cycles have durations of the order of 2-10 m.y. based on the numerical time scale (fig. 4), suggesting that they are comparable in duration to the third-order cycles defined by Vail et al. (1977).
One point in our previous description of the procedure for R2 analysis that needs to be clarified is how time is assigned to each measured unit in the section. This is an important step in the procedure because there are not enough well-documented numerical ages within the Cambrian (and within most strata for that matter) to identify third-order and higher-order cyclicity. We assign time to the delithified section, not to the observed section. This is done to reduce as much as possible the distortion of the original time-thickness relation caused by compaction (fig. 5). After delithifying the strata, the ages of the measured units are calculated by linear interpolation between the numerical ages assigned to the Cambrian stages, that is, 540, 525, and 505 Ma [see Eq. (1) in fig. 5]. We do not incorporate estimates of water depths for the measured units in this calculation of ages. (The effects of water depth changes on the form of the R2 curves are considered in a later step in the procedure.) The assumption that the rate of accumulation of the delithified strata was linear between the Cambrian numerical ages is equivalent to the assumption that the accumulation of delithified thickness kept pace with the exponential subsidence of the margin; this is because the numerical ages are spaced far enough apart that the exponential subsidence is essentially linear between them (e.g., fig. 4).
Figure 5--Our procedure for assigning ages to stratigraphic units by linear interpolation between stratigraphic levels to which a numerical age has been assigned. The equation for this interpolation is
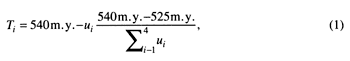
where ui is the delithified thickness of stratigraphic unit i, i = 1, 4, and Ti is the interpolated age of stratigraphic unit i, i = 1, 2, 3. Note that the ages are assigned to the delithified section, not to the observed (or measured) section. Consequently, the form of the R2 curve reflects the differences in delithified densities, not the delithified thicknesses. See text for discussion.
Because our calculation of ages is based on the delithified sediment thicknesses, the zigzags in the R2 curve are not caused by the greater increase in thickness per unit of the finer-grained material relative to the coarser-grained material when we delithify the strata. Rather, the zigzag pattern results because the delithified finer-grained material is lighter per unit thickness (has more water) than the coarser-grained material. Because the finer-grained material is lighter, it causes less sediment loading per unit thickness and therefore requires more tectonic subsidence per unit thickness than the coarser-grained material. Thus the R2 curve, uncorrected for water depth and sedimentation rate, essentially maps the changes in accommodation space required by the variations in the delithified densities of the strata.
Because R2 curves are highly sensitive to the amount of mud or shale that is estimated to be present in each lithologic unit, the curves probably are an approximation o gamma logs. Thus all the procedures that we use to construct and interpret R2 curves probably can be applied to gamma logs from down-hole logging and outcrop logging.
In our previous work we made tests on one section from northeastern Utah (in the Wellsville area) to determine whether the rises and falls in the R2 curves could be removed by making reasonable corrections for water depth and sedimentation rate as a function of facies (Bond et al., 1989). We found that, regardless of whether we use an upper or lower estimate of water depth, we obtained large decreases in accommodation or accommodation rates in the upper coarser-grained halves of the cycles. In fact, the decreases in accommodation or accommodation rate were so large that they could not be eliminated unless sedimentation rates were negative, an impossibility. The results of these tests imply that it is not possible to smooth out the overall form of the accommodation events in the R2 curves using any combination of sedimentation rates and our estimates of water depth as a function of facies. We emphasize, however, that these tests have been applied to only one section; we are presently applying similar tests to other sections for which we have constructed R2 curves.
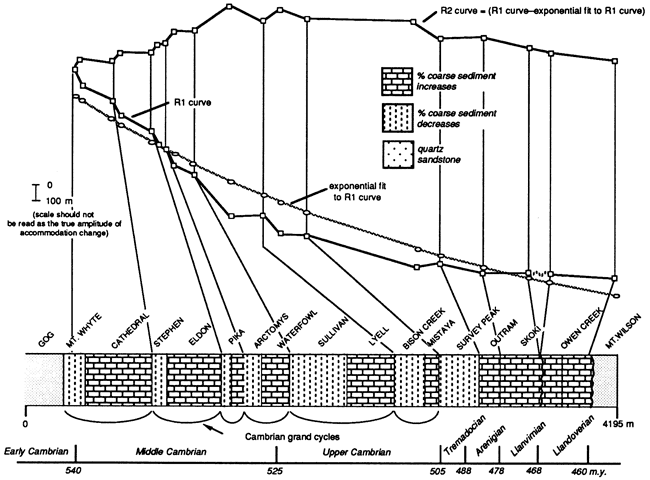
The argument that the changes in accommodation may be due to eustatic sea-level fluctuations is not based on comparisons of water depth or facies. We suggested a eustatic mechanism for the accommodation events because, based on the best available correlations of the sections we measured, shown in fig. 6, the events appear to have similar timing around the perimeter of North America [see Bond et al. (1989) for details of the construction of fig. 6; note that water depth corrections have not been added to the R2 curves]. Bond et al. (1989) recognized that the accommodation cycle boundaries could be diachronous [see also Mount et al. (1991)]. They emphasized that the best evidence of eustatic or other global forcing mechanisms is not the correlation of cycle boundaries over a large area but rather whether the same number of accommodation cycles occurs between the same chronostratigraphic boundaries over a large area (Bond et al., 1989, figs. 9 and 10). The degree of correlation of the events on such a large scale rules out local tectonics as a mechanism, leaving an explanation in either cyclic vertical movements of the entire continent or cyclic changes in global sea level. Global sea-level change seems to be a more plausible mechanism than cyclic vertical motions of entire continents on time scales of 106 years. Because our curves in fig. 6 are constrained by a point for every meter-scale unit that we measured, producing on average I point for every 2 m (7 ft) of section, the R2 curves contain much more detail than observed in the curve in fig. 4. The most important result of the higher resolution of the curves in fig. 6 is that there is more than one third-order (or 106_year-scale) accommodation event within most of the Cambrian grand cycles [fig. 6; Bond et al. (1989,figs. 9 and 10); note that, in citing our 1989 paper, Mount et al. (199 1) incorrectly stated that we identified only one accommodation cycle in each grand cycle]. We are testing these results with additional R2 analyses of cratonic sections that we have measured in Montana and Wyoming.
Figure 6--R2 curves for Middle and Upper Cambrian sections in the Cordilleran miogeocline. These curves are produced by first removing the effects of compaction and sediment loading from cumulative thickness curves and then subtracting a best-fit exponential curve with a decay constant of 62.8 m.y., which we assume approximates the tectonic (thermally controlled) subsidence of the passive margin (Bond et al., 1988, 1989). The residual curve, the R2 curve, is a measure of the changes in accommodation or relative sea level that were superimposed on the thermally controlled subsidence. The positive changes in slope in the R2 curves indicate increases in accommodation or accommodation rate, and negative changes in slope indicate decreases in accommodation or accommodation rate. Water depth corrections have not been added to the R2 curves. The diagram contains revisions to Bond et al. (1989). See text for discussion.
Wah Wah Range, Utah: PC, Pierson Cove Formation; Tr, lower limestone member of the Trippe Limestone; FS, Fish Springs member of the Trippe Limestone; BC, Big Horse Canyon member of Orr Formation; SP, Sneakover Pass shale member of Orr Formation; SP, Steamboat Pass shale member of Orr Formation. Wellsville, Utah: HO, Hodges shale member of the Bloomington Formation; Mn, middle member of the Bloomington Formation. East Tintics: He, Herkimer Formation; BI, Bluebird member; CC, Cole Canyon member. Bison Creek and Nigel Pass, southern Canadian Rockies: Pk, Pika Formation; Ar, Arctomys Formation; Wf, Waterfowl Formation; Ly, Lyell Formation; BC, Bison Creek Formation. Sources of data are given by Bond et al. (1989). Abbreviations for the grand cycles [from Aitken (1966, 1978)] are as follows: MW-CA, Mt. Whyte-Cathedral; ST-EL, Stephen-Eldon; PK, Pika; AR-WF, Arctomys-Waterfowl; SU-LY, Sullivan-Eldon; BC-MI, Bison Creek-Mistaya.
Demicco and Spencer (1990) have criticized our correlation of the accommodation events in the R2 curves and the implication of that correlation for eustasy on the basis that the reference datum that we used to align the curves is the rising segment of the R2 curve corresponding to the Arctomys Formation in the southern Canadian Rockies (fig. 6). The Arctomys Formation records shoaling relative to the underlying and overlying formations (Pika and Waterfowl Formations, respectively; fig. 6) (Aitken, 1966,1978). Demicco and Spencer argue that the decrease in water depth is not compatible with an increase in eustatic sea level, and therefore the Arctomys Formation should not be used as a datum to correlate other rising segments, as we have done. Apart from the fact that the relation between water depth changes and accommodation or eustatic sea-level changes is not straightforward, our argument for synchroneity of the accommodation events and their eustatic origin does not depend on our choice of the Arctomys Formation as the reference datum. Any of several other rising segments of the R2 curves are as suitable as the one we chose for a reference datum, especially in the Middle Cambrian part of the curves [e.g., Bond et al. (1989, figs. 9 and 10)]. For example, as can be seen in fig. 6, using a different rising segment as a datum (equivalent to the base of the Stephen Formation in the southern Canadian Rockies) gives the same correlation of accommodation events and implication for eustatic sea-level changes as that by Bond et al. (1989).
The R2 curves in fig. 6 incorporate some revisions that we have made to the R2 curves by Bond et al. (1989). In the Wah Wah R2 curve, we have removed an unconformity that was originally placed between the Steamboat Pass shale member and the Sneakover limestone member of the Orr Formation (SP and Sn, respectively, in fig. 6). This unconformity was originally placed in the curve based on speculation by Hintze and Palmer (1976) that the relatively thin stratigraphic interval containing the Dunderbergia zone in the Steamboat Pass shale member was related to the pre-Elvinia regression recognized earlier by Palmer (1971). Rowell (personal communication, 1990) has suggested instead that the thin stratigraphic interval is a condensed interval that formed during a relative sea-level rise. In fact, the R2 curve for the Wah Wah range (Bond et al., 1989) indicates that the Steamboat Pass shale containing the Dunderbergia zone occurs in the rising segment of a third-order event that follows a fall culminating at the top of the Bighorse Canyon, as would be anticipated for a condensed interval (see also fig. 6).
A second revision is the removal of the unconformity in the uppermost part of the Lyell Formation (Ly in fig. 6) in the R2 curves from the southern Canadian Rockies. This unconformity was inferred by Palmer (1981) from the apparent absence of the Dunderbergia zone in the upper Lyell strata. Recently, Westrop (1989) has concurred with Fritz (1981) that faunas equivalent to the Dunderbergia zone are present in the upper part of the Lyell Formation and that there is no physical evidence for a stratigraphic break at the level of the unconformity inferred by Palmer (1981).
We describe two sections from the Cordilleran passive margin that we believe contain examples of different vertical facies responses to similar accommodation cycles, examples similar to those described in fig. 1. One section is from the Wah Wah range in south-central Utah, and the other is from two sections in the southern Canadian Rockies, one from the Nigel Pass area and the other from Bison Creek (fig. 2).
The example from the Wah Wah range contains the two sections of meter-scale cyclic strata that we analyzed for periodicity [see Bond et al. (this volume)]. These sections are the upper part of the Pierson Cove Formation and the lower member of the Trippe Limestone (figs. 7 and 8). The depositional setting of strata in the two sections has been interpreted as part of a persistent broad shoal complex (Kepper, 1972; Robison, 1964; Hintze and Robison, 1975) in which the middle carbonate belt of Palmer (1971) was deposited. The most common cycles in both stratigraphic units begin with a subtidal burrowed calcisiltite and are capped by a laminated, mud-cracked intertidal to supratidal deposit that is probably a cryptalgalaminate [see Bond et al. (this volume) for a description of the cycles].
Figure 7--Location map of the Wah Wah section, Wah Wah range, south-central Utah, and the regional depositional setting.
Figure 8--Generalized stratigraphic section, modified from Wheeler (1980), Hintze (1974), and Bond (unpublished field data, 1989), of Cambrian strata in the Wah Wah range, south-central Utah. We consider the upper Pierson Cove through Trippe Limestone interval to exemplify the relation between accommodation and facies shown in fig. 1B.
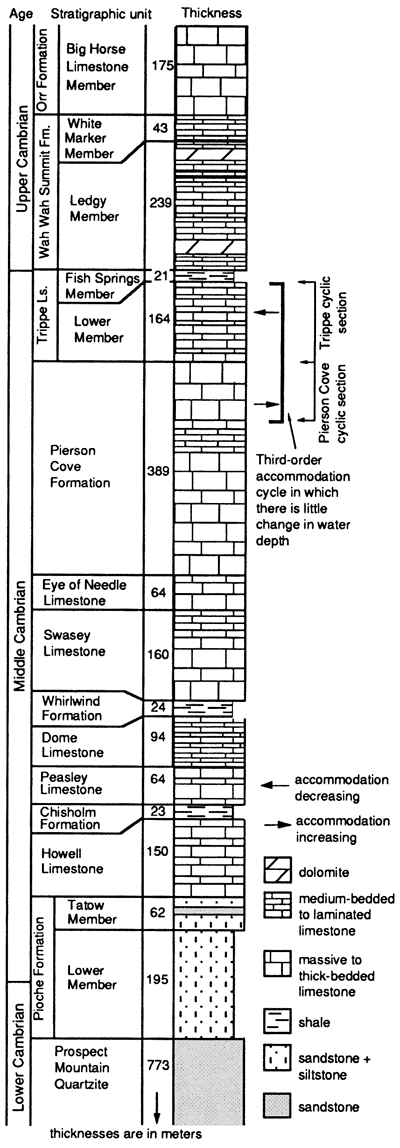
What is interesting about this cyclic section is that, although there is no evidence of a substantial net bathymetric change within and between the two cyclic intervals (nearly all the meter-scale cycles begin with similar subtidal deposits and are capped by intratidal to supratidal deposits), the segment of the R2 curve corresponding to this interval in the Wah Wah range suggests the presence of a relatively large change in accommodation (figs. 6 and 9). The upper Pierson Cove strata correspond to an increase in accommodation space or rate, and the lower member of the Trippe Limestone corresponds to a decrease in accommodation space or rate. The reason that R2 analysis generated this form of change in accommodation is that the burrowed subtidal facies are the finest-grained facies in the cycles in both formations, and the percentage of this fine-grained facies is higher in the upper Pierson Cove strata than in the lower member of the Trippe Limestone. Thus the decompacted upper Pierson Cove strata are overall less dense than the decompacted lower member of the Trippe Limestone strata and, following our earlier argument, require more accommodation space. Adding water depth corrections to the R2 curve probably would not change the overall shape because there is so little change in water depth within and between both formations.
Figure 9--Enlargement of the segments (boldface lines) in fig. 6 that pertain to the discussion of the relation between accommodation and vertical facies patterns in the Pierson Cove-Trippe interval in Utah and the Arctomys-Waterfowl interval in the southern Canadian Rockies. Note the large number of points, each of which corresponds to a measured unit, that constrain the forms of the curves.
The lack of significant change in water depth while a large change in accommodation is underway can be explained in terms of our example in fig. 1B; that is, the sediment accumulation essentially paced or tracked the change in accommodation. That sediment accumulation closely tracked accommodation changes is not surprising in these strata in the Wah Wah range. Most of the Middle and Upper Cambrian strata in this area were deposited in a persistently shallow peritidal shoal complex that lay along the margin of a deeper-water basin to the west, the House embayment. Boundstones, such as those that cap the cycles in the upper Pierson Cove strata and the lower member of the Trippe Limestone, are common in more than half of the Middle and Upper Cambrian strata (Bond, unpublished data, 1989). Kepper (1981a, b) and Rees (1986) have suggested that the shoal complex was maintained over time by persistent uplift of the margin of the House embayment as the basin subsided. Such an environment would favor high carbonate production rates that probably could easily keep pace with even relatively large increases in accommodation or accommodation rates.
There also is evidence in the nature of the cycles within the Pierson Cove and Trippe strata that appears to be compatible with the form of accommodation change in the R2 curve. The laminite caps of the cycles in the Pierson Cove Formation are commonly mud cracked, but they lack the pervasive dolomitization that characterizes virtually all the laminite caps in the Trippe Limestone [see Bond et al. (this volume)]. One explanation for the difference between the cycles in the two formations is that the increase in net subsidence rate during deposition of the Pierson Cove cycles, indicated by the rising segment of the R2 curve, could have reduced the exposure time of the cycle tops sufficiently to prevent pervasive desiccation and dolomitization. In contrast, the decrease in net subsidence rate during deposition of the Trippe cycles, implied by the falling segment of the R2 curves, could have increased the exposure time of cycle tops sufficiently to cause extensive dolomitization.
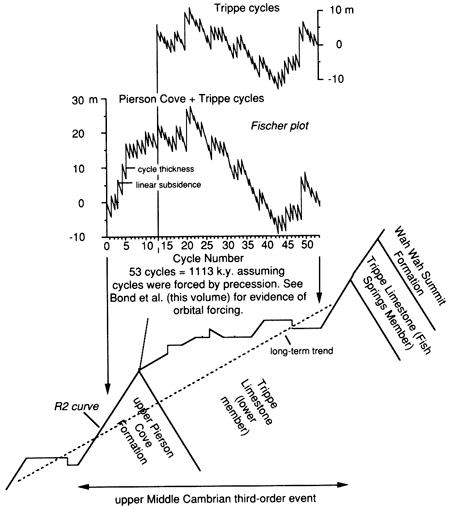
Recently, there have been efforts to evaluate changes in accommodation by plotting the differences between cycle thicknesses and an inferred constant tectonic subsidence (Read, 1989; Goldhammer et al., 1990). This procedure, originated by Fischer (1964), measures long-term changes in accommodation that are required for deposition of a sequence of cycles of varying thickness, provided that the cycles have a constant period and that cycles are not missing. The requirement of periodicity is a severe limitation to the method, but the technique is appropriate for at least the lower member of the Trippe Limestone because we have independent evidence from our spectral analyses that the primary cycles were forced by orbitally controlled insolation changes. This is implied by a spectrum in which the statistically significant peaks appear to have periodicities corresponding to precession and eccentricity (Bond et al., this volume, fig. 11). Moreover, the spectral distance between the presumed eccentricity and precessional peaks is close to that predicted for an insolation signal, suggesting that there probably has not been a substantial loss of entire cycles.
A Fischer plot of cycles in the Trippe section reveals a modulation that suggests an overall long-term relative fall (with reversals to some extent) through the section (fig. 10). The form of this long-term event is similar to the form of the third-order event in the corresponding R2 curve. Assuming that the primary cycles from the Pierson Cove section also are periodic, as provisionally supported by our spectral data (Bond et al., this volume, fig. 14), we combine this interval with the Trippe cycles in a second Fischer plot. The correlation of the two sections is based on direct lateral continuity of cycles between the two locations where the sections were measured. The form of this plot reveals a long-term rise in accommodation, produced mainly by the thick Pierson Cove cycles, followed by a relatively broad crest and then overall rapid fall through the thinner Trippe cycles. The form of this curve also closely follows the form of the corresponding R2 accommodation event (fig. 10).
Figure 10--Comparison of the upper Middle Cambrian R2 event, indicated by the boldface line in the R2 curves in figs. 6 and 9, with a Fischer plot of the cycles in the upper Pierson Cove Formation and in the Trippe Limestone. The Fischer plot is constrained by our evidence that the cycles in both formations are periodic [see Bond et al. (this volume)]. Both the R2 curve and the Fischer plot have the same form and similar timing, thereby strengthening our argument that R2 curves provide an accurate measure of changes in accommodation in a stratigraphic section. Note that the form of the Fischer plot must be compared with the form of the R2 curve relative to the long-term trend (dashed line).
The second example, from the Nigel Pass area and Bison Creek in the southern Canadian Rockies, contains the Arctomys and Waterfowl Formations (figs. 2 and 3), which together constitute one of the Cambrian grand cycles of Aitken (1966, 1978). These two formations were deposited within the extensive carbonate bank complex that occupied the inner part of the early Paleozoic passive margin in the southern Canadian Rockies (fig. 2). In the Nigel Pass area the Arctomys Formation is characterized by meter-scale cycles that contain in the lower parts thin, crossbedded layers of quartz sandstones and siltstones completely interbedded with shales. These deposits grade upward into green and maroon shales with minor amounts of muddy quartzose siltstone. In the Bison Creek section cycles largely composed of laminated carbonate at the base and green and maroon shale and quartzose siltstone at the top are common. The large amount of quartzose sandstone and siltstone is an especially distinctive feature of the Arctomys Formation. In Nigel Pass, approximately 11 m (36 ft) of interbedded laminite, ooid grainstone, thrombolites, and parted calcisiltite occurs in the middle of the formation. In the Bison Creek section scattered thrombolites occur in the middle and upper parts of the formation. The contact between the Arctomys Formation and the overlying Waterfowl Formation is gradational over a few meters to tens of meters.
In the overlying Waterfowl Formation in the Bison Creek and Nigel Pass areas, the amount of siliciclastic material is much lower, and the formation contains a larger percentage of subtidal facies than the Arctomys Formation. Most of the subtidal facies occur in laminite-capped meter-scale cycles and are composed of parted, fine-grained limestone, burrowed, muddy calcisiltite, and thrombolites. The subtidal material is most common in the lower and upper thirds of the formation. In the middle part of the formation, there is a distinct shoaling interval with a relatively large proportion of grainstone and mud-cracked laminite. Overall, the Waterfowl Formation is more heterolithic than the Arctomys Formation, and it records an average water depth that is somewhat greater than the average water depth of the Arctomys Formation (Aitken, 1978; Waters et al., 1989; Cloyd et al., 1990; Demicco and Spencer, 1990; Demicco et al., this volume; Bond, unpublished data, 1989).
A comparison of the form of the R2 curve in figs. 6 and 9 with that for the Arctomys and Waterfowl Formations shows that the Arctomys Formation produces a rising segment relative to the curve for the underlying Pika Formation, implying an increase in accommodation or accommodation rate. The overlying Waterfowl Formation produces a falling or at least flatter segment, implying a decrease in accommodation or accommodation rate relative to that for the Arctomys Formation. The reason that R2 analysis generated this form of change in accommodation is that the Arctomys Formation contains more finer-grained material than the underlying Pika Formation and the overlying Waterfowl strata so that, as we have argued, after delithification the Arctomys strata are lighter and require more accommodation per unit thickness than the Waterfowl strata. Although the water depths increase somewhat in the lower and upper parts of the Waterfowl Formation, we have not added estimates of water depth changes to the curves. This is difficult to do accurately, and, given the abundance of shoaling-upward cycles capped by intratidal deposits throughout the formation (Waters et al., 1989; Demicco et al., this volume; Bond, unpublished data, 1989), the increases probably are not continuous enough through either part of the formation to alter significantly the shape of the R2 curve.
The relationship between the Pika-Arctomys-Waterfowl strata and the form of the R2 curves implies that, although accommodation was increasing during deposition of the Arctomys Formation, there was shoaling or a decrease in water depth, and, although accommodation was decreasing during deposition of the overlying Waterfowl Formation, there was an overall increase in water depth. This relation between water depth and accommodation can be explained as the effect of a high rate of sediment accumulation on the vertical facies pattern, as in fig. 1C. During deposition of the Arctomys Formation, the sedimentation rate was greater than the rate of increase in accommodation; thus the facies pattern indicates shoaling relative to the underlying Pika and overlying Waterfowl Formations. In the terminology of sequence stratigraphy, these facies might be interpreted as a highstand or even a lowstand systems tract. During deposition of at least the lower part of the overlying Waterfowl Formation, the reduction in the rate of sedimentation was faster than the reduction in the rate of accommodation so that there was an increase in water depth, leading to formation of overall deeper-water facies. These facies might be regarded as a transgressive systems tract.
An important question is, What might have caused the sediment accumulation rates to be so high during deposition of the Arctomys Formation and then fall during deposition of the Waterfowl Formation? An answer to that question is suggested by the unusual abundance of relatively coarse siliciclastic material in the Arctomys Formation, a composition that sets it apart from virtually all other Middle and Upper Cambrian strata in the carbonate platform of the southern Canadian Rockies. This distinctive composition records an anomalous major influx of siliciclastic material to the carbonate platform, presumably from the craton. We suggest that the rate of supply of this material was high enough to cause the rate of sediment accumulation to exceed the rate at which accommodation space was being produced. In addition, because siliciclastic material can accumulate above the critical water depth that limits the upward accretion of carbonate sediment, the high sedimentation rate can also explain the alluvial and lacustrine facies identified by Demicco and Spencer (1990) in the Arctomys Formation. Those facies, therefore, do not necessarily indicate formation of a sequence boundary. After deposition of the Arctomys Formation, the supply of the siliciclastic material must have been nearly terminated, judging from the sediments' scarcity in the overlying Waterfowl strata. With the termination of the rapid influx of siliciclastic material and continued subsidence of the margin, water depth increased and the more normal carbonate sedimentation that persisted through most of Middle and Late Cambrian time resumed, leading to the subtidal to intratidal carbonate facies in the Waterfowl Formation.
Where the apparently short-lived late Middle Cambrian source of the Arctomys sandstones and siltstones was located on the craton is not known. Some of the large, persistent arches and domes of the western craton edge, such as the Lemhi arch in Idaho, the Peace River arch in northern Alberta, the West Alberta arch in southwestern Alberta, and "Montainia" in southwestern Alberta, southeastern British Columbia, Idaho, and Montana, were uplifted during early Paleozoic time (O'Connell et al., 1990; Ruppel, 1986; Porter et al., 1982). The exact timing of movement of these structures is poorly known. It is interesting to note, however, that the Peace River arch may have been uplifted in Middle Cambrian time (Cant, 1988) and that in south-central Montana anomalous coarse-grained, arkosic sandstones in the Park Shale, a stratigraphic equivalent of at least part of the Arctomys Formation, are thought to have been derived from a nearby Middle Cambrian basement high (Fryxell and Smith, 1986). Perhaps the unusual concentrations of late Middle Cambrian coarse sandstones in the northwestern United States and southwestern Canada are evidence of an episode of differential uplift of the arches along the cratonic edge in late Middle Cambrian time that was more widespread than has been realized.
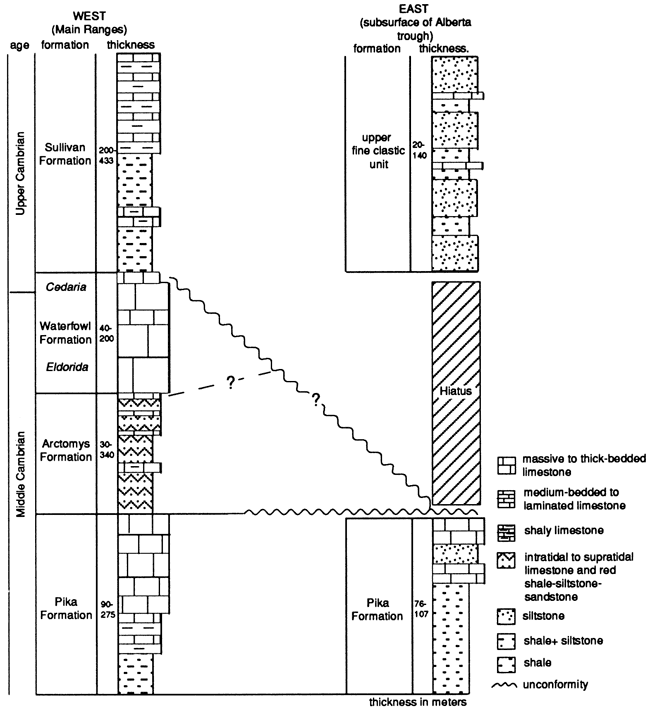
Our interpretation of the accommodation history for the Arctomys-Waterfowl strata would seem to be the opposite of the form of third-order history proposed for the same strata by Demicco et al. (this volume; see their figs. 3, 8, and 9) in measured sections 75 km (47 mi) to the south of the Nigel Pass and Bison Creek sections (fig. 2). Demicco et al. regard the Arctomys deposits as forming at or close to a sequence boundary, presumably a type 2 sequence boundary, and they suggest that the Waterfowl Formation contains one complete third-order cycle and part of a second.
One critical test of their interpretation is whether a regional unconformity occurs to the east at the inferred position of the type 2 boundary. A well-documented upper Middle Cambrian regional unconformity does occur in the slowly subsiding part of the passive margin to the east in the subsurface of the Alberta trough (Aitken and Greggs, 1967; Pugh, 1971). That unconformity does not necessarily indicate the presence of a sequence boundary at the level of the Arctomys Formation, however, because both the Arctomys and Waterfowl Formations are missing at the erosional surface (fig. 11). The available stratigraphic data do not rule out the possibly that the regional unconformity occurs at the level of the Waterfowl Formation, which would be consistent with our interpretation that the Waterfowl Formation was deposited during a third-order reduction in accommodation caused by a eustatic sea-level fall (Bond et al., 1989). In fact, Aitken (1968) argued that the Waterfowl Formation is missing in the subsurface to the east because of nondeposition or erosion; he based this conclusion on the regional stratigraphic relations and limited evidence for erosion at the top of the Waterfowl Formation south of Jasper. We also emphasize that, because higher-order sea-level changes are commonly superimposed on third-order events, unconformities may punctuate both the rising and the falling third-order signal, particularly if shoal facies were deposited during increasing accommodation. Thus without superb outcrop control it can be difficult to identify the truly regional unconformities that mark the larger-order sea-level falls.
Figure 11--Correlation of Pika through Sullivan Formations with subsurface stratigraphy in the Alberta trough in the vicinity of Calgary (fig. 2). Modified from Aitken (1968). Note that both the Arctomys and Waterfowl Formations are missing at the regional unconformity in the subsurface. Aitken (1968) suggested from limited evidence that the unconformity occurs at the top of the Waterfowl Formation in the Main Ranges, as shown in the figure, which, if correct, would support our interpretation of a major sequence boundary at the top of the Waterfowl Formation, not within the Arctomys Formation as suggested by Demicco et al. (this volume) and Demicco and Spencer (1990).
The question of scale enters into the problem of interpreting the accommodation cycles in the Waterfowl and Arctomys Formations in another way. When the R2 curve corresponding to the Arctomys-Waterfowl interval is viewed on a large scale, as in fig. 6, it is apparent that it and other similar accommodation cycles are modulated by a single long-term rising and falling accommodation cycle spanning Middle and Late Cambrian time. We have suggested that this long-term event is equivalent to the Sauk transgressive and regressive cycle that Sloss (1963) identified on the craton (Bond et al., 1989). (The largest-scale accommodation event is the thermally controlled subsidence of the passive margin itself, given by the exponential curve fitted to the R1 curve in fig. 4.)
On the other hand, when the R2 curve is viewed on a small scale, as in fig. 12, it is evident that the accommodation cycle corresponding to the Arctomys and Waterfowl Formations contains several higher-order accommodation cycles. The hierarchy of accommodation cycles can be seen best by progressively removing successively higher orders of accommodation cycles from the R2 curve. The long-term Sauk accommodation cycle is approximated by a polynomial curve, curve B in fig. 12, that was fitted to the entire R2 curve for Middle and Upper Cambrian strata in the vicinity of Bison Creek. Data for the Mt. Whyte through Pika Formations, which are not exposed at Bison Creek, were obtained from a section approximately 20 km (12 mi) to the south in the same thrust panel. If the long-term cycle or curve B is removed first from the R2 curve, it becomes clear that the Arctomys and Waterfowl Formations correspond to a single prominent cycle, indicated by curve C in fig. 12. The rising segment of this cycle corresponds to the Arctomys Formation, and the falling segment corresponds to the Waterfowl Formation. It is this scale or order of accommodation cyclicity that we have suggested may be synchronous on a continental scale and may be a record of third-order changes in eustatic sea level (Bond et at., 1989).
Figure 12--An explanation for part of the difference in the interpretation of the Arctomys-Waterfowl stratigraphic interval in the southern Canadian Rockies by us and by Demicco et al. (this volume). Demicco et al. identify one full relative sea-level cycle and part of another within the Waterfowl Formation. These cycles also appear in our R2 curve, but they can be seen best after the lower orders of accommodation cycles have been removed from the R2 curve. The diagram emphasizes the importance of reference frame when observing the form of a high order of cyclicity (such as that within the Waterfowl Formation) that has been modulated by one or more lower orders of cyclicity. We suggest from this diagram that the difficulty in determining the relation between accommodation and sediment accumulation rates is only part of the reason that Demicco et al. did not identify the lower orders of cyclicity that we observe in the R2 curves; their models are limited by their emphasis on meter-scale cycles and by a short stratigraphic interval. (See text for a full discussion.) Curve A is the segment of the R2 curve from the Bison Creek section (see fig. 9). Curve B (second-order accommodation component?) is a segment of the smooth curve fitted to the entire R2 curve for the Bison Creek section. Curve C (third-order accommodation component?) is a smoothed accommodation curve with a reference frame equal to the long-term (Middle-Upper Cambrian) accommodation curve; this curve is not to scale, and its amplitude has been exaggerated. Curve D is a smooth curve fitted to curve C. Curve E (fourth-order accommodation component?) is a smoothed accommodation curve with a reference frame equal to the Arctomys-Waterfowl accommodation curve (curve C); this curve is also not to scale, and its amplitude has been exaggerated.
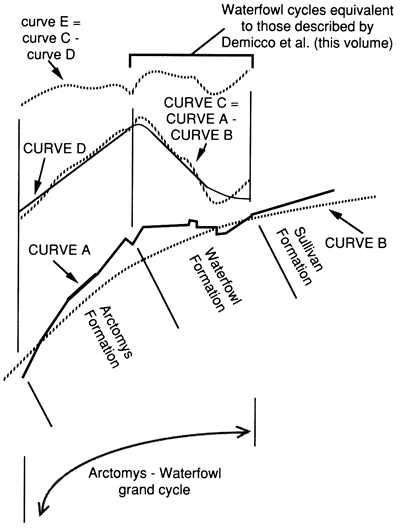
If a smooth curve fitted to the Arctomys-Waterfowl cycle (curve D) is removed next, producing curve E in fig. 12, the Arctomys Formation contains two higher-order cycles and the Waterfowl Formation contains one higher-order cycle and part of a second. These cycles are difficult to see in fig. 6 because of the strong modulating effect of the lower-order accommodation cycles. The cycles within both formations are probably of similar duration, but the Waterfowl cycles appear to have slightly larger amplitudes. The many shoaling-upward meter-scale cycles that occur in both formations are superimposed on the cycles in curve E; these cycles are not shown in fig. 12. Although the form of the fitted curves can be varied somewhat, it should be clear from the complex, irregular shape of the entire Bison Creek R2 curve (fig. 6) that the curve consists of a hierarchy of superimposed cycles whose shapes in general must be similar to those in fig. 12.
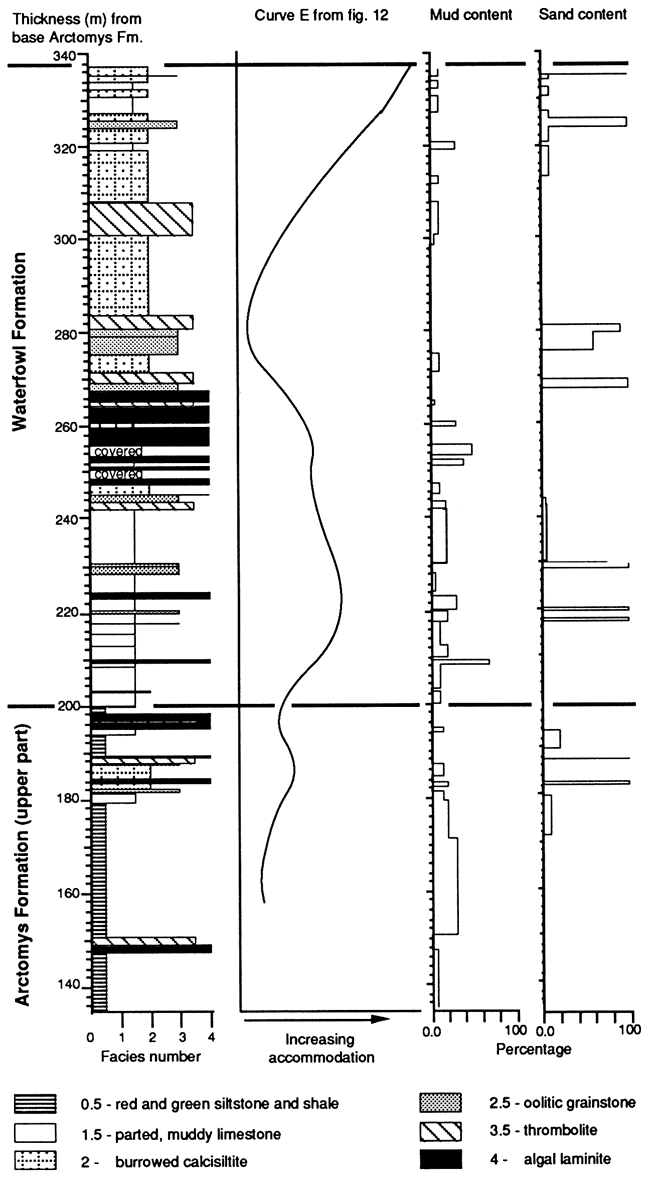
Although we cannot correlate our measured sections in detail with those of Demicco et al. (this volume), it seems likely that the relative sea-level cycles that they recognized in the Waterfowl Formation are equivalent to the higher-order cycles that we infer for the formation in curve E (fig. 12). According to Demicco et al. (this volume, figs. 3-6), the lower and upper thirds of the Waterfowl Formation contain transgressive systems tracts corresponding to rising sea level, and the middle third contains the highstand systems tract corresponding to a relative sea-level fall. Similarly, in our curve E the rising segments of the accommodation cycles occur in the upper and lower thirds of the formation, and the falling segment occurs in the middle (fig. 12). Both of the rising segments in our curve correspond to strata that contain burrowed subtidal calcisiltites, thrombolites, and muddy subtidal limestones (fig. 13). It is the abundance of fine-grained material in these cycles that requires the larger amount of accommodation indicated by the rising segments of the curve. Demicco et al. (this volume) describe similar muddy deposits in the outer-shelf tidal flat facies that they interpreted as characteristic of the transgressive systems tract. The strata in the middle of the formation corresponding to the falling segment in our curve contain a large percentage of laminites and grainstones (fig. 13), and most of the parted limestones that are present contain a relatively small amount of mud. It is this reduction of the amount of mud, the general increase in grain size, and the increase in laminites (which compact by only a small amount) within the middle third of the Waterfowl Formation that results in the smaller amount of accommodation indicated by the falling segment of curve E. Demicco et al. describe similar deposits in the middle portion of the Waterfowl Formation in the inner-shelf tidal flat facies, which they interpret as part of the highstand systems tract. Because deeper-water subtidal deposits are most common in the strata corresponding to the two rising segments of the Waterfowl cycles in curve E, these cycles may correspond to the example in fig. 1A, in which water depth increases as the rate of accommodation increases because of a slow sediment accumulation rate.
Figure 13--Comparison of curve E from fig. 12 with our stratigraphic log of the upper part of the Arctomys Formation and the Waterfowl Formation. Also shown are our estimated amounts of fine-grained material (which includes micrite and siliciclastic mud) and coarse-grained material (which includes siliciclastic sandstone, calcarenites, and flat-pebble conglomerate). The estimated amounts of siliciclastic and calcareous siltstone are not shown. The increase in accommodation in the upper part of the Waterfowl Formation is caused by the increase in not only mud but also calcisiltite content, which is indicated by the abundance of burrowed calcisiltite facies in the upper third of the formation. Note that algalaminites and thrombolites, even though fine grained, are not decompacted. See text for discussion.
Thus the difference between our interpretation and Demicco et al.'s interpretation of the Arctomys-Waterfowl accommodation or sea-level history is only partly due to the problem of correctly identifying the effect of sedimentation rate on vertical facies patterns. It also reflects the importance of relating an observed cyclicity to the appropriate reference frame, particularly when there are multiple orders of accommodation cycles with durations ranging from several thousands of years to tens of millions of years. We suggest that the form of the Waterfowl cycles that Demicco et al. modeled is correct only in relation to the next lower-order accommodation cycle (fig. 12, curve C), which is on the scale of the Arctomys and Waterfowl Formations. Observing modulation of the Waterfowl cycles by longer-term cycles, such as those we infer from curves B and C in fig. 12, requires longer stratigraphic sections than they measured together with criteria that identify the accommodation change rather than the water depth change. Although accommodation changes can be inferred from vertical changes in the nature and thicknesses of meter-scale shoaling-upward cycles, as Demicco et al. suggest for the Waterfowl Formation [see also Goldhammer et al. (1990)], those accommodation changes may tend to record primarily the next lower order of cyclicity; that is, the cycles in curve E (figs. 12 and 13). In a long stratigraphic section the identification of longer-term accommodation cycles may require other criteria in addition to the thickness and nature of shoaling-upward meter-scale cycles.
Aitken (1966, 1978) regarded the Cambrian grand cycles in the southern Canadian Rockies as evidence of a recurring pattern of change in water depth, where an increase in water depth occurred during deposition of the lower, shaly parts of a cycle and a decrease in water depth occurred during deposition of the upper, carbonate parts of a cycle. Because these changes seem to correlate over a large area, Aitken suggested that they may be a record of eustasy (Aitken, 1978, 1981). The evidence from the form of our R2 curves in the southern Canadian Rockies, Utah, and the Appalachians (Bond et al., 1989) and our new evidence from Fischer plots for one of the apparent correlatives of a grand cycle in Utah support Aitken's argument that the grand cycles are the product of eustatic changes in sea level.
Aitken (1966, 1978) regarded the Arctomys Formation as aberrant in his scheme of cyclic water depth changes because, although the Arctomys Formation constitutes the lower shaly half of one of the grand cycles, it indicates shoaling relative to the overlying and underlying carbonate deposits in the Pika and Waterfowl Formations, which make up the upper halves of two grand cycles. Building on Aitken's interpretation of the unusual nature of the Arctomys Formation relative to its position in a grand cycle, Demicco and Spencer (1990) called into question the eustatic origin of the grand cycles.
If we have correctly sorted out the relation between accommodation, sediment accumulation, and water depth, however, the accommodation history of the Arctomys and Waterfowl Formations is consistent with the eustatic model of the grand cycles. To correctly identify the eustatic signal, one must emphasize accommodation change rather than water depth change; this avoids the difficulty that Aitken encountered with the Arctomys Formation. The higher-order accommodation cycles within the Waterfowl Formation, which correspond to those identified by Demicco et al. (this volume), may be eustatic in origin as well; whether that is the case will depend on whether they are locally or regionally developed. What order of cyclicity should be assigned to the Arctomys-Waterfowl cycle (second, third, etc.) is less important than the evidence that the Arctomys-Waterfowl cycle is only one of several similar-order accommodation cycles in the Middle and Upper Cambrian strata of the southern Canadian Rockies. The crucial question with respect to the eustatic origin of these cycles is whether their accommodation history, not their water depth history, is equivalent in both order and time to accommodation events elsewhere in North America and on other continents. Because R2 analysis provides a basis for comparing the accommodation cyclicity in different sections relative to the same frame of reference and over a long stratigraphic interval, the method is a viable procedure for addressing that question.
We acknowledge reviews of the manuscript by Mike Steckler and Walter Pitman. Part of the fieldwork for the project was supported by the National Science Foundation under grants EAR85-18644 and EAR88-17403. We also thank Environment Canada Parks Service for permission to collect rock samples in Banff, Jasper, Yoho, and Kootenay national parks. This paper is Lamont-Doherty Geological Observatory Contribution 4778.
Aitken, J. D., 1966, Middle Cambrian to Middle Ordovician cyclic sedimentation, southern Canadian Rocky Mountains of Alberta: Canadian Petroleum Geology Bulletin, v. 14, p. 405-441
Aitken, J. D., 1968, Cambrian sections in the easternmost southern Rocky Mountains and the adjacent subsurface, Alberta: Geological Survey of Canada, Paper 66-23, 96 p.
Aitken, J. D., 1978, Revised models for depositional grand cycles, Cambrian of the southern Rocky Mountains, Canada: Canadian Petroleum Geology Bulletin, v. 26, p. 515-542
Aitken, J. D., 1981, Generalizations about grand cycles; in, Short Papers for the Second International Symposium on the Cambrian System, M. E. Taylor, ed.: U.S. Geological Survey, Open-File Report 81-743, p. 8-14
Aitken, J. D., and Greggs, R. G., 1967, Upper Cambrian formations, southern Rocky Mountains of Alberta, an interim report: Geological Survey of Canada, Paper 66- 49, 91 p.
Berger, A., 1977, Support for the astronomical theory of climatic change: Nature, v. 269, p. 44-45
Bond, G. C., and Kominz, M. A., 1984, Construction of tectonic subsidence curves for the early Paleozoic miogeocline, southern Canadian Rocky Mountains--implications for subsidence mechanisms, age of breakup, and crustal thinning: Geological Society of America, Bulletin, v. 95, p. 155-173
Bond, G. C., Kominz, M. A., and Grotzinger, J. P., 1988, Cambro-Ordovician eustasy--evidence from geophysical modeling of subsidence in Cordilleran and Appalachian passive margins; in, New Perspectives in Basin Analysis, C. Paola and K. Kleinsephn, eds.: Springer-Verlag, New York, p. 129-161
Bond, G. C., Kominz, M. A., and Grotzinger, J. P., 1989, Role of thermal subsidence, flexure, and eustasy in the evolution of early Paleozoic passive margin carbonate platforms; in, Controls on Evolution of Carbonate Platform and Basin Development, P. Crevello, J. Wilson, R. Sarg, and F. Read, eds.: Society of Economic Paleontologists and Mineralogists, Special Publication 44, p. 39-61
Brady, M. J., and Koepnick, R. B., 1979, A Middle Cambrian platform-to-basin transition, House Range, west of central Utah: Brigham Young University Geology Studies, v. 26, p. 1-7
Cant, D. J., 1988, Regional structure and development of the Peace River arch, Alberta--a Paleozoic failed-rift system?: Canadian Petroleum Geology Bulletin, v. 36, p. 284-295
Cloyd, K. C., Demicco, R. V., and Spencer, R. J., 1990, Tidal channel, levee, and crevasse-splay deposits from a Cambrian tidal channel system--a new mechanism to produce shallowing-upward sequences: Journal of Sedimentary Petrology, v. 60, p. 73-83
Demicco, R. V., and Spencer, R. J., 1990, Depositional environments of the Cambrian Arctomys Formation, Alberta Rockies--implications for third-order sea-level history: Geological Society of America, Abstracts with Programs, v. 22, p. A282
Devlin, W. J., Rudolph, K. W., Shaw, C. A., and Ehman, K. D., 1991, Effect of tectonic and eustatic cycles on accommodation and sequence stratigraphic framework in the Upper Cretaceous foreland basin of southwestern Wyoming: International Association of Sedimentologists and Blackwell Scientific, Special Publication on Sequence Stratigraphy (in press)
Fischer, A. G., 1964, The Lofer cyclothems of the Alpine Triassic; in, Symposium on Cyclic Sedimentation, D. F. Merriam, ed.: Kansas Geological Survey, Bulletin 169, p. 107-149 [available online]
Fritz, W. F., 1981, Cambrian biostratigraphy, southern Canadian Rocky Mountains, Alberta and British Columbia; in, Second International Symposium on the Cambrian System---Guidebook for Field Trip 2, M. E. Taylor, ed.: U.S. Geological Survey, p. 29-33
Fryxell, J. C., and Smith, D. L., 1986, Paleotectonic implications of arkose beds in Park Shale (Middle Cambrian), Bridger Range, south-central Montana; in, Paleotectonics and Sedimentation in the Rocky Mountain Region, United States, J. A. Peterson, ed.: American Association of Petroleum Geologists, Memoir 41, p. 159-172
Goldhammer, R. K., Dunn, P. A., and Hardie, L. A., 1987, High-frequency glacio-eustatic sea-level oscillations with Milankovitch characteristics recorded in Middle Triassic platform carbonates in northern Italy: American Journal of Science, v. 287, p. 853892
Goldhammer, R. K., Dunn, P. A., and Hardie, L. A., 1990, Depositional cycles, composite sea-level changes, cycle stacking patterns, and the hierarchy of stratigraphic forcing--examples from Alpine Triassic platform carbonates: Geological Society of America, Bulletin, v. 102, p. 535562
Hintze, L. F., 1974, Preliminary geologic map of the Wah Wah Summit quadrangle, Millard and Beaver counties, Utah: U.S. Geological Survey, Miscellaneous Field Studies, Map MF-637, scale 1:48,000
Hintze, L. F., and Palmer, A. R., 1976, Upper Cambrian Orr Formation-its subdivisions and correlatives in western Utah: U.S. Geological Survey, Bulletin 1405-G, p. G24-G25 [available online]
Hintze, L. F., and Robison, R. A., 1975, Middle Cambrian stratigraphy of the House, Wah Wah, and adjacent ranges in western Utah: Geological Society of America, Bulletin, v. 86, p. 881-891
James, N. P., 1984, Shallowing-upward sequences in carbonates; in, Facies Models, 2d ed., R. G. Walker, ed.: Geological Association of Canada, Ontario, 317 p.
Jervey, M. T., 1988, Quantitative geological modeling of siliciclastic rock sequences and their seismic expression; in, Sea-Level Changes--An Integrated Approach, C. K. Wilgus, C. A. Ross, H. Posamentier, and C. G. Kendall, eds.: Society of Economic Paleontologists and Mineralogists, Special Publication 42, p. 47-69
Kepper, J. C., 1972, Paleoenvironmental pattern in middle to lower Upper Cambrian interval in eastern Great basin: American Association of Petroleum Geologists, Bulletin, v. 56, p. 503-527
Kepper, J. C., 1976, Stratigraphic relationships and depositional facies in a portion of the Middle Cambrian of the Basin and Range province: Brigham Young University, Geology Studies, v. 23, p. 75-91
Kepper, J. C., 1981a, Ramp and platform deposition during the Middle Cambrian, eastern California and western Nevada; in, Short Papers for the Second International Symposium on the Cambrian System, M. E. Taylor, ed.: U.S. Geological Survey, Open-File Report 81-743, p. 102-105
Kepper, J. C., 1981b, Sedimentology of a Middle Cambrian outer shelf margin with evidence for syndepositional faulting, eastern California and western Nevada: Journal of Sedimentary Petrology, v. 51, p. 807-822
Mount, J. F., Hunt, D., Greene, L. R., and Dienger, J., 1991, Depositional systems, biostratigraphy, and sequence stratigraphy of Lower Cambrian grand cycles, southwestern Great basin; in, Paleozoic Paleogeography of the Western United States, II, J. D. Cooper and C. H. Stevens, eds.: Pacific Section, Society of Economic Paleontologists and Mineralogists, p. 209-226
O'Connell, S. C., Dix, G. R., and Barclay, J. E., 1990, The origin, history, and regional structural development of the Peace River arch, western Canada; in, Geology of the Peace River Arch, S. C. O'Connell and J. S. Bell, eds.: Canadian Petroleum Geology Bulletin, v. 38A, p. 4-24
Palmer, A. R., 1971, The Cambrian of the Great basin and adjacent areas, western United States; in, Cambrian of the New World, C. H. Holland, ed.: Wiley-Interscience, London, p. 1-78
Palmer, A. R., 1981, On the correlatability of grand cycle tops; in, Short Papers for the Second International Symposium on the Cambrian System, M. E. Taylor, ed.: U.S. Geological Survey, Open-File Report 81-743, p. 156-157
Parsons, B., and Sclater, J. G., 1977, An analysis of the variation of ocean floor bathymetry and heat flow with age: Journal of Geophysical Research, v. 82, p. 803-828
Porter, J. W., Price, R. A., and McCrossan, R. G., 1982, The western Canada sedimentary basin: Philosophical Transactions of the Royal Society of London, ser. A, v. 305, p. 169-192
Pugh, D. C., 1971, Subsurface Cambrian stratigraphy in southern and central Alberta: Geological Survey of Canada, Paper 70-10, 33 p.
Read, J. F., 1989, US Cambrian-Ordovician passive margin; in, Controls on Evolution of Carbonate Platform and Basin Development, P. Crevello, J. Wilson, R. Sarg, and F. Read, eds.: Society of Economic Paleontologists and Mineralogists, Special Publication 44, p. 39-61
Rees, M. N., 1986, A fault-controlled trough through a carbonate platform--the Middle Cambrian House Range embayment: Geological Society of America, Bulletin, v. 97, p. 1,054-1,069
Robison, R. A., 1964, Upper Middle Cambrian stratigraphy of western Utah: Geological Society of America, Bulletin, v. 75, p. 995-1,010
Ruppel, E. T., 1986, The Lemhi arch-a late Proterozoic and early Paleozoic landmass in central Idaho; in, Paleotectonics and Sedimentation, J. A. Peterson, ed.: American Association of Petroleum Geologists, Memoir 41, p. 119-130
Sloss, L. L., 1963, Sequences in the cratonic interior of North America: Geological Society of America, Bulletin, v. 74, p. 93-114
Vail, P. R., Mitchum, R. M., and Thompson S., III, 1977, Seismic stratigraphy and global changes of sea level, pt. 4--global cycles of relative changes of sea level; in, Seismic Stratigraphy--Applications to Hydrocarbon Exploration, C. E. Payton, ed.: American Association of Petroleum Geologists, Memoir 26, p. 83-97
Van Wagoner, J. C., Posamentier, H. W., Mitchum, R. M., Jr., Vail, P. R., Sarg, J. F., Loutit, T. S., and Hardenbol, J., 1988, An overview of the fundamentals of sequence stratigraphy and key definitions; in, Sea-Level Changes--An Integrated Approach, C. K. Wilgus, C. A. Ross, H. Posamentier, and C. G. Kendall, eds.: Society of Economic Paleontologists and Mineralogists, Special Publication 42, p. 39-46
Waters, B. B., Spencer, R. J., and Demicco, R. V., 1989, Three-dimensional architecture of shallowing-upward carbonate cycles-Middle and Upper Cambrian Waterfowl Formation, Canmore, Alberta: Canadian Petroleum Geology Bulletin, v. 37, p. 198-209
Westrop, S. R., 1989, Facies anatomy of an Upper Cambrian grand cycle-Bison Creek and Mistaya Formations, southern Alberta: Canadian Journal of Earth Science, v. 26, p. 2,292-2,304
Wheeler, R. F., 1980, Geology of the Sewing Machine Pass quadrangle, central Wah Wah Range, Beaver County, Utah: Brigham Young University, Geology Studies, v. 27, pt. 2, p. 175-191
Kansas Geological Survey
Comments to webadmin@kgs.ku.edu
Web version April 20, 2010. Original publication date 1991.
URL=http://www.kgs.ku.edu/Publications/Bulletins/233/Bond1/index.html