| Original published in D. W. Steeples, ed., 1989, Geophysics in Kansas: Kansas Geological Survey, Bulletin 226, pp. 95-116 | ||
Kansas Geological Survey
The article is also available as an Acrobat PDF file.
Salt-dissolution sinkholes have developed at many localities in Kansas during the past 25 years. Most of the sinkholes subside gradually over a period of years, although catastrophic collapse has occurred in some cases. We have performed high-resolution seismic-reflection surveys across more than a half dozen of these sinkholes. It is possible to discern considerable geologic detail at depths of 50 to 1,000 m (160-3,300 ft) within the sinkholes by seismic-reflection methods. At one site astride I-70, we obtained acoustic images of grabens within the sinkhole that showed approximately 40 to 50 m (130-160 ft) of vertical downdrop at a depth of 400 m (1,300 ft) in an area where surface displacement was less than 5 m (16 ft). At another site we detected two paleosinkholes adjacent to a presently active sink. The paleosinks are filled with alluvial material probably of Pleistocene age; one of them shows indications of two different geologic ages of active sinking. While many of the new sinkholes that have formed appear to be related to oil-field brine disposal or salt-solution mining activities, the detection of the paleosinks by seismic-reflection methods reconfirms the natural occurrence of some salt-dissolution sinkholes in Kansas prior to the encroachment of civilization.
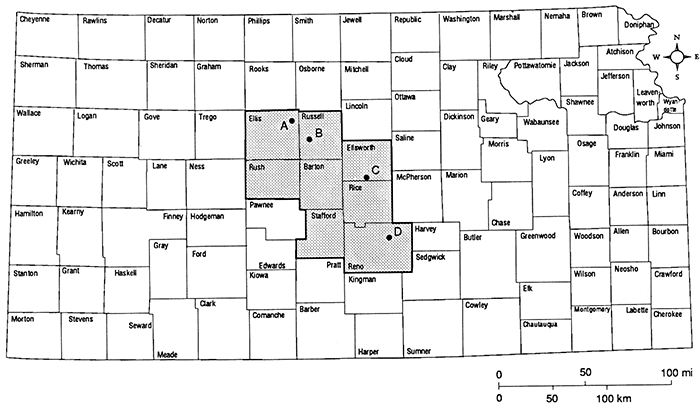
Since 1979 the Kansas Geological Survey has conducted high-resolution seismic-reflection surveys over several known salt-dissolution sinkholes in central Kansas. The sites are located in fig. 1 and are identified as the Nielsen sink (Ellis County), the I-70 sinks (Russell County), the Janssen sink (Ellsworth County), and the Punkin Center sink (Reno County). Because each site has unique features, they will be discussed separately.
Figure 1--Map of Kansas showing locations of the A) Nielsen sink (Ellis County), B) I-70 sinks (Russell County), C) Janssen sink (Ellsworth County), and D) Punkin Center sink (Reno County).
Sinkholes resulting from salt dissolution are quite common in central and southern Kansas. While they were known to have formed prior to the onset of modern oil, gas, and mineral exploration (Smith, 1940), it is clear that the activities of man have increased their number and possibly accelerated their development. Walters (1977) gives an excellent discussion of geological investigations of these sinkholes. In general, the area in question is underlain by the Hutchinson Salt Member of the Permian Wellington Formation, which is 20-90 m (65-300 ft) thick and at depths varying from 150 to 500 m (500-1,600 ft). Although we find evidence of natural sinkhole formation in Reno County, the formation of most of the sinkholes we investigated is consistent with the dissolution of the Hutchinson salt by undersaturated brines introduced into leaky disposal wells or by fresh to brackish water leaking downward along the outside of the well casings. Evidence for this is that the sinks are centered on a well, and, in many cases, the casing is known to have corroded away. Development of the sink is related to either corrosion of the well casing or insufficient cement sealing to the salt beds.
The Stone Corral Formation (Permian) is probably the strongest seismic reflector in Kansas. It is used as a seismic marker horizon throughout its area of existence in Kansas because it is easily identifiable and can be traced laterally for great distances. The Stone Corral is thin, only 2-4 m (7-13 ft) thick, and has a diverse lithology that is principally anhydrite beneath Ellis and Russell counties, and dolomite beneath Ellsworth and Rice counties (Merriam, 1963). It is seen on data from all the sites presented here except for Reno County where it subcrops beneath alluvium west of the Punkin Center sink. The Stone Corral is 100-140 m (330-460 ft) shallower than the Hutchinson salt and, where present, is most clearly affected by the observed subsidences.
All the common depth point (CDP) seismic-reflection profiles discussed in this paper were gathered using the MiniSOSIE method (Barbier et al., 1976). The older data (Ellis and Russell counties) were gathered with 12-channel equipment and are 6-fold. Newer data (Reno and Ellsworth counties) are 24-channel and 12-fold. The MiniSOSIE method is a unique high-resolution technique for gathering seismic data that uses earth compactors as seismic sources. Typically, 1,000 to 2,000 impacts are summed per shotpoint, and seismic sections with a dominant frequency of 80 to 100 Hz are produced. Experience has shown MiniSOSIE surveys provide good high-resolution results at depths between 50 and 1,000 m (150-3,300 ft) in most localities. It is an especially good technique in areas of high ambient random noise (such as automobile traffic) because random noise tends to cancel during the one or two minutes required to stack coherent signal from 1,000 or more impacts. Data along I-70 were gathered with normal traffic in progress.
This paper is a compilation of several other works: Knapp and Steeples (1981), Steeples and Knapp (1982), Steeples et al. (1983), Steeples et al. (1984), Miller and Steeples (1984), Miller et al. (1985), and Steeples et al. (1986).
Since the late 1950's, progressive development of at least three sinkholes has occurred beneath I-70 in Russell County. The sinkholes are centered on the sites of abandoned oil wells associated with the Gorham oil field and are in an area where shallow saltwater-disposal wells were permitted (Walters, 1977). The rate of subsidence has been on the order of 1/2 to 1 ft (1/5-1/3 m) per year. The gradual sinking was monitored and the highway has been periodically rebuilt to grade. Concern for public safety mounted when, in 1978, the Nielsen sink developed catastrophically about 25 km (15 mi) to the northwest in Ellis County.
When the Nielsen sinkhole was discovered by a local rancher, it was about 24 m (80 ft) across and measured 36 m (120 ft) deep. The sink hole was centered on a saltwater-disposal well that had been drilled in the early 1960's, and the surface casing and its cement annulus could be seen clinging to one wall of the sinkhole. To mitigate public concern, the Kansas Geological Survey performed seismic-reflection surveys at both sites.
Figure 2--Generalized extent and thickness of Hutchinson Salt Member of the Permian Wellington Formation. Location of cross section is shown for fig. 3. The Nielson sinkhole is located at A. The I-70 sinkholes are located at B. The Punkin Center sinkhole is near D, and the Janssen sinkhole is near C; modified from Walters (1977).
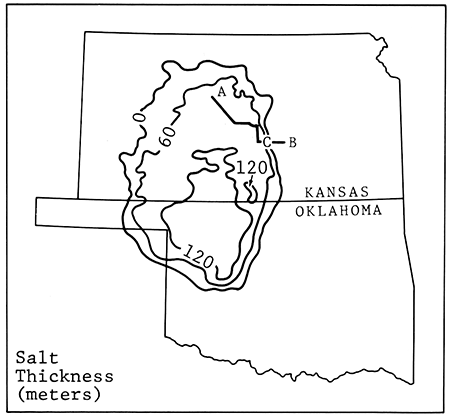
Figure 3--Cross section of fig. 2. Rock-unit names below the figure correspond to the labels on the figure. Location of wells drilled for oil, gas, and water are depicted by numbers along the top of the cross section; modified from Walters (1977), where the well locations are listed and discussed.

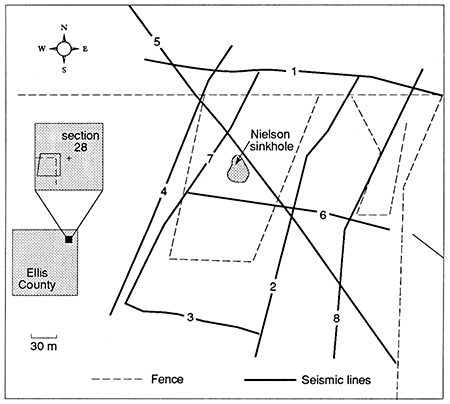
Seismic-reflection profiles run at Nielsen sink are shown in fig. 4. The original intent was to run a profile all the way around the sink outside the fence and to run three intersecting profiles inside the fence. It was thought that the profiles outside the perimeter of the fence would establish the presence or absence of natural faulting in the area. The profiles inside the fence would be used to detail the fine structures within the sink area to depths of 500-600 m (1,600-2,000 ft). Examination of records in the field indicated that the north-south profile outside the fence east of the sinkhole (profile 3) passed above one or more faults. To establish the presence or absence of the faults, another north-south profile (profile 8) was run across the draw east of the sinkhole. In retrospect it is clear that we have not yet run seismic profiles south and east of the sink that are unaffected by the subsurface presence of the sinkhole.
Figure 4--Profile-location map for Nielson sinkhole in Ellis County.
The geologic interpretation that has evolved at the Nielsen sink shows a very complex tangle of faults. Fig. 5 shows the locations of the faults and flexures that affect the Stone Corral. The interpretation is subject to considerable uncertainty because of poor data quality in some of the area around the sinkhole.
Figure 5--Faults and flexures. Faults are mapped where found on the profiles. Unfortunately, they neither tie together well nor have an obvious trend. Faulting is not identified on the profiles as dim-outs of reflection without associated offset. Dimmings are due to tensile fracturing of the rock and are identified as flexures. The associated directions of sag are plotted. Flexures appear to be due to salt dissolution.
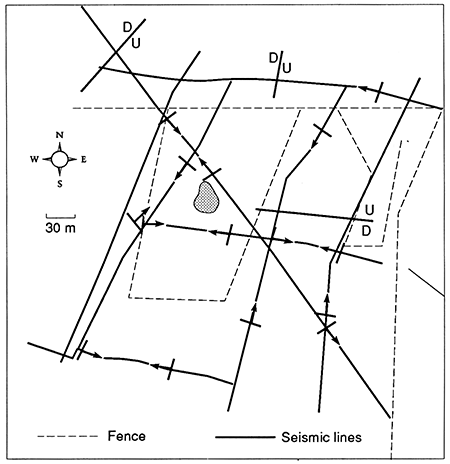
Fig. 6 shows the interpreted relative data quality along the profiles. It is interesting that data quality is poorest on the flanks of the sink rather than in the middle of the sink. The thinness of the underlying salt is depicted qualitatively in fig. 7. In general, the areas of good data quality shown by fig. 6 correspond to areas of structurally high Stone Corral and thick salt. That observation is scientifically reasonable in that disturbance from normal position of the Stone Corral also tends to degrade the reflection quality of the I-70 profiles. Poor data quality and salt thinning are both skewed to the south and east of the center of the sink. There is a suggestion that they follow the trend of the easternmost north-south-running fault of fig. 5.
Figure 6--Reflection quality of the Stone Corral. Poor quality is dark; good quality is light; average is left blank. In general, poor-quality reflections correlate with dissolution of the evaporites, or with formation of rubble zones.
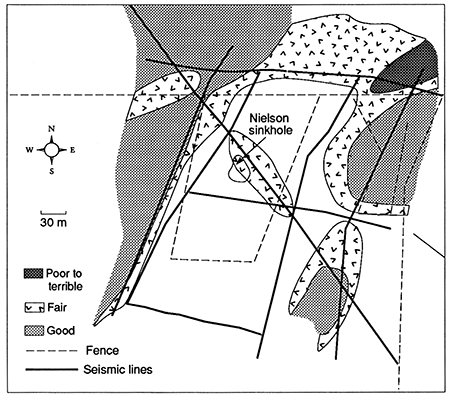
Figure 7--Salt thinning. Extent of salt dissolution (shaded area) as interpreted by identification of top and bottom of salt, and sagging of the Stone Corral. Profile 6 is ambiguous due to poor reflection quality; it is suspected that the saltis missing under most of the profile.
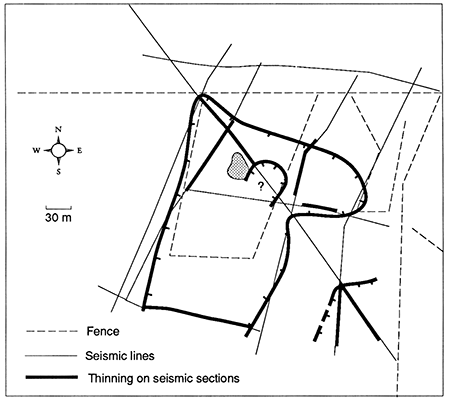
Clearly the subsurface extent of disturbance to the Stone Corral is somewhat larger than the area enclosed by the fence surrounding the sinkhole. Every profile represented in fig. 4, except profile 4, shows disturbance of the Stone Corral. There are at least three places on the eight seismic profiles that show evidence of faulting in the Stone Corral. These faults may predate subsidence. One could speculate that the disposal well was the source of the dissolvent water and that the faults provided the means of removing the brine; however, the relationship is neither clear nor known. If the faulting existed prior to collapse, it may have provided the conditions to cause dissolution, and the disposal well may or may not have aggravated the situation.
There is a definite change in the character of the Stone Corral reflection in some places. The typical Stone Corral reflection has three large peaks and two large troughs on the seismic records. At some locations (including several hundred feet along I-70 east of Witt sink), the Stone Corral reflection first peak is either subdued or missing. Disappearance of the first peak could be caused by fracturing or partial dissolution of the upper surface of the Stone Corral.
Three sinks are documented in the vicinity of the I-70 profiles (fig. 8). From west to east they are the Witt, the Crawford, and the Rouback sinks.
Figure 8--Map of I-70 sinkholes in Russell County.
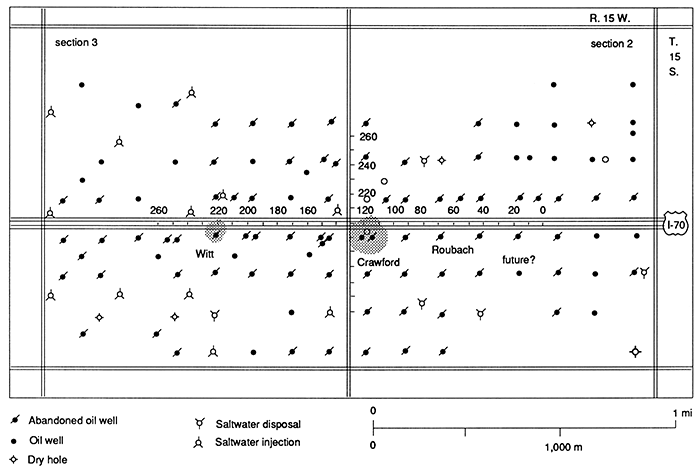
Two seismic profiles were run in the vicinity of the I-70 sinks. The first profile runs from 0.98 km (0.59 mi) east to the Crawford sink overpass to 1.05 km (0.63 mi) west of the overpass along the north road ditch of I-70. The second profile intersects the first at right angles at the Crawford sink overpass and extends from 0.48 km (0.29 mi) south of the north lane of I-70 to 0.47 km (0.28 mi) north of the north lane of I-70.
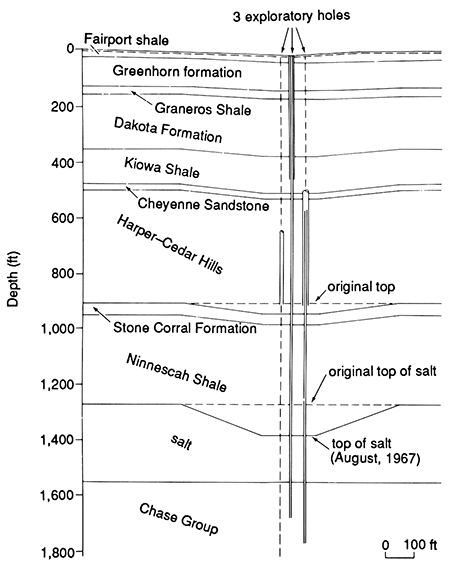
The Crawford sinkhole on I-70 was drilled and geophysically logged by the Kansas Department of Transportation in 1967, and the results are summarized in fig. 9. Note that at the time the tops of the Stone Corral and the Hutchinson salt were about 12 and 35 m (40 and 116 ft) below normal elevation, respectively. Seismic-reflection data indicate that the Stone Corral in particular has dropped almost 30 m (100 ft) since 1967. Conclusions that can be drawn from the I-70 seismic profile will be discussed from west to east.
Figure 9--Cross section of Crawford sink (I-70) from Kansas Department of Transportation, based on drilling and logging in 1967.
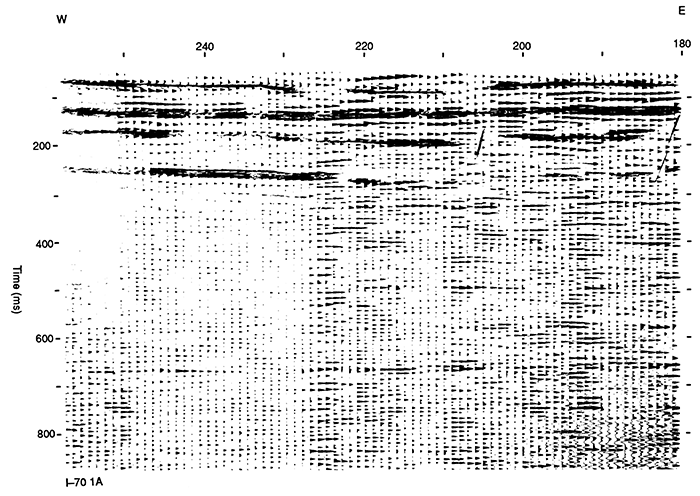
The Witt sink (fig. 10) shows on the seismic profile between CDP 206 and CDP 222 with the Stone Corral downdropped about 15 m (50 ft; 10-msec two-way travel time) along its west side (near CDP 223). The area to the west of Witt sink is interpreted to have competent rock at all depths to well below the salt. At the center of the sink (near CDP 215), the Stone Corral is either downdropped about 40 m (130 ft) or its upper surface has been broken up or partially dissolved. Stone Corral reflections exhibit incoherent or broken-up characteristics for about 400 m (1,300 ft) eastward from the center of Witt sink. The area east of Witt sink for about 400 m (1,300 ft) may subside in the future.
Figure 10--Seismic-reflection record sections for west-east profile along I-70 that crosses Witt sink. Common depth points are 8 m (26 ft) apart. Figs. 11 and 12 are labeled in identical fashion.
Between the Witt and Crawford sinks (figs. 10 and 11), a zone of competent Stone Corral begins about 300 m (990 ft) west of the Crawford sink overpass and continues eastward from CDP 166 for about 240 m (800 ft) to CDP 134 about 60 m (200 ft) west of the I-70 overpass. This 240-m (800-ft)-long zone would not be expected to subside.
Figure 11--Seismic-reflection record section for west-east profile along I-70 that traverses area between Witt sink and Crawford sink. The downdropped Stone Corral in the Crawford sink is clearly visible at times of 200 to 300 msec between CDPs 100 and 130.
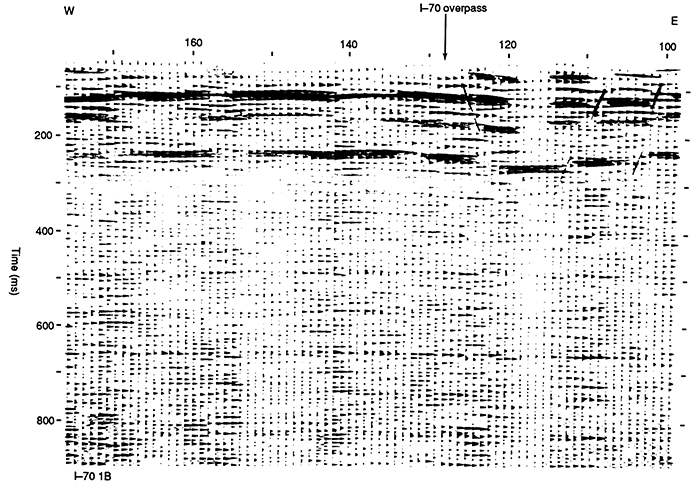
The Crawford sink (fig. 11) begins in the subsurface at CDP 131, about 60 m (200 ft) west of the overpass, and extends to near CDP 98, about 260 m (850 ft) east of the overpass--its total east-west extent along I-70 slightly exceeds 300 m (1,000 ft). The sink is marked at depth by at least five faults (four shown; one fault is just off the east edge of fig. 11) in the Stone Corral, which is down dropped in graben-like fashion into the central area of the sinkhole. The total vertical movement of the Stone Corral has been about 45 m (150 ft; 30-msec two-way travel time) at the deepest part of the sinkhole along I-70. The center of the sink is south of the highway; hence, it is not possible to evaluate conditions at the center of the sink from our traverse on the north rim of the sinkhole.
Approximately 50% of the thickness of the salt has been dissolved beneath the highway at the point of maximum drop in the Stone Corral. This compares favorably with a 40% dissolution estimate obtained by drilling done by the Highway Department in 1967 (fig. 9), suggesting that dissolution may have slowed since the mid-1960's (Walters, personal communication, 1984).
The north-south profile (not shown) supports the Crawford sink interpretation discussed above for the east-west I-70 profile. The profile runs along the road that crosses over the top of the overpass and intersects the east-west profile at CDP 128. These data are not shown in this paper, but are available from the authors and are shown in Steeples and Knapp (1982).
A competent zone of horizontal rock runs from CDP 96, about 260 m (850 ft) east of the overpass, to CDP 75, about 430 m (1,400 ft) east of the overpass. The salt appears to retain its full thickness in that area.
The Rouback sink (fig. 12) begins in the subsurface near CDP 43, about 670 m (2,200 ft) east of the overpass, and continues to near CDP 43, about 670 m (2,200 ft) east of the overpass. The eastern edge of the Rouback sink is faulted at the Stone Corral, while the west side of the Rouback is an eastward-dipping monocline. Total vertical displacement on the Stone Corral is about 30 m (100 ft; 20-msec two-way travel time).
Figure 12--SEismic- reflection record section for west-east profile along I-70 that Traverses Rouback sink and possible incipient sink.
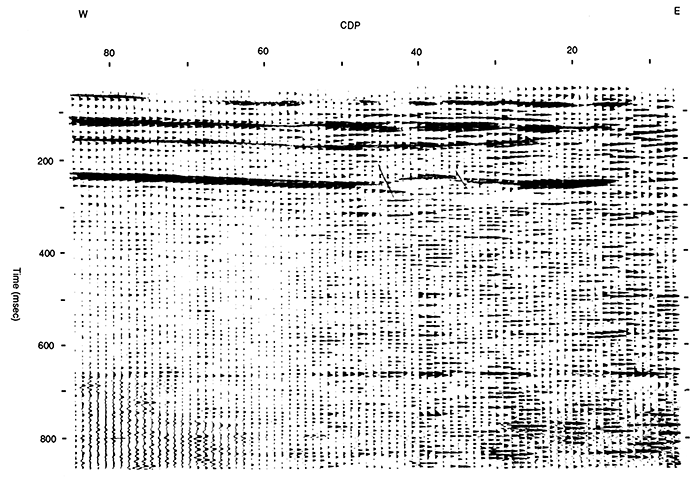
The Stone Corral is at its normal depth from near CDP 41, about 670 m (2,200 ft) east of the overpass, to near CDP 35, about 750 m (2,500 ft) east of the overpass. At 750 m (2,500 ft) east of the overpass, near CDP 35 (fig. 12), the Stone Corral appears to be downdropped to the east by about 20 m (70 ft; 14-msec two-way travel time). This indicates possible development of a new sink at the eastern edge of our seismic profile. Our data end about 1.0 km (0.6 mi) east of the I-70 overpass. It is not known what relief, if any, is present on the Stone Corral eastward beyond that point. It is suspected that subsidence will occur if it has not already occurred in an area from 760 m (2,5008 ft) east of the overpass to at least 900 m (3,000 ft) east of the overpass.
There are three areas that especially should be closely monitored by surface-elevation surveys in the immediate future:
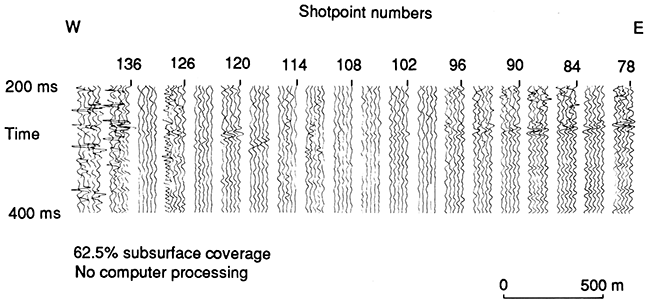
Figure 13--Dynamite seismic-reflection data from May 1979. The Stone Corral reflector is visible at a time of about 260 msec in the eastern one-third of the profile. The CDP numbers on this figure correspond to figs. 10-12; the CDP numbers can be obtained by multiplying the shotpoint numbers by 2.
The Janssen sink is located in southern Ellsworth County about 13 mi (21 km) north of Lyons on K-14, about 3 mi (5 km) west of Geneseo (fig. 14). Noticeable subsidence has been occurring about the Janssen "B" #6 well, which was a production well in the Geneseo-Edwards oil field converted to saltwater disposal. About 3 m (10 ft) of subsidence has occurred and is occurring at a rate of about .5 m (1.6 ft)/ yr.
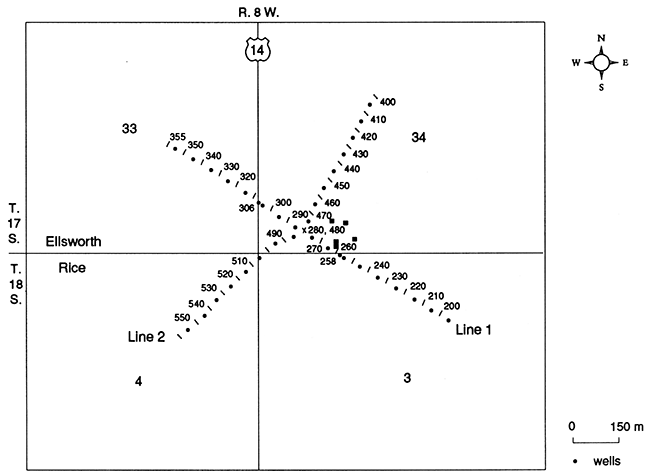
Figure 14--CDP-number location map of Janssen sink seismic lines in Ellsworth County. CDP interval is 5 m (17 ft).
Data quality of the two crossing seismic profiles allows for a satisfactory interpretation of the present position of the Hutchinson salt and some overlying strata. Both sections show similar wavelet character of about 170 msec. Below 170 msec the data quality is poor with nothing more than subtle hints of primary reflectors continuous across the sections.
Well logs from the area show the Stone Corral and the Hutchinson salt at 120 m (396 ft) and 260 m (858 ft), respectively. There is about 45 m (150 ft) of relatively uniform salt underlying approximately 140 m (460 ft) of red-bed sequences of shale, limestone, sandstone, and anhydrite. Strong acoustic boundaries exist below 350 m (1,150 ft), but due to the lack of penetration of seismic energy through the salt, recognition of the deeper rock units is nearly impossible.
Profile 1 traverses the sinkhole from southeast to northwest intersecting the county road at CDP 258 and K-14 at CDP 306 (fig. 14). The surface expression of the sinkhole extends from CDP 270 to CDP 295 on profile 1 (fig. 15). Modeling by Neely (1985) shows the Stone Corral to be the strongest reflector in the section (fig. 16). It is at about 140 msec at the flanks of the section. The top of the Hutchinson salt is at about 220 msec and its bottom at about 240 msec.
Figure 15--Seismic section of profile 1 which quite clearly shows the subsurface extent of the dissolved salt layer at about 140 msec.
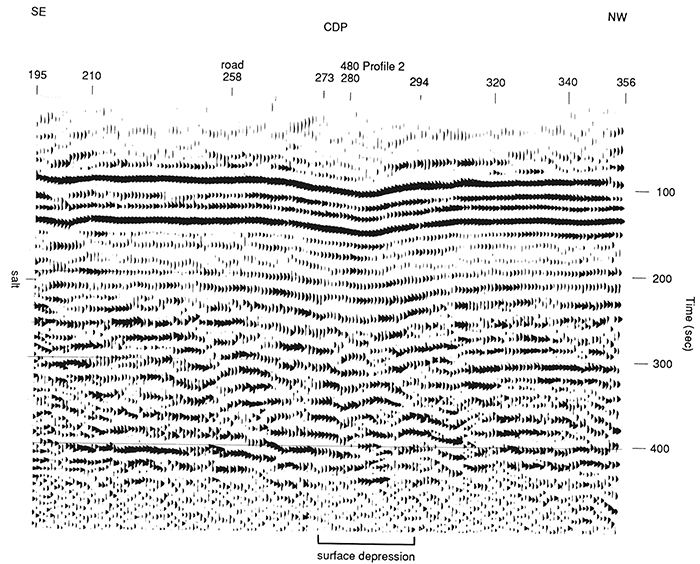
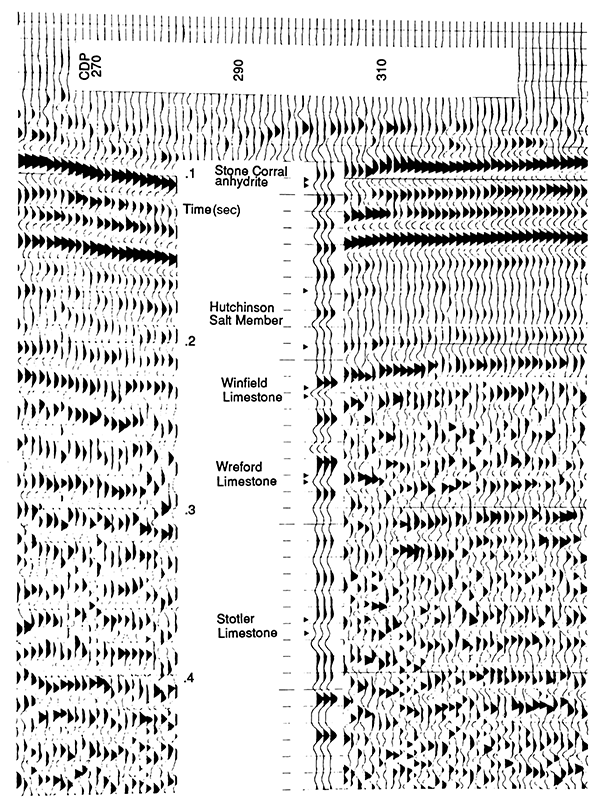
Figure 16--Comparison of seismic and synthetic data for profile 1 of the Janssen sink (Neely, 1985).
Profile 2 (fig. 17) crosses the sink from northeast to southwest and crosses the county road and K -14 intersection from CDP's 504 to 508. As in profile 1, very strong reflectors can be identified above 140 msec (Stone Corral) with poor data quality below that time. The character of the energy present on the seismic section of profile 2 is easily matched with that on profile 1. CDP 480 on profile 2 and CDP 280 on profile 1 represent the same subsurface point. Between CDP's 405 and 464 of profile 2 there seems to be a very steady gradational increase of about 6 msec in the arrival time of the wavelet identified previously as the salt in discussion of profile 1. Displacement of the salt reflector between CDP 464 and 491 appears to be about 9 msec. This would imply a total salt displacement of about 15 msec which would represent approximately 30 m (100ft) of actual subsidence in the subsurface at the depth of the salt (velocity of the salt is about 4,000 m/sec or 13,000 ft/s). This agrees quite well with profile 1.
Figure 17--Seismic section of profile 2 which ties to profile 1 at CDP 480 equating to CDP 280 of profile 1. Here as in profile 1, the subsurface extent of the disturbed salt is quite clear. Poor data on the flanks of the sink are characteristic of reflection data over sinkholes.
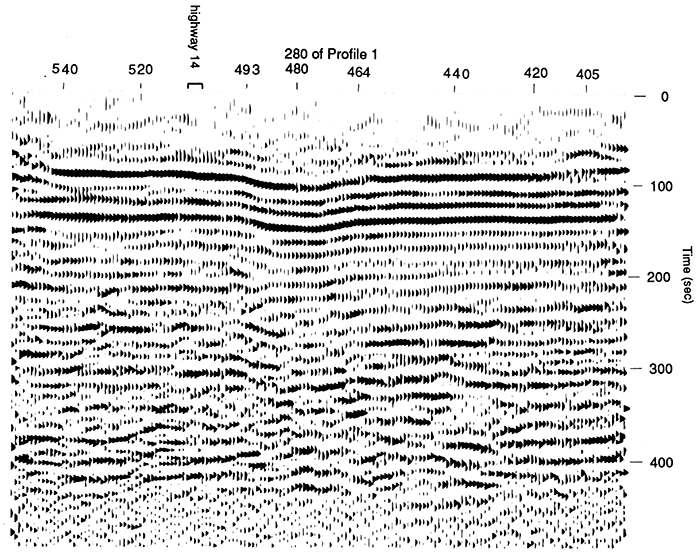
On the western boundary of the structural low formed in the salt from dissolution there exists a significant drop in reflector clarity of the disturbed area. This corresponds to CDP's 340 through 312 on profile 1 (fig. 15) and CDP's 493 and 503 on profile 2 (fig. 17). This drop in data quality is associated in both cases with apparent highs of 5-7 msec in the Stone Corral.
The isotime map (fig. 18) shows the present bed thickness of the Hutchinson salt under the surface expression at the sink. The time interval between the 20 msec and 35 msec contours represents about 30 m (100 ft) of depth change of the salt layer forming the basin-type feature.
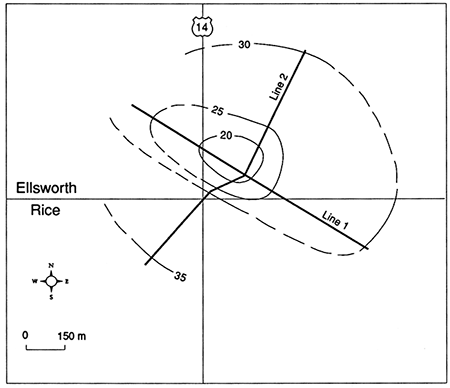
Figure 18--The contours show time thickness, or two-way travel time, of the Hutchinson Salt. The orientation of the seismic profiles with respect to the east-west county road and north-south K-14 are shown.
The present surface subsidence does not account for all the apparent subsurface dissolution of the Hutchinson salt under the Janssen sink. Comparing fig. 18 with the present surface depression, the salt shows a disturbed area more than 10 times that present at the surface. The volume and extent of the surface expression of the sink does not match the estimates of the volume of salt dissolution. This implies that some material lying between the Hutchinson salt and the surface is bridged in a way that is supporting the weight of overlying strata. Release of this stress is likely. The mechanism of the release of the stress can progress anywhere from extremely gradual to catastrophic.
From previous studies of active sinkholes in central Kansas, no evidence suggests incipient catastrophic collapse of the area directly above the disturbed salt beds. However, gravity slumping overlying strata is expected to continue until stress release is complete. The resulting depression at the surface could be as great or even slightly greater than the present subsurface dissolution limits (fig. 18). The extent of the sinking at the surface is almost certain at some time to affect K-14.
The county road east of Punkin Center in Reno County was closed due to a gradual yet persistent subsidence of an area of approximately 12 acres. It is 3.5 mi (5.6 km) west of Burrton in the Burrton oil field. Since the original construction of the county road, approximately 3 m (10 ft) of vertical displacement has occurred. At the time of our seismic-reflection profile field work, the surface depression was water filled. Most of the sinkhole is on the north side of the paved east-west road.
As can be noted at location "D" of figs. 2 and 3, the Reno County site is in a similar geologic situation as the previously described sites, except that the salt is shallower and the Stone Corral is missing. At this site the salt is between 15 m and 60 m (50-200 ft) thick at a depth of 120 m to 200 m (400-660 ft). Examination of drillers logs at nearby wells indicates a high degree of variability in the occurrence of the evaporite sequence. Since the salt-dissolution front (fig. 3) subcrops just a few kilometers to the east of the site, the variation is not surprising.
To ascertain the likely fate of the road, the Kansas Geological Survey was contracted by Reno County to do a seismic-reflection survey between August 8 and August 10, 1983. Two profiles were run intersecting at 90° on the western boundary of the surface depression (fig. 19). Profile 1 runs north-south and profile 2 runs east-west just south of the center of the sink. Surface conditions were adequate for reflection profiling except near the center of profile 2 where it crosses the sink. Over the sink, road-shoulder conditions were poor and geophone plants and source operations were hampered. This resulted in a reduction in the signal-to-noise ratio from CDP 845 to CDP 904.
Figure 19--CDP-number location map of Punkin Center sink seismic profiles in Reno County. CDP interval is 5 m (17 ft).
Intermediate layers of both profiles (figs. 20 and 21) show discrete layer offsets that could represent normal faulting. Such grabens also were observed on the I-70 data. Some evidence of faulting in the layers above the active dissolution zone is present. The layer offsets could also represent draping rather than actual faulting in the subsurface. We have not explicitly shown faults in our interpretation, but if faulting is present, it occurs where noticeable vertical offsets of layers are present within small horizontal distances. Both profiles suggest the presence of some pre-Pleistocene dissolution of the Hutchinson salt.
Figure 20--Interpreted section of profile 1.
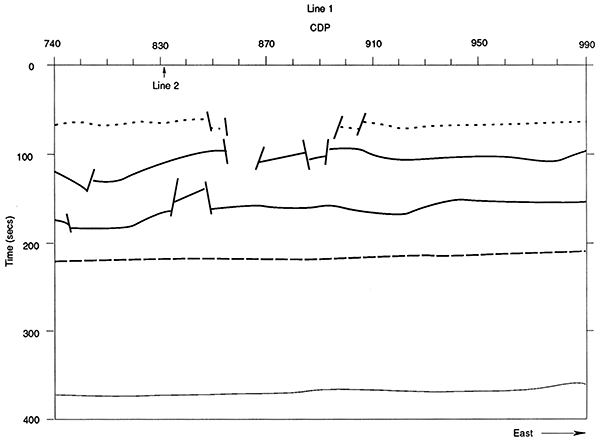
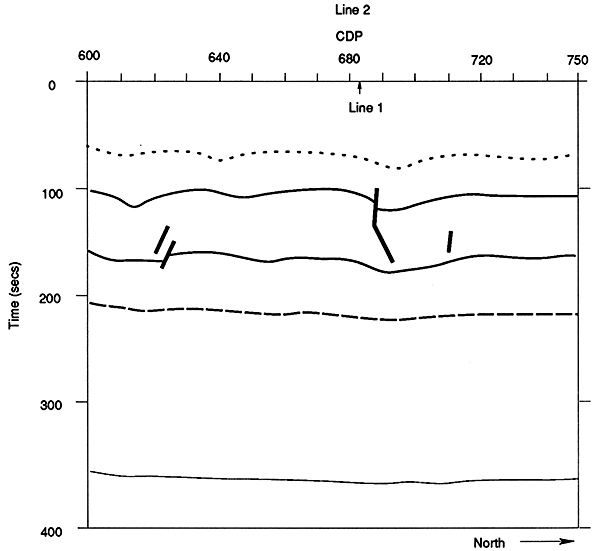
Figure 21--Interpreted section of profile 2.
Rock units below 200 msec are flat, indicating lack of structural deformation below the Hutchinson salt. Rock units above 200 msec have been structurally deformed by dissolution of the Hutchinson salt and collapse of the overburden. Perhaps the most important observation that can be made from figs. 20 and 21 is that at least two episodes of sinkhole development have occurred. The most recent episode is still continuing. The earlier episode, however, predates the deposition of the bottom of the upper geologic layer. The upper layer is of Pleistocene or older age. This shows that the hydraulic conditions necessary for dissolution of salt were present before any petroleum-exploration drilling occurred. The occurrence of a paleosinkhole and a modem active sinkhole adjacent to each other signifies that salt-dissolution sinkholes in Kansas can occur either naturally or as a result of inducement by drilling or mining.
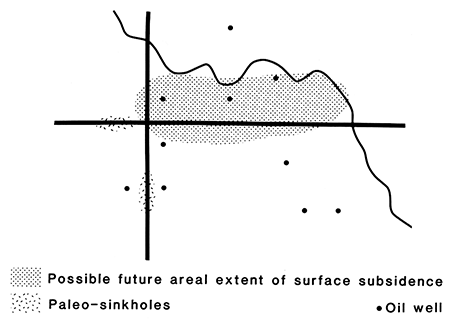
Assuming the paleosinkhole discussed above to be the result of total dissolution of the salt member, about 35 m (120 ft) of salt existed originally at the site. A crude calculation from seismic records suggests approximately 10 m (30 ft) of salt has been dissolved at the presently active sink. This means that about 25 m (80 ft) of salt could still be present. With 10 m (30 ft)of salt dissolution resulting in 3 m (10 ft) of surface slumping, 25 m (80 ft) more subsurface subsidence could result in as much as 8 m (25 ft)more surface sinking. If the rate of dissolution stays consistent, this gradual surface sinking could continue for several years. Speculation on the ultimate zone of influence of the sink is shown in fig. 22.
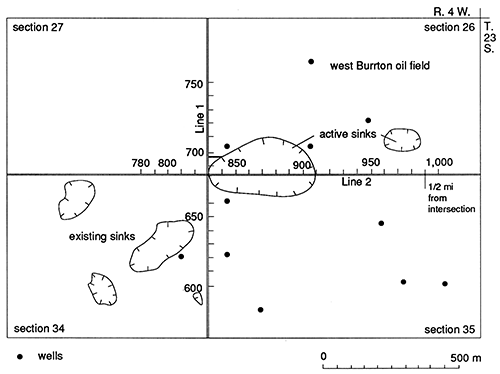
Figure 22--Map outlining the location of current sinkholes, paleo-sinkholes, and ultimate zone of subsidence suggested by seismic data.
Further subsidence is indicated in all areas by the fact that salt dissolution leads subsidence of overlying beds by a large margin in both time and space. Although the possibility of future subsidence being catastrophic in nature cannot be completely ruled out, no evidence suggests it, and it is expected that future subsidence will be a gradual phenomenon probably taking hundreds of years to stabilize. Steeples (1980) made an interesting speculation. Since the hydrologic flow at depth in the sink probably does not change much on a long-term basis, the maximum rate of increase in radius of dissolution in the salt must decrease with time; that is, since the rate of mass removal is roughly constant, the rate of the radius increase decreases as the radius gets larger. Also, as the radius gets larger and more material drops into the rubble zone, dissolution of salt will become more difficult because the path length, radially out to the salt and back to the borehole, will increase.
Using seismic-reflection methods, we have generally been able to obtain reflection data from rock units above and below the Hutchinson salt. Frequently we can see both the top and bottom of the salt. At some localities other geologic structure can be delineated. In general, geologic detail between 50 and 1,000 m (150-3,000 ft) has been seen by the seismic method. Displacement of several rock units by subsidence is noted on all lines. The Stone Corral is the most prominent of these reflectors in all areas except Reno County, where it is absent from the subsurface. In all cases, the volume of salt removed and the subsurface collapse lags the development of surface subsidence, suggesting that further subsidence is likely in all areas. Subsidence has been associated with normal faulting and the development of grabenlike structures. However, it is also associated with flexure or brecciation, in which overlying layers fracture rather than maintain large blocklike integrity.
At the Nielsen sink, subsidence is apparently associated with natural faulting, although the proximity to a saltwater disposal well is not to be overlooked. This is the only sink (of those we seismically studied) to have collapsed catastrophically, and it is reasonable to consider that the natural faults contributed to this seemingly anomalous behavior. Although catastrophic collapse occurs and is known to have occurred at other sinks, it does not seem to be the typical mode of subsidence.
At Punkin Center, apparent paleo sinks are seen seismically, reminding us that salt dissolution and collapse were occurring before the advent of the petroleum industry; however, leaky disposal wells are contributing to the acceleration and scale of the problem. Again, the proximity of subsidence to a disposal well is not mere coincidence. Unlike the other sites, Punkin Center is located very near the salt dissolution front of the Hutchinson Salt, so natural dissolution and subsidence is going to be more likely here than in areas where the salt is deeper.
The seismic method is a successful means of evaluating the nature and extent of salt dissolution and collapse in areas suffering subsidence. Unfortunately, the means of predicting future subsidence is less clear-cut other than to compare a potential problem area against a previously studied area. Time and additional data will contribute toward improvements in prediction.
Funding and assistance for these projects came from various sources. The Nielsen and I-70 sink studies were funded by the Kansas Department of Health and Environment. Logistic support and I-70 drill data were provided by the Kansas Department of Transportation. Processing of the data was facilitated by Jon Weigand, who donated seismic-processing computer facilities and time for the purpose.
The Reno County Commission funded the studies in Reno County, and Conoco, Inc. funded the Ellsworth County study. Processing of these profiles was done at the Kansas Geological Survey utilizing seismic data-processing software donated to the University of Kansas Geophysics Program by Mr. Clyde Lee and Sytech, Inc. of Houston.
Robert Walters has been a constant source of information and encouragement in our work. His interest and help are greatly appreciated.
Barbier, M. G., Bondon, P., Mellinger, R., and Viallix, J. R., 1976, MiniSOSIE for land seismology: Geophysical Prospecting. v. 24, p. 518-527.
Knapp, R. W., and Steeples, D. W., 1981, Investigation of salt dissolution collapse using high-resolution MiniSOSIE reflection seismology: EOS, Transactions of the American Geophysical Union, v. 62, p. 954-955.
Merriam, D. F., 1963, The geologic history of Kansas: Kansas Geological Survey, Bulletin 162, 317 p. [available online]
Miller, R. D., and Steeples, D. W., 1984, High-resolution reflection profile at an active salt dissolution sinkhole near Hutchinson, Kansas; 79th annual meeting, Seismological Society of America (abs.): Earthquake Notes, v. 55, p. 11.
Miller, R. D., Steeples, D. W. and Treadway, J. A., 1985, Seismic reflection survey at a sinkhole in Ellsworth County, Kansas: Society of Exploration Geophysicists, 55th annual meeting, Washington, D.C, p. 154-156.
Neely, G. W., 1985, Water's method synthetic seismograms applied to seismic reflection modeling: M.S. thesis, University of Kansas, 82 p.
Smith, H. T. U., 1940, Geological studies in southwestern Kansas: Kansas Geological Survey, Bulletin 34, 212 p. [available online]
Steeples, D. W., 1980, Seismic reflection investigations of sinkholes in Russell and Ellis counties, Kansas: Progress report to the Kansas Department of Health and Environment and the Kansas Department of Transportation, April 3, 14 p., 9 figs.
Steeples, D. W., and Knapp, R. W., 1982, Seismic investigations of sinkholes in Russell and Ellis counties, Kansas: Final report to Kansas Department of Health and Environment, 13 p., 15 pl.
Steeples, D. W., Knapp, R. W., and McElwee, C. D., 1983, Seismic reflection surveys of a catastrophically collapsed sinkhole, Ellis County, Kansas: Society of Exploration Geophysicists, 53rd annual meeting, Las Vegas, Nevada, p. 296-298.
Steeples, D. W., Knapp, R. W., and McElwee, C. D., 1986, Seismic reflection investigations of sinkholes beneath interstate highway 70 in Kansas: Geophysics, v. 51, p. 295-301.
Steeples, D. W., Knapp, R. W., and Miller, R. D., 1984, Examination of sinkholes by seismic reflection; in, Sinkholes--Their Geology, Engineering, and Environmental Impact, B. F. Beck, ed.: Proceedings of First Multidisciplinary Conference on Sinkholes, Orlando, Florida, 15-17 October, p. 217-223.
Walters, R. F., 1977, Land subsidence in central Kansas related to salt dissolution: Kansas Geological Survey, Bulletin 214, 82 p. [available online]
Kansas Geological Survey
Comments to webadmin@kgs.ku.edu
Web version Sept. 17, 2013. Original publication date 1989.
URL=http://www.kgs.ku.edu/Publications/Bulletins/226/Knapp/index.html