Kansas Geological Survey, Bulletin 194, pt. 1, originally published in 1969
Originally published in 1969 as part of "Short Papers on Research in 1968," Kansas Geological Survey Bulletin 194, part 1, p. 21-24. This is, in general, the original text as published. The information has not been updated.
An earthy variety of vivianite is found in Cretaceous marine sediments (Graneros Shale) in central Kansas. It occurs as nodular aggregates and encrustations along the surfaces of bedding planes and joints. Vivianite within 2 feet of the outcrop surface is blue, and that beyond 2 feet is white. Associated minerals are jarosite and gypsum. To the authors' knowledge, this is the first reported occurrence of vivianite in Kansas.
Vivianite changes color rapidly from white to blue after collection. Crystallites of the mineral are lath-shaped and range from 2 to 4 μ in length. Differential thermal analysis shows endothermic reactions at 190°, 360°, 470°, and 570°C, and exothermic reactions at 650° and 755°C. The infrared spectrum has wide absorption bands at 3300 and 1000 cm-1, and medium bands at 1620, 800, and 500 cm-1.
Field evidence suggests that iron sulfides and fossil remains in the sediments may contribute to the formation of the vivianite and associated minerals.
(Note: The infrared spectrum was provided by G. A. McCaskill, of the Kansas State Highway Commission Laboratory. The electron micrograph and the D.T.A. curve were taken by J. M. Huh. The atomic absorption analysis was done by O. K. Galle. E. E. Angino, J. C. Davis, and E. D. Goebel reviewed the manuscript and made helpful suggestions.)
Vivianite, Fe3(PO4)2 • 8H2O, was found by one of the authors (Dilts) along a new road cut in the marine Graneros Shale (Upper Cretaceous). The locality is 3 miles south of the town of Wilson, Ellsworth County, Kansas, and is close to one described by Hattin (1965, p. 76, Locality 8). To the authors' knowledge, this is the first reported occurrence of this mineral in the state of Kansas.
The vivianite is concentrated in a zone 9 feet thick, approximately 9 feet below the top of Graneros Shale, in an exposure that is 100 feet long in a north-south direction on both sides of the road (NW sec. 6, T. 15 S., R. 10 W.). Lateral extent of the vivianite zone is not known.
The mineral occurs as 0.5- to 2-cm nodules and encrustations along the surface of bedding planes and joints in the shale. It is blue within 2 feet normal to the surface of the outcrop, and is white beyond 2 feet. Associated minerals are jarosite, gypsum, and, rarely, iron oxides. Molds of invertebrates, impressions of fish scales(?), and plant remains are found in the shale. Montmorillonite, quartz, illite, and kaolinite are major constitutents of the shale.
Fresh vivianite is white, rapidly changing to blue after exposure to air. Because the white material is not stable under laboratory conditions, only blue material was examined. The specific gravity of vivianite was determined by a pycnometric method using distilled water. Five determinations gave a mean specific gravity of 2.56.
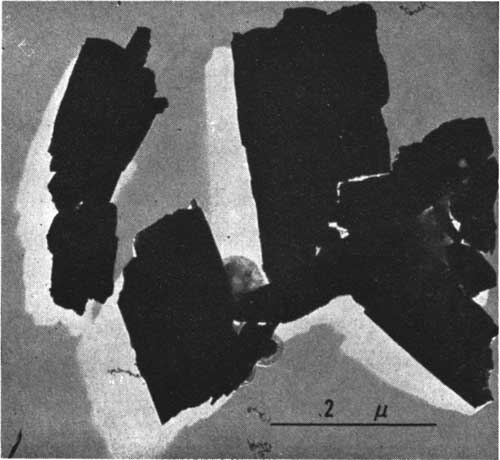
The nodules and encrustations of vivianite are aggregates of fine crystallites. The crystallites are lath-shaped and range from 2 to 4 μ in their longest dimension (Fig. 1). Under the petrographic microscope in transmitted light, crystallites are light green or colorless and exhibit blue pleochroism.
Figure 1--Electron micrograph of vivianite crystallites.
X-ray diffraction data (Table 1) were obtained at a scanning speed of 0.25° 2θ per minute and chart speed of 0.5-inch per minute. Cu-radiation was used with a diffractometer having a focusing monochromator and proportional counter. The center of the peak at half-height was used for measurement of the reflections.
Table 1--X-ray powder data for vivianite.
| Kansas sample |
ASTM* | ||
|---|---|---|---|
| dÅ | 1** | dÅ | 1** |
| 7.97 | 44 | 8.00 | 27 |
| 6.758 | 100 | 6.80 | 100 |
| 4.925 | 44 | 4.91 | 40 |
| 4.563 | 7 | 4.50 | 13 |
| 4.347 | 6 | 4.32 | 4 |
| 4.073 | 15 | 4.09 | 13 |
| 3.858 | 13 | 3.84 | 40 |
| 3.636 | 6 | 3.65 | 5 |
| 3.347 | 4 | 3.33 | 3 |
| 3.203 | 22 | 3.20 | 53 |
| 2.976 | 30 | 2.97 | 67 |
| 2.768 | 7 | ||
| 2.724 | 22 | 2.71 | 67 |
| 2.698 | 15 | ||
| 2.641 | 13 | 2.64 | 8 |
| 2.589 | 4 | ||
| 2.533 | 13 | ||
| 2.528 | 10 | 2.52 | 33 |
| 2.433 | 15 | 2.42 | 40 |
| 2.318 | 9 | 2.31 | 27 |
| 2.288 | 6 | ||
| 2.229 | 10 | 2.23 | 20 |
| 2.188 | 9 | 2.19 | 20 |
| 2.074 | 10 | 2.07 | 23 |
| 2.011 | 4 | 2.01 | 8 |
| 1.974 | 6 | 1.96 | 8 |
| 1.937 | 4 | ||
| 1.928 | 7 | 1.92 | 33 |
| 1.900 | 6 | 1.89 | 20 |
| 1.887 | 6 | ||
| 1.819 | 3 | 1.82 | 11 |
| 1.797 | 3 | ||
| 1.673 | 9 | 1.67 | 40 |
| 1.768 | 3 | ||
| 1.781 | 3 | 1.78 | 13 |
| 1.653 | 6 | ||
| 1.601 | 6 | ||
| 1.591 | 7 | 1.59 | 23 |
| 1.585 | 9 | ||
| 1.554 | 6 | 1.55 | 7 |
| 1.525 | 6 | 1.52 | 11 |
| 1.503 | 4 | ||
| 1.489 | 6 | 1.49 | 12 |
| 1.468 | 3 | 1.47 | 7 |
| 1.410 | 3 | ||
| 1.331 | 3 | ||
| 1.236 | 3 | ||
| * ASTM X-ray Powder Data File, Inorganic Sets 1-5, p. 558, 3-0070. ** Observed. |
|||
Vivianite loses weight continuously during heating to 500°C. Less weight is lost between 500°C and 650°C than at 500°C. At 675°C, weight loss reaches a maximum of nearly 24 percent (Fig. 2). At a fixed temperature of 105°C, weight loss is 15.7 percent after the sample has been in the furnace for 28 hours; beyond this time no further weight loss occurs.
Figure 2--Weight-loss curve for vivianite upon heating.
The D.T.A. curve (Fig. 3) for vivianite shows endothermic peaks at 190°, 360°, 470°, 570°, and exothermic peaks at 650° and 755°C. Differential thermal data obtained from this study disagree with that available in the literature (Manly, 1950; Pulou, 1955; Lesnyak, Yasinskaya, and Tymchishin, 1961; Anderson, Stringham, and Whelan, 1962; Rao, 1965). Manly (1950) and Kleber, Wilde, and Frenzel (1965) interpreted the first, second, and third endothermic reactions as the loss of five, two, and one waters of crystallization from vivianite. Amplitudes of the endothermic peaks are roughly proportional to water loss (Manly, 1950, p. 112).
Figure 3--D.T.A. curve for vivianite. Rate of heating 10°/min.; mixture of calcined kaolinite and alumina as reference.
Information obtained from D.T.A. and weight loss in this study does not demonstrate clearly such relationships. It is likely that loss of water continues after the first strong endothermic reaction occurs. At the same time, oxidation of ferrous iron takes place until completed at 650° to 700°C. The exothermic reaction at 755°C suggests that a phase change is taking place.
The infrared absorption spectrum (Fig. 4) for vivianite has wide bands at 3300 and 1000 cm-1, and medium bands at 1620, 800, and 550 cm-1. The spectrum was obtained with a Perkin-Elmer 521 grating spectrophotometer. A disc containing a mixture of 0.2 gm of KBr and 1 mg of powdered sample was used to obtain the spectrum. It was found that the spectrum for the vivianite from Kansas is similar to that reported by Anderson, Stringham, and Whelan (1962, p. 1307), Omori and Seki (1960, p. 401), and Omori (1961, p. 128; 1964) in the range 550 to 4000 cm-1. No reference was found in the literature for the spectrum between 300 and 550 cm-1.
Figure 4--Infrared absorption spectrum for vivianite.
A quantitative analysis for major constituents was made on the vivianite sample, and a semiquantitative spectrographic analysis was made for minor constituents (Table 2). Total iron was determined by atomic absorption (Galle, 1968).
Table 2--Chemical analysis of sample of vivianite from Kansas.
| Major constitutents |
Oxides, percent |
Oxides, recalculated to 100 percent |
Oxides, calculated for Fe3(PO4) • 8H2O |
||
|---|---|---|---|---|---|
| P2O5 | 28.37 | 29.07 | 28.31 | ||
| FeO | 40.51 | 41.51 | 42.96 | ||
| H2O- | 15.76 | }28.71 | 16.15 | }29.42 | 28.73 |
| H2O+ | 12.95 | 13.27 | |||
| 97.59 | 100.00 | 100.00 | |||
| Minor cations, percent | |
|---|---|
| Al* | 0.1 |
| Mn | 0.01 |
| Si | 0.5 |
| Na** | 0.1 |
| Ca | 0.01 |
| K | 0.1 |
| Mg | 0.1 |
| HCl insoluble residue 1.28 percent | |
| * Spectrographic. ** Flame. |
|
The chemical elements necessary for the formation of vivianite and associated minerals are available locally. Iron sulfides (pyrite and marcasite) in the shale decomposed by weathering have formed acidic solutions. These solutions have migrated along bedding planes and joints and reacted with fossil remains and clay minerals to form vivianite and associated jarosite and gypsum.
Anderson, W. R., Stringham, B., and Whelan, J. A., 1962, Secondary phosphates from Bingham, Utah: Am. Mineral., v. 47, p. 1303-1309.
Galle, O. K., 1968, Routine determination of major constituents in geologic samples by atomic absorption: Appl. Spectry., v. 22, no. 5, pt. 1, p. 404-408.
Hattin, D. E., 1965, Stratigraphy of the Graneros Shale (Upper Cretaceous) in central Kansas: Kansas Geol. Survey, Bull. 178, 83 p. [available online]
Kleber, W., Wilde, W., and Frenzel, M., 1965, The thermal decomposition and oxidation of bivalent iron in vivianite: Chem. Erde, v. 24, p. 77-93 (in German); [Chem. Abs., v. 63, 16040g, 1965].
Lesnyak, V. F., Yasinskaya, A. A., and Tymchishin, Ya. D., 1961, Vivianite from the western part of the Ukrainian S.S.R.: Vopr. Mineralog. Osad. Obrazorv. L'vovsk. Gos. Univ. 6, p. 166-180 (in Russian); [Chem. Abs., v. 58, 356f, 1963].
Manly, R. L., Jr., 1950, The differential thermal analysis of certain phosphates: Am. Mineral., v. 35, p. 108-115.
Omori, Keiichi, 1961, Infrared absorption spectra of some essential minerals: Tohoku Univ. Sci. Repts. Ser. 3, v. 7, p. 101-130.
Omori, Keiichi, 1964, Infrared studies of essential minerals from 11 to 25 microns: Tohoku Univ. Sci. Repts. Ser. 3, v. 9, p. 65-97.
Omori, Keiichi, and Seki, Toshickazu, 1960, Infrared studies of some phosphate minerals: Tohoku Univ. Sci. Repts. Ser. 3, v. 6, p. 397-403.
Pulou, R., 1955, Caractères thermiques des phosphates de la famille de la vivianite: Acad. Scl. Paris, C. R. 241, p. 221-223.
Rao, A. B., 1965, Notes on the d.t.a. study of some rare Brazilian phosphate minerals: Mineral. Mag., v. 35, p. 427-428.
Kansas Geological Survey, Short Papers on Research in 1968
Placed on web July 26, 2011; originally published in Feb. 1969.
Comments to webadmin@kgs.ku.edu
The URL for this page is http://www.kgs.ku.edu/Publications/Bulletins/194_1G/index.html