Kansas Geological Survey, Bulletin 191, Pt. 2, originally published in 1968
Originally published in 1968 as Kansas Geological Survey Bulletin 191, Pt. 2. This is, in general, the original text as published. The information has not been updated. An Acrobat PDF version (10 MB) is also available.
The two most prominent joint sets in Butler and Cowley counties and in parts of Greenwood, Chase and Marion counties, Kans., have consistent regional orientation regardless of the age of the rocks containing them. Set I strikes northeast, whereas Set II strikes northwest. The angle between the sets averages 93°. Both sets occur either as single or compound groups. Set III joints cluster around the two major sets and are subordinate in number with less consistent orientation. Most of the joints studied are vertical. On the basis of physical characteristics, joints of Sets I and II are shear joints, whereas Set III joints are tension joints. The joints are believed to have formed after the major development of the anticlinal folds in the region but may have developed simultaneously with later readjustments of the folds. The joints show no relation to subsurface faults but are closely aligned with the "en echelon" belt of faults of Oklahoma. Because most joints are vertical to the bedding, the jointing and regional tilting may be contemporaneous products of the same deformational period. The age of the joints is determined to be between post-lower Permian and pre-lower Cretaceous time. The joints may have formed as a result of north-West, horizontal, compressive forces generated by wrench-fault tectonics during initial Ouachita Mountain uplift. These forces were coupled with an opposite force, possibly from the Rocky Mountain region. Evidence shows that at least two separate but inter-related joint systems may exist in the midcontinent region.
Rocks deformed by systematic jointing have been observed in Kansas for many years. This report, the first detailed study of the joint system, describes the characteristics of the joints and shows their age relationships to stratigraphic and deformational features. A possible theory for the origin of the joints was formulated.
During the period from September 1963 to November 1964 joints occurring in outcrops in Butler and Cowley counties and in parts of Greenwood, Chase, and Marion counties, Kans., were systematically studied (Pl. 1). As described by Fenneman (1938), the eastern portion of this region lies within the Flint Hills physiographic province. This province is characterized by almost level uplands trending northeast-southwest and rising in steplike succession toward the west. The cuesta-like steps have abrupt eastward facing slopes, the base of each resting on the gentle westward slope of the succeeding "cuesta." These "cuestas" are controlled by the gentle westward tilt of the beds in conjunction with differential erosion of underlying rock formations. Although the Flint Hills are rugged topographically, the overall relief is not great. The western portion of the region is a broad flat plain. The few cuesta-like steps that exist are in most cases surface expressions of subsurface structures.
The region studied overlies and extends east of the Nemaha Anticline, the major structural element of the region (Pl. 1). Numerous small anticlines and domes exist throughout the region and are predominantly oriented in a north-south direction. The area is bordered by the Sedgwick Basin on the west, the Bourbon Arch on the northeast, and the Cherokee Basin on the east and southeast.
The rocks underlying this area range in age from Precambrian to Quaternary. Mesozoic rocks are absent and most pre-Pennsylvanian formations are missing over the crest of the Nemaha Anticline. As a result, in most localities along this structure Pennsylvanian rocks directly overlie Precambrian rocks. Data were obtained from exposures of upper Pennsylvanian age in the eastern portion of the region to lower Permian aged rocks in the west (Pl. 1). Most of the data were obtained from the Fort Riley and Florence Limestone Members of the Barneston Limestone of lower Permian age. These formations are composed primarily of limestone, cherty limestone, and shale beds. Thickness of the sedimentary rocks in the region ranges between 2,700 and 4,500 feet.
The regional dip at the surface is westward at 1° or less. Exceptions to the westward dip occur locally where subsurface structures have caused a slight surface expression by doming or where slumping has occurred.
The author wishes to express appreciation to the faculty in the Department of Geology at Wichita State University, especially Dr. J. G. Blythe, Dr. J. R. Berg, and Dr. D. J. Brennan for their pertinent advice. Special gratitude is extended to Dr. D. L. Murphy, previously Associate Professor of Geology at Wichita State University, whose suggestions were most helpful in determining the scope and content of this report.
Study was concentrated on Butler County because this area overlies the Nemaha Anticline and its related structures and because there are numerous good rock exposures. Cowley, Chase, Marion, and Greenwood counties were studied so that a regional pattern might be derived. Throughout the entire region some townships have an abundance of outcrops while others have few; this is responsible for an absence of data in certain areas. Both lower Permian and upper Pennsylvanian rocks were studied to see if a similar joint pattern exists in rocks of both ages.
At each outcrop strike and dip of the joints were obtained with a Brunton compass. Other observed data included the character and relationships of the joints, orientation of the beds, lithology of the rocks, and the location of each outcrop relative to subsurface structures.
Joints were found closely spaced and in abundance at nearly every outcrop. At a few outcrops one or two of the joint sets were so well developed or exposed in such a manner that they seemed to be dominant over other sets. Discrimination was required in taking data so that a true representation of each joint set might be given. Only regular joints with consistent orientation were measured. length of the joints was not always a factor in their selection. However, the longer joints belonging to dominant joint sets were usually in greatest abundance and, therefore, were selected with greater frequency. At outcrops containing 50 joints or less, the majority of the joints were measured; at outcrops containing more than 50 joints, a systematic study was made of one locality and checked by measuring joints in other areas of the outcrop.
Few data were taken at localities where the rocks were locally slumped or badly weathered. At a number of localities, such as in stream beds, no dip measurements could be made.
The number of joints measured at each outcrop ranged from 10 to 150. The total measured for each township ranged from 66 to 632. The outcrops per township ranged from 1 to 10. A total of 5,777 joints were measured at 85 outcrops. For statistical analysis, data from outcrops within a township were combined except when natural distribution of the outcrops favored combining outcrops from two different townships.
Joints within joint sets have approximately parallel strikes at each outcrop. Statistical methods were used to obtain a mean bearing for each joint set. The method used for representing the two-dimensional data in Plate 1 is that outlined by Parker (1942). The bearings of the joints in each unit area were tabulated into azimuth groups having a 5-degree range. The mid-points of these groups were north and every 5-degree azimuth to east and west, the groups thus ranging from N. 2 1/2° W. to N. 2 1/2° E., from N. 2 1/2° E. to N. 7 1/2° E., etc.
On Plate 1, the diagrams were constructed on polar co-ordinate paper and then transferred to the map. On the polar co-ordinate paper, distances proportional to the number of joints in each 5-degree group were laid off on each side of the center in the directions of the arithmetic mean of the group. These points, varying in distance from the center, were then connected in proper sequence by straight lines, except that where a group was not represented, the line was brought back to the center. To keep the diagrams of nearly equal size, in spite of the varying quantity of data, different scales were used, the radius of the semicircle representing 10 joints.
Plate 2 was constructed by plotting the mean strike of the major joint sets for any given outcrop. The lines in the diagrams of Plate 2 represent these bearings. The mean bearings were found by calculating the arithmetic mean of all joint bearings within these sets. At almost all the outcrops the joint strikes were prominent enough to be certain that the boundaries of each joint set were determined. Thus, joint bearings from two different joint sets have not been averaged together. The lines in Plate 2 which represent bearings have been given a length of 1 inch for each 20 joints in a given set. The number of joints within the major joint sets at each outcrop represented on Plate 2 varies from 6 to 76.
Symbols on Plates 1 and 2 identify the limestone members exposed. Thus, a comparison can be made between the joint pattern and the age of rock.
Three-dimensional data have been represented in Figure 1 on a point diagram as described by Billings (1954). If a plane is passed through the center of a sphere of reference, its trace on the surface of the sphere will be a great circle. A line erected perpendicular to this plane and through the center of the sphere will intersect the spherical surface at a point which is characteristic of the given plane. These points may be considered to be the poles of the joint planes. When the poles are plotted on an equal area projection, the center point represents horizontal joints while points on the circumference indicate vertical dips.
Figure 1--Equal area projection of joints plotted on lower hemisphere: A, 144 joints within T. 27 S., R. 4 E., and B, 212 joints within T. 30 S., Rs. 3-4 E.
As shown by Figure 1, the great majority of joint planes dip from 85° to 90°. This characteristic appears over the entire region. The least dip of any joint plane measured is 46°. Relative to dip, the joint strikes are distributed nearly equally in all the quadrants of the projection plane. Joints in the northeast and southwest quadrants strike northwest while those in the northwest and southeast quadrants strike northeast. The areas contained within T. 27 S., R. 4 E. and T. 30 S., Rs. 3-4 E. were picked for stereographic representation in Figure 1 because these areas seemed to have the most joints dipping at angles other than vertical.
Plate 1 shows that over the entire region a systematic consistent regional joint pattern is present regardless of the age of rock. Two major joint sets are noted, one set with a prevailing northeast trend, the other set with a northwest trend. Around these major sets are clustered smaller sets, apparently lacking consistent regional orientation but which may be important locally.
The major northeast-striking joint set is called Set I. This distinction results from a greater consistency of bearing; and in many cases a greater abundance of joints relative to the major northwest-striking set. The northwest-striking set is designated Set II, whereas the clusters of minor sets are treated under the broad classification of Set III. Horizontal fractures are present and are treated briefly.
As shown by Table 1, the joint-bearing data have been tabulated so that many interesting relationships occur. Set I has an average mean strike of N. 60° E. and average modal strike of N. 61° E. with an extreme range of N. 50° E. to N. 70° E. By relating these values to Plate 1, a regional trend is seen. The joint bearings have a slightly greater variance from due north in the eastern portion of the region than in the west. One exception to this trend exists in southern Chase and northern Butler counties where strike values increase from N. 51° E. to N. 66° E. in a distance of a few miles. In the area directly overlying the Beaumont Anticline included within Tps. 25-26 S., R. 10 E., Set I joints strike N. 50° E. This value is much less than the N. 60°-68° E. strike values which are common near this area.
Table 1--Tabulation of measured joint bearings.
| Location | Northeast sets (degrees) |
Northwest sets (degrees) |
Angles between mean values (degrees) |
Other sets (degrees) |
Total | ||||||
|---|---|---|---|---|---|---|---|---|---|---|---|
| I mode |
I mean |
Mean northeast components of III |
I mode |
I mean |
Mean northwest components of III |
Extreme northeast components |
Extreme northwest components |
Sets I and II |
|||
| T. 21 S., R. 5 E. | 69 | 69 | 6, 19, 85 | 25 | 25 | 8, 45, 77 | 79 | 69 | 94 | 107 | |
| T. 22 S., Rs. 5-6 E. | 60 | 60 | 1, 20 | 29 | 30 | 15, 54 | 59 | 39 | 90 | 79 | |
| Tps. 21-22 S., Rs. 6-7 E. | 66 | 66 | 15, 27, 47 | 49 | 49 | 18, 30, 65 | 51 | 47 | 115 | 0 | 109 |
| Tps. 22-23 S., R. 8 E. | 60 | 59 | 18, 25, 33 | 20 | 26 | 8, 60, 73 | 41 | 65 | 85 | 0 | 153 |
| T. 23 S., R. 4 E. | 50 | 51 | 12, 36, 88 | 23 | 24 | 11, 39, 65 | 76 | 54 | 75 | 349 | |
| Tps. 23-24 S., R. 6 E. | 70 | 66 | 10, 35 | 18 | 25 | 65, 73 | 56 | 48 | 91 | 288 | |
| T. 24 S., R. 4 E. | 50 | 51 | 10, 35, 71 | 38 | 35 | 10, 80 | 61 | 70 | 86 | 238 | |
| T. 25 S., R. 4 E. | 67 | 70 | 10, 45 | 47 | 47 | 5, 63 | 60 | 58 | 117 | 167 | |
| T. 25 S., R. 6 E. | 50 | 45 | 75 | 44 | 40 | 15, 60 | 30 | 45 | 85 | 0 | 309 |
| Tps. 25-26 S., R. 10 E. | 52 | 50 | 15, 74 | 43 | 43 | 2, 25, 74 | 59 | 72 | 93 | 182 | |
| T. 26 S., R. 4 E. | 60 | 57 | 10, 25, 75 | 30 | 35 | 10, 67, 80 | 65 | 70 | 92 | 253 | |
| T. 26 S., R. 5 E. | 60 | 60 | 10, 45, 80 | 29 | 30 | 10, 60, 85 | 70 | 75 | 90 | 193 | |
| T. 26 S., R. 7 E. | 60 | 60 | 12, 26, 70 | 35 | 35 | 10, 21, 85 | 58 | 75 | 95 | 113 | |
| T. 26 S., R. 8 E. | 57 | 56 | 28, 73 | 40 | 34 | 10, 54, 85 | 45 | 75 | 90 | 0 | 177 |
| T. 27 S., R. 3 E. | 65 | 65 | 14, 32 | 35 | 35 | 10, 70 | 51 | 60 | 100 | 0 | 572 |
| T. 27 S., R. 4 E. | 58 | 55 | 10, 25, 70 | 40 | 36 | 5, 70, 80 | 60 | 75 | 91 | 90 | 632 |
| T. 27 S., Rs. 10-11 E. | 65 | 65 | 10 | 34 | 34 | 8, 43, 74 | 55 | 66 | 99 | 0 | 206 |
| Tps. 27-28 S., R. 6 E. | 72 | 65 | 12, 34 | 25 | 26 | 10, 55, 76 | 53 | 66 | 91 | 0 | 101 |
| T. 28 S., R. 4 E. | 54 | 64 | 21, 40, 75 | 42 | 41 | 10, 20, 80 | 54 | 70 | 105 | 0 | 248 |
| T. 28 S., R. 5 E. | 58 | 59 | 2, 33, 82 | 35 | 35 | 3, 13, 80 | 80 | 77 | 94 | 66 | |
| T. 28 S., R. 9 E. | 68 | 58 | 9, 31, 84 | 44 | 45 | 5, 22, 74 | 75 | 69 | 103 | 90 | 96 |
| T. 29 S., Rs. 6-7 E. | 57 | 57 | 11 | 36 | 36 | 18 | 46 | 17 | 93 | 183 | |
| T. 30 S., Rs. 3-4 E. | 58 | 60 | 9, 40, 85 | 54 | 56 | 15, 30 | 76 | 41 | 116 | 245 | |
| Tps. 30-31 S., R. 5 E. | 69 | 65 | 25, 42 | 38 | 39 | 10, 20, 79 | 40 | 69 | 104 | 0 | 126 |
| T. 30 S., R. 7 E. | 68 | 69 | 26, 33, 42 | 28 | 30 | 48, 70 | 43 | 40 | 99 | 150 | |
| T. 32 S., Rs. 4-5 E. | 57 | 57 | 13, 73, 85 | 34 | 35 | 6, 59, 78 | 72 | 72 | 92 | 0 | 130 |
| T. 32 S., R. 6 E. | 63 | 65 | 29, 44 | 25 | 25 | 40, 61, 78 | 36 | 53 | 90 | 90 | 119 |
| T. 34 S., R. 5 E. | 62 | 61 | 16, 29, 78 | 39 | 41 | 10, 64, 75 | 62 | 65 | 102 | 186 | |
| Averages | 61 | 60 | 35 | 35 | 93 | Total | 5,777 | ||||
Set I is in places bimodal with this characteristic occurring at random throughout the region. The angle between components averages 17° although ranging from 9° to 31°.
Table 1 shows that Set I lies almost perpendicular to Set II, the angle between them averaging 93°. In only eight townships does this angle vary more than 10° from a 90° angle. The resultant obtuse angle opens in most cases toward the northeast.
Joints of Set II have an average mean strike and average modal strike of N. 35° W. with extreme values of N. 24° W. and N. 56° W. Relating these values to Plate 1, the pattern is one of regularity. Only slight variations in strike occur with no major regional swing. However, from northern Cowley to southern Butler counties an apparent shift in the strike of Set II joints does occur from east to west.
Like Set I, Set II is bimodal with this characteristic occurring at random. The angle between components averages 19° While varying from 8° to 34°.
Set III joints are found striking both northeast and northwest around Sets I and II. For the most part these joint sets lack the consistency, abundance, and dominant characteristics of Sets I and II. Throughout the region from two to six minor sets are present at a given outcrop. Although lacking consistent orientation, joint sets with average mean strikes of due north, N. 10° E., N. 30° E., N. 75°-85° E., N. 10° W., and N. 70°-85° W. are common. The lack of conformable orientation of these sets may result from certain orientations and exposures of the rock layers which make them inconspicuous. In some localities a joint set within Set III may be prominent and in greater abundance than Set I or Set II. However, no regional pattern for this type of occurrence exists.
Horizontal fractures are present throughout the region, but no consistent occurrence was observed.
Plate 1 shows that the regional joint pattern is little affected by the age of the limestone members. This is shown by the symbols representing the limestone member exposed at each outcrop studied. In townships where joints from several outcrops with different limestone formations exposed were combined, the pattern was unaffected.
By plotting the strikes of the two major joint sets for individual outcrops, greater detail may be added to the regional pattern. Plate 2 shows a few local changes of strike not seen on Plate 1. In a few instances, joint sets included within Set III are equal to or dominant over Sets I and II. This is especially evidenced in southwest Greenwood County where Set III joints striking N. 31 ° E. are more abundant than Sets I and II.
Plate 2 shows that Set I swings gradually eastward within the area bounded by Cowley County while Set II swings westward. Only one prominent exception occurs. In the northwest part of the county, Set II swings abruptly west relative to surrounding bearing values.
East of the Nemaha Anticline in Butler and Greenwood counties, the bearing of all Set I joints swings gradually from west to east through these counties. No exceptions to this trend are present. However, the bearing of Set II is nearly constant.
In the area north of T. 24 S., Set I swings abruptly to the east. However, this change in trend is only 15° in extreme values. Set II in the same area shows no change of strike although local inconsistencies exist.
As in Plate 1, Plate 2 shows no significant changes in the joint pattern resulting from the different ages of rock in the region. This important characteristic is discussed in greater detail below.
In summary, local changes in the strikes of Sets I and II are slight and apparently unaffected by local structures in this area. Set II appears to be less consistent in trend than Set I. Set III, being composed of more localized joint sets, shows great variance in strike throughout the region.
The joints of Set I strike northeast, whereas those of Set II strike northwest in either single or bimodal groups. Throughout the region their bearings vary little more than 10° from the mean. In many localities the joints of one bed of limestone belong to one component of the bimodal sets, while joints in an adjacent layer belong to the other component (Fig. 2). With few exceptions, Set I is present at most outcrops in equal or greater abundance than Set II. However, Set II does occur with greater regularity at a few places. Joints composing Sets I and II include as many as 75 percent of the total joints for a given township.
Figure 2--Three limestone layers containing different components of bimodal groups. Note lack of well-defined joints in intervening shales; Fort Riley Limestone; NE SE SE sec. 16, T. 28 S., R. 6 E.
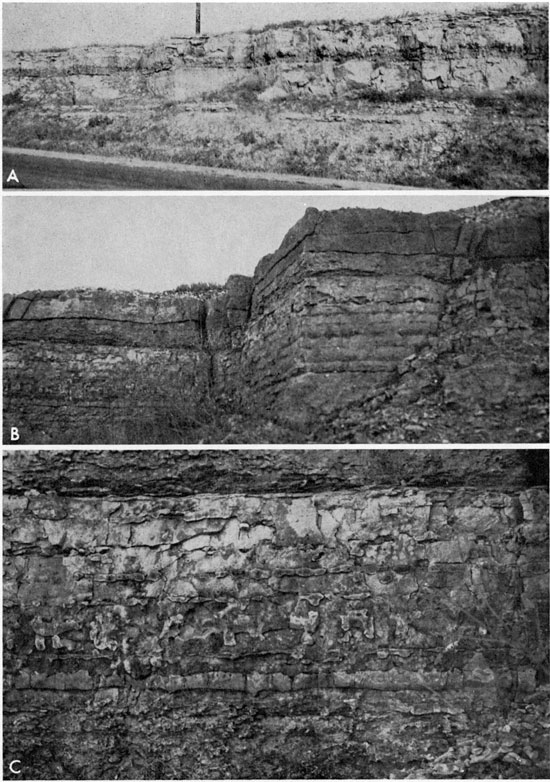
The joint surfaces and traces are extremely smooth and straight in competent limestone (Fig. 3A). Seldom does a single joint bend; but when this feature occurs, it is near the intersection of one member of a bimodal set with the other (Fig. 3B). On the other hand, joints of Sets I and II may become irregular in shaly, less competent limestones (Fig. 3C). The majority of joint surfaces are nearly vertical to the bedding although a few have dips as small as 56°. Figure 4 shows joint traces dipping between 65° and 70°. The dips and strikes of these joints are among those represented in Figure 1A.
Figure 3--A, Smooth, straight joint traces in competent limestone with typical spacings of Sets I and II. Compass points N. 55° E.; Winfield Limestone; SW sec. 20, T. 32 S., R. 4 E. B, Set I joint bending as it nears intersection point with another member of bimodal group. Compass points N. 60° E.; Towanda Limestone; SW SE SW sec. 32, T. 25 S., R. 4 E. C, Irregular Set II joint trending N. 30° W. In shaly limestone; Herington Limestone; SE SW SW sec. 17, T. 2 3 S., R. 4 E.
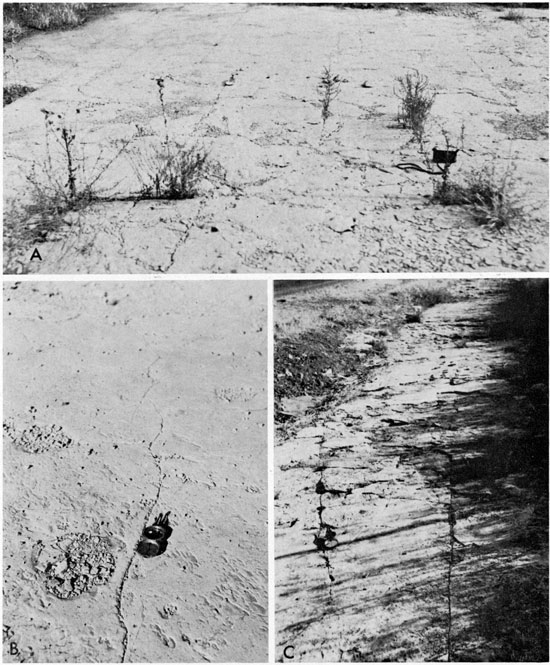
Figure 4--Joint traces of Sets I and II dipping between 65° and 70°; Herington Limestone; E2 NE NE sec. 30, T. 24 S., R. 4 E.
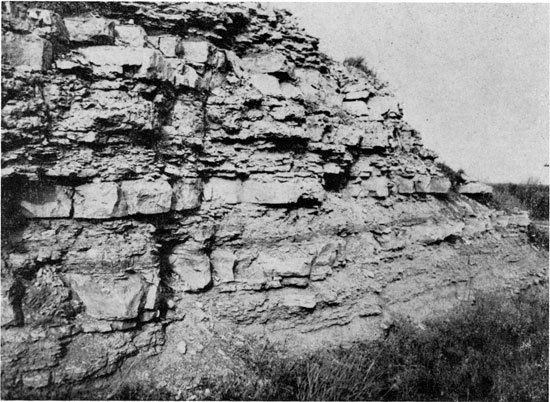
The lengths of the joints vary from a few feet to 100 feet. The latter value may not be representative since this was the maximum length found exposed. With greater exposure of given outcrops the measurable length of these joints probably would be greater. Seldom do the joints of Sets I and II terminate against each other. The joints are spaced from 1 foot to as much as 25 feet apart. A common distance is 5 to 10 feet. Figures 3A, 5, and 6 show typical lengths and spacings of the joints studied. joints of Sets I and II may be confined to individual beds; however, more often they transect all beds exposed at an outcrop (Fig. 7A).
Figure 5--Typical lengths and spacings of joints in thick-bedded limestone. Note resultant blocky structure; Fort Riley Limestone; W2 SW sec. 2 8, T. 3 4 S., R. 5 E.
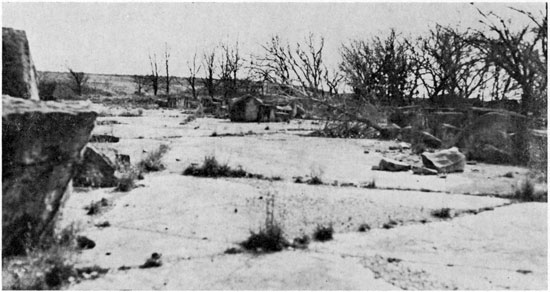
Figure 6--Typical lengths and spacings of Set II joints in medium-bedded limestone; Fort Riley Limestone; SW SW NE sec. 19, T. 2 5 S., R. 6 E.
The character and type of joint surface appears to be directly controlled by the competence of the rock types. Thick-bedded, competent limestones between two shale beds in all instances contain more planar and well-defined joints (Figs. 7B, 8). Blocky limestones are produced where the vertical joint surfaces of Sets I and II intersect at about 90°. The surfaces are smooth except in areas where weathering has begun to roughen them. In a few instances geodes are cut by joint planes with the calcite material usually missing owing to advanced weathering (Fig 7B). Several examples show joint surfaces slicing clearly through a cherty limestone (Fig. 8B). Figure 8C is a close-up of the chert nodules cut by one of the joint surfaces of Figure 8B. In shaly limestones Sets I and II are still predominant. However, the joint surfaces tend to be curved and irregular rather than straight. This irregularity is especially noticeable at the outcrop shown in Figure 3C. When observing shale sections, the joints are visible only faintly or not at all on the surfaces of exposed beds. This is owing to the poor exposure and advanced weathering. The shale's incompetence also tends to make the joints less noticeable. Figure 8A illustrates how well-defined joint surfaces in thick-bedded limestones may become obscured in weathered, incompetent shales. Figure 2 shows one of the best examples of well-defined joints in limestone units with the same joints absent or not noticeable in adjoining shale beds. Measurements of joints belonging to Sets I and II were made in the more competent rocks since greater accuracy in strike and dip determinations could be made.
Figure 7--A, Set I joints transecting all of the exposed beds; Fort Riley Limestone; N. line, NE sec. 29, T. 27 S., R. 4 E. B, Blocky limestone with well-defined joint surface pitted by advanced weathering of geodes cut by join surface; Winfield Limestone; center E2 sec. 14, T. 30 S., R. 3 E.
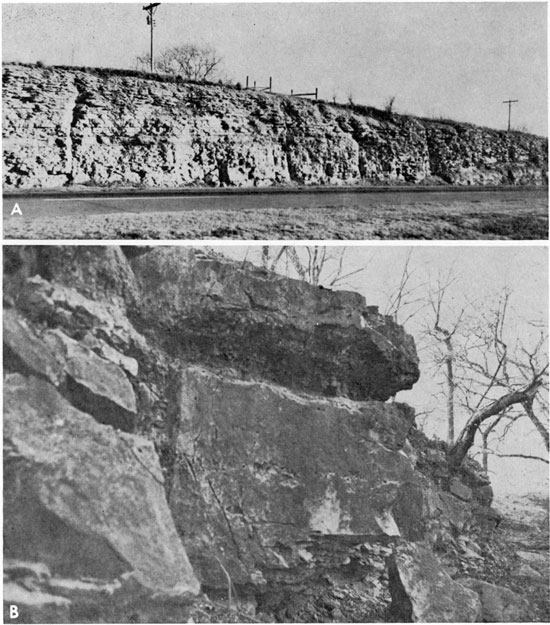
Figure 8--A, Blocky limestone with well-defined joint surfaces which become obscure in underlying shale; Winfield Limestone; S. line, SE SW sec. 31, T. 30 S., R. 4 E. B, Blocky limestone with well-defined joint surfaces cutting chert nodules; Florence Limestone; SE SE NW sec. 3, T. 26 S., R. 8 E. C, Close-up of one joint surface showing clearly cut chert nodules; Florence Limestone; SE SE NW sec. 3 T. 2 6 S., R. 8 E.
Some of the joint surfaces in both Sets I and II are nearly in contact, but most are separated several inches owing to local slumping-in which case the open spaces generally are filled with soil from the surrounding terrain. Vegetation may be growing in this soil causing the joint traces to be well defined (Figs. 3A, 5). The second type of joint is calcite filled. The calcite is usually a deposit along joint surfaces less than 1/8 inch apart (Fig. 9A). This type of joint is not common.
Figure 9--A, Calcite filling along joint surfaces. Compass points N. 72° E.; Herington Limestone; SE SW SW sec. 17, T. 23 S., R. 4 E. B, Curved joint trace on face of exposure with resulting surfaces characteristic of tangential forces; Winfield Limestone; center N2 sec. 10, T. 30 S., R. 3 E.
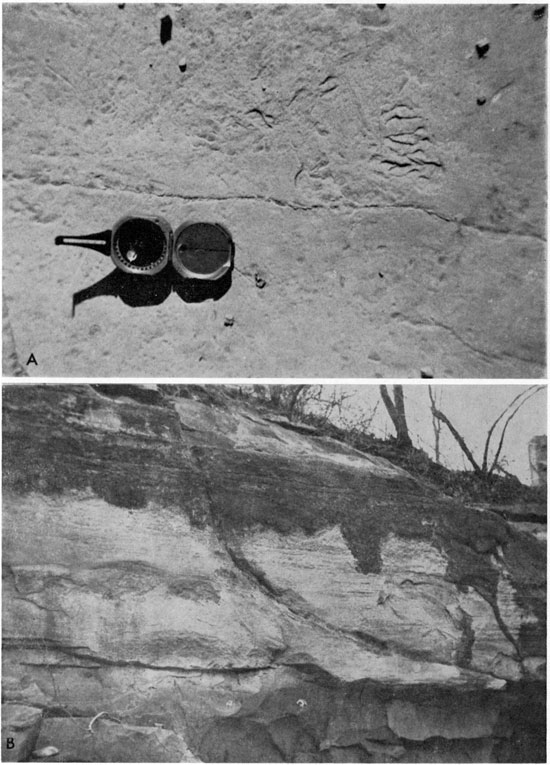
In the area of sec. 10, T. 30 S., R. 3 E. curved joint traces of large extent are present on the face of the exposure (Fig. 9B). When one of the adjoining blocks of limestone falls away, the resulting exposed joint surfaces are characteristic of the surface of chalk after being broken by tangential forces. The joints of Sets I and II are believed to be the result of shear because they exhibit characteristics similar to those that Parker (1942), Nevin (1949), de Sitter (1956), and Hills (1963) described and illustrated as being shear joints. These characteristics are the presence of plane surfaces cutting cleanly through nonhomogeneous rock types, vertical joint planes, great abundance in both strong and weak rock types, and consistent strike in different localities in the same general area.
Set III joints include many minor sets clustered about Sets I and II. The great majority of these joints are shorter than 10 feet, have variable strike, and are usually curved, irregular, and vertical. A few joints have dips of as small as 46°. When Set III joints intersect joints of Sets I and II, they are clearly subordinate in that they commonly terminate against a joint surface of one of the major sets. Set III joints are present most often in thin-bedded homogeneous limestone but are lost in an underlying or overlying shale. Set III commonly makes up 25 percent or less of the total number of joints in a given township.
According to Parker (1942), Nevin (1949), de Sitter (1956), and Hills (1963) joints with such properties may be classified as tension joints.
Horizontal fractures are those fractures the surfaces of which are planar and are oriented parallel to the bedding planes; they occur at random throughout the region and were not studied in detail in this paper. These fractures are best seen in road cuts and quarries where medium- to thick-bedded limestones are present. However, many outcrops do not exhibit horizontal fractures. Where present, the fractures are vertically spaced from 1 to 10 feet apart (Figs. 7A, 8B). No apparent correlation with depth occurs relative to vertical spacing of the beds.
Billings (1954, p. 121) presented the following theory for the origin of horizontal fractures: "Because of progressive lowering of the surface of the earth due to erosion and consequent decrease in the confining pressure, the rock expands in all directions. The vertical expansion is unimpeded, and only air has to be pushed away. The horizontal expansion is hindered by rock. Compressional forces parallel to the surface of the earth develop and cause rupture." As a result, horizontal fractures such as those just described would be formed.
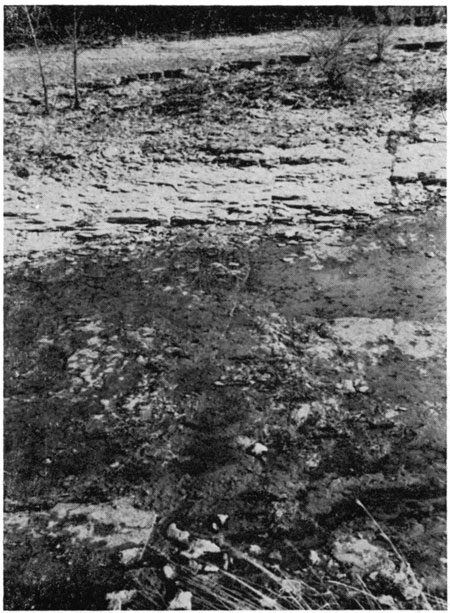
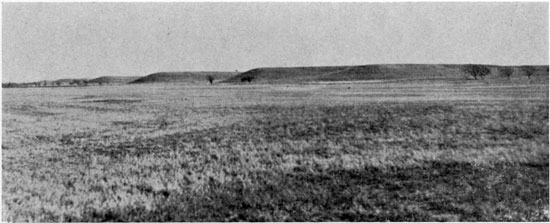
The joint pattern presented in this report appears to control the regional topography in two important ways. In many areas directly underlain by competent limestone the stream pattern and minor drainage ways follow very closely and probably were determined by the joint pattern. Although statistical analysis of this relationship is not within the scope of this report, the feature is shown well in SE sec. 13, T. 29 S., R. 6 E. and SW sec. 18, T. 29 S., R. 7 E. (Fig. 10). Here, northwestward-flowing streams are controlled by Set II and have cut into the cuesta with regularity along its extent.
Figure 10--Northwestward-flowing streams controlled by Set II cutting at regular intervals into cuesta; SE sec. 13, T. 29 S., R. 6 E. and SW sec. 18, T. 29 S., R. 7 E.
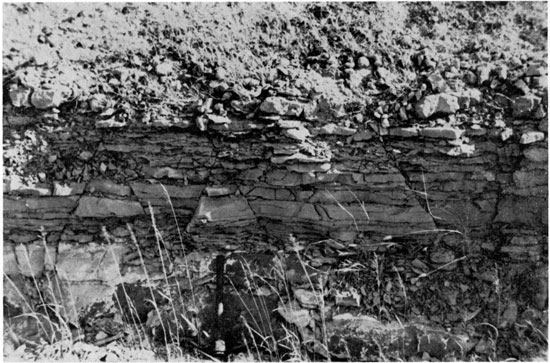
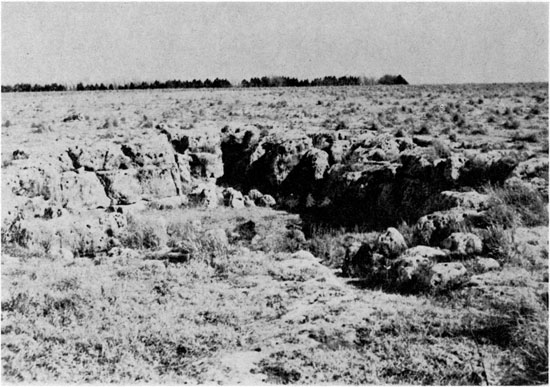
The jointing also appears to control the existence of "karst topography" found in the area directly southeast of El Dorado and in northeastern Butler and Cowley counties. Solution of limestone along joint surfaces produces extremely open joints resulting, in a few instances, in large caves in this area (Figs. 11, 12). With advanced solution, the roofs of these caverns collapse, forming sinkholes. In the sinkhole shown in Figure 13 many pitted and rounded joint surfaces are present.
Figure 11--Open joint traces resulting from advanced solution of limestone; Set II joint extends into picture while Set I joints are perpendicular to it; Winfield Limestone; NE sec. 13, T. 27 S., R. 3 E.
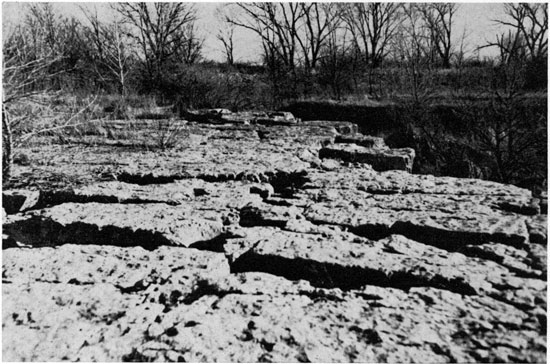
Figure 12--Close-up of open vertical joint. Picture taken at far end of the Set II joint of Figure 13; Winfield Limestone; NE sec. 13, T. 27 S., R. 3 E.
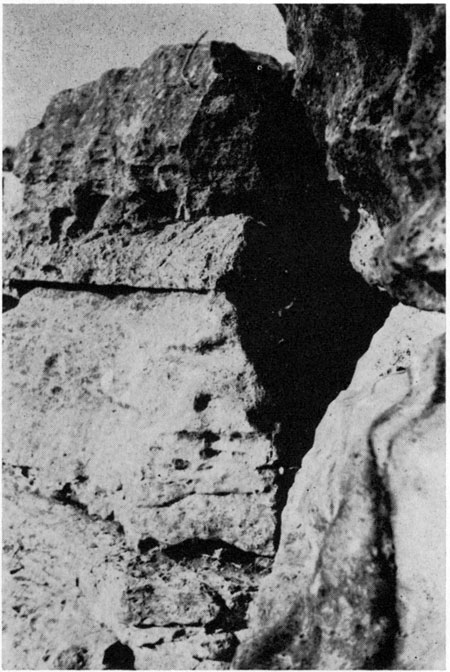
Figure 13--Sinkhole formed from collapse of limestone beds along maturely weathered joint surfaces. Many pitted and rounded joint surfaces are present; Fort Riley Limestone; NE NE sec. 6, T. 2 7 S., R. 6 E.
The age of the joints is of great importance if the source of the deformational force is to be located. As a result, it is valuable to consider the geologic age of the strata containing the joint system. The same joint pattern is shown to exist in both lower Permian and upper Pennsylvanian rocks. Assuming that the joints are younger than the youngest strata containing the joint pattern, the jointing is at least post-lower Permian in age. Because upper Permian and Cretaceous rocks are absent in eastern Kansas, the latest period during which the joints formed cannot be determined from stratigraphic evidence.
Plate 2 shows that in the subsurface strata a series of essentially parallel anticlinal folds and domes trend northeast-southwest. The fold axes have strike values ranging between due north and N. 35° E. The Nemaha axis strikes N. 20° E. in northeastern Cowley County with the strike changing to N. 35° E. as the structure is progressively traced to the north. North of T. 25 S., the strike of the Nemaha axis is approximately north. The Beaumont Anticline as well as smaller structures have axes trending subparallel to the Nemaha Anticline but with less variable strike.
The Bourbon Arch is the only major fold in this region which varies greatly from the northeast-southwest trend. The western extremity of the arch terminates against the Nemaha Anticline in western Chase County. From this point its axis strikes east-northeast. Farther east, the strike of the axis changes so that from northern Greenwood County eastward, the axis has a strike of approximately N. 60° W.
The strike values and trends of the several fold axes were obtained from maps by Bass (1936), Jewett (1951), Merriam (1958 and 1960), and Cole (1962). Exposed beds do not dip more than 5° on the flanks of folds in this area. Beds at outcrops studied for this report have dips of less than 4°, with 1° dips common. In the subsurface, dips are greater with the east limbs of anticlines having the largest values. Also, the later westward regional tilting decreased the original dips of the east limbs of the anticlines.
Throughout the region, Set I and Set II joints are diagonal in relation to the fold axes. The strikes of the fold axes do not vary enough within the region to show that the joint set strikes are independent of the strike of the fold. Whenever the joints of Set III occur in abundance, they show close parallelism to the existing fold axes. Thus, they are strike joints. On the basis of these data, it is concluded that the exact age of the joints relative to the folds cannot be accurately determined.
For the most conclusive evidence of the age of the joints relative to the folds, the age of the folds themselves must be considered. The major movements along the Nemaha Anticline and Bourbon Arch are considered to have occurred prior to Pennsylvanian time (Lee, 1943). Therefore, these structures must be older than the jointing since the joints cut lower Permian rocks. The Beaumont Anticline and similar anticlines began their development in Cherokee time which continued throughout subsequent periods. Thus they too are, at least in part, older than the jointing. It is likely that slight readjustments along the folds at the time of jointing may have aided in the close relation the folds appear to have to the joints. Therefore, the jointing may have developed simultaneously with later movement of the subsurface folds.
In an area of gently-dipping beds which contain nearly vertical joints, it is difficult to detect the effects of tilting of the joints as a result of later folding (Parker, 1942). Special problems to be considered in this region include local slumping as well as the fact that the manner of exposure of many beds obscures data regarding the exact dips of the joints. For these reasons a true regional picture of the effect of folding on the tilting of the joints is not discussed.
Only a few normal faults occur at depth in this area, and very few visible faults are present in exposed rocks. The subsurface faults generally strike about N. 20° E., although some have northwest strike. These faults occur primarily along the Nemaha Anticline and are found only in Mississippian and older rocks. The faults are believed to be older than the joints and, therefore, not primarily responsible for the jointing. Since their vertical extent is limited, the effect of slight movements along their surfaces, resulting from later readjustments along the Nemaha Anticline, would be greatly diminished upon reaching the surface rocks. Also, it does not seem reasonable that such a localized fault zone is responsible for the formation of a regional joint pattern. However, it is possible that movement along these deep-seated faults, coupled with other regional subsurface movements, might be responsible for producing a regional joint pattern.
Although very few surface faults were observed in this region, a belt of "en echelon" normal faults striking 20° to 40° northwest is present in exposed Pennsylvanian rocks on the Central Plains of Oklahoma (Foley, 1926). Melton (1929) showed that close correlation exists between these faults and the northwest-striking joint set which he describes. According to Melton, these faults and joints of Oklahoma are believed to have been formed by initial compressive stresses of the Ouachita orogeny. Therefore, if the joint system described in this report is related to the one Melton describes, the joints in this region may have an origin similar to the "en echelon" faults in Oklahoma.
The maximum regional dip of the surface strata throughout this region varies from 40 to 80 feet per mile, or less than 1°. locally the regional dip becomes greater over folds. This dip is primarily northwest in the northern portion of the region changing to west-southwest in southern Cowley County. The only variation from the overall westward dip of the surface strata is slight and exists along the east flanks of the Nemaha Anticline and other smaller anticlinal structures. Here, the dip is eastward. However, a short distance east of these structures the beds regain their westward dip. Local increases in dip occur with depth over the Nemaha and Beaumont Anticlines, but have no effect on the uniformity of the overall regional dip. In the subsurface, pre-Pennsylvanian beds dip gently north and south from the Bourbon Arch.
In relation to the regional dip, the joints of Sets I and II are diagonal joints. Although slight changes in the strike of the regional dipping beds exist, no corresponding changes in the joint pattern can be detected. This indicates that the joints might be post-tilting in age. However, the change of strike of the axis of regional tilting may not be significant enough to justify this comparison. Over the Bourbon Arch the strike of the joints appears to change little indicating that the joints are unaffected by the pre-Pennsylvanian north-south dip of the beds. Therefore, the joints are assumed to be at least post-Mississippian in age.
Even though most of the joints are nearly perpendicular to the bedding, practically all of them vary from 1° to 5° from the vertical to the earth's surface. This may indicate that the jointing occurred first, followed by regional tilting which rotated the joint planes slightly from the vertical. However, regional tilting and the jointing may have been contemporaneous products of the same regional deformation.
Movements resulting in important regional tilting took place during post-Missourian time in the Pennsylvanian Period, the middle Permian Period, post-anhydrite (Permian) to pre-Cretaceous time, post-Cretaceous to pre-Pliocene time, and during post-Pliocene time (Walters, 1958). As a result the present regional dip and probably the joint system are the product of several readjustments and not one large-scale regional tilting.
The persistent and nearly uniform joint system in Permian and Pennsylvanian rocks in south-central Kansas appears to have many characteristics similar to the joint system of the Central Plains of Oklahoma. The Oklahoma joint system, described by Melton (1929), extends northward from the Ouachita Mountains to northeastern Oklahoma. The area studied in this report is adjacent and northwest of the Oklahoma region.
Melton reports that two dominant joint sets compose the Oklahoma joint system. In general, the two sets form an obtuse angle opening northeastward. The most prominent of these sets radiates fanwise from the center of the Ouachita Mountains and in central Oklahoma strikes N. 35°-45° W. with a modal strike of about N. 37° W. According to Melton the strike of this joint set correlates very closely with the individual faults of the "en echelon" fault belt described by Foley (1926). The second, less prominent joint system with respect to numbers, strikes N. 50°-80° E. Within 100 miles of the Ouachita Mountains the northeast striking set shows less systematic arrangement than does the northwest set. Other joint sets cluster around the two major sets but are of minor importance in respect to numbers. The joint system described by Melton cuts strata as high as the middle Permian section of Oklahoma. Melton considered that the field work was insufficient to determine whether or not upper Permian strata are involved.
The joint system in south-central Kansas is similar to the joint system described by Melton in the following ways: The northwest striking sets in both areas have almost identical strike values. In Kansas the northwest set strikes between extreme values of 24° and 56° and has a modal strike of N. 35° W. This modal strike varies by only 2° from the N. 37° W. value given for the northwest set in Oklahoma. The northeast set in Kansas strikes between extreme values of 50° and 70° with a modal strike of N. 61° E. The northeast set in Oklahoma strikes between 50° and 80°. In both areas other sets of joints cluster about the two major sets and are of minor importance in respect to numbers.
By plotting the dip of the joint planes on a three-dimensional diagram, qualitative comparison shows that a greater number of nearly vertical exist in Kansas. This may be the result of inadequate sampling because at most outcrops studied in this report dip data are inaccessible or unreliable.
The age of the joints in the two areas may be the same since in both places the joints cut upper Pennsylvanian to lower Permian strata with the same pattern.
The two joint systems appear to be very similar and may have a common origin. Melton considered that the two prominent sets of nearly vertical joints were formed by the initial horizontal compressive forces in the Ouachita Mountains. The deeply eroded Pennsylvanian and Permian beds flanking the Arbuckle Mountains are described by Melton (p. 743) as being cut by the northwest joint set, "Hence that part of the Ouachita Mountain folding which caused the jointing is of a much later origin than the Arbuckle folding . . . the diastrophic movement which caused this jointing was the first strong compressional movement in the formation of the Ouachita Mountains."
Post-Jurassic doming of the Ouachita Mountains as a cause of the jointing is eliminated inasmuch as the lower Cretaceous rocks south of the Ouachita Mountains do not show a similar joint pattern. The joint system south of the Ouachita Mountains has been studied by Boyer (1967) who reports that joint sets strike N. 20°-30° E., N. 55°-70° W., and east-west in central Texas.
Moody and Hill (1956) suggested that extensive northwest transport has taken place along large wrench-faults in the Ouachita Mountains. It is herein postulated that an outward moving, horizontal, compressive force generated by the wrench-fault tectonics of the Ouachita uplift, coupled with an opposite force created by wrench-fault tectonics elsewhere in the continental polygonal block may be postulated as being responsible for the formation of such a widespread regional fracture system. The Nemaha Anticline is not necessarily believed to have created the coupling force since the joint system in south-central Kansas is little affected by this structure as it passes over the Nemaha crest. Instead, as Fath (1920) suggested, it is believed that the whole system should be referred to forces farther west, such as shear zones and wrench-fault tectonics in the Rocky Mountain zone.
Certain inter-relationships of mid-continent joint systems have become apparent during this study which accent the complexity of their origin. Figure 14 contains symbols which represent strike and relative abundance of prominent joint sets as reported below. Information for south-central Kansas is derived from this study. The symbol in Oklahoma represents Melton's work which is also partly described in this report. The symbols in southeastern and north-central Kansas represent scattered reports of joint sets confirmed by aerial photographs. Information for northeast Kansas was obtained from Stewart (1967). Stewart believes that the north-trending set may be more abundant than actually represented and that this set could result from shear forces. He also noted that unweathered joints in certain limestone beds parallel joints in the same bed which show definite evidence of weathering. Thus, two different periods of jointing are indicated in this area. Hinds and Greene (1915) reported the information represented by the symbol in Missouri while studying Pennsylvanian strata. Merriam (1964) showed that drainage patterns in bedrock in northwest Kansas may be controlled by structural lineations as represented by the symbol.
Figure 14--Midcontinent joint systems (modified from Geological Highway Map Committee, 1966).
Figure 14 shows that at least two major joint systems may be present in the midcontinent region. The system studied in this report appears to extend from southern Oklahoma to northeastern Kansas and western Missouri. The other system predominates only in northeastern Kansas and western Missouri. Both systems have a common set which strikes approximately N. 60° E. However, the N. 35° W. set in Oklahoma and southeast Kansas becomes minor to the north where the N. 0°-3° E. set is predominant. An interesting observation is that the joint sets in the system in northeast Kansas and Missouri are separated by an acute angle of 60° Which opens northeast. The joint sets in southeastern Kansas and Oklahoma are commonly separated by a 90° angle with any existing acute angles pointing northwest. Since the joint sets in the northeast Kansas and Missouri systems are separated by 60°, it appears that by use of the strain-ellipsoid these zones of structural weakness might be oriented properly with more success than the joint system reported herein.
The preceding information suggests that more work concerning midcontinent joint systems is justified. A study might be made concerning the inter-relationships of the joint systems just described and of the deformational forces which caused the joint system in northeast Kansas and western Missouri. Although evidence indicates the joint system of this report is the youngest, delineation of the apparent transition area in east-central Kansas should be studied further. Special emphasis should concern the relative age of the two joint systems. There exists also a need for more information concerning the N. 60° E. joint set. Since it is common to both systems and may be present in northwest Kansas (Fig. 14), it is possible that this joint set represents a midcontinent zone of directional weakness.
Bass, N. W., 1929, Geology of Cowley County, Kansas: Kansas Geol. Survey, Bull. 12, 203 p. [available online]
Bass, N. W., 1936, Origin of the Shoestring Sands of Greenwood and Butler counties, Kansas: Kansas Geol. Survey, Bull. 23, 135 p. [available online]
Bayne, C. K., 1962, Geology and ground-water resources of Cowley County, Kansas: Kansas Geol. Survey, Bull. 158, 219 p. [available online]
Billings, M. P., 1954, Structural geology, 2nd Ed.: Prentice-Hall, Inc., Englewood Cliffs, N.J., 514 p.
Blackwelder, Eliot, 1920, Origin of central Kansas domes: Am. Assoc. Petroleum Geologists, Bull., v. 4, no. 1, p. 89-94.
Boyer, R. E., 1967, Interpretation of joints and airphoto linear features in central Texas (abs.): Geol. Soc. Am., south-central section (Mar. 31).
Bucher, W. H., 1920, The mechanical interpretation of joints: Jour. Geol., v. 28, p. 707-730.
Cole, V. B., 1962, Configuration of top of Precambrian basement rocks in Kansas: Kansas Geol. Survey Map. 26.
de Sitter, L. U., 1956, Structural geology, 1st Ed.: McGraw-Hill Book Company, Inc., New York, 552 p.
Fath, A. E., 1920, Origin of the faults, anticlines, and buried "Granite Ridge" of the northern part of the Mid-Continent oil and gas field. U.S. Geol. Survey, Prof. Paper 128-C, p. 75-84.
Fenneman, N. M., 1938, Physiography of Eastern United States, 1st Ed.: McGraw-Hill Book Company, Inc., New York, N.Y., 691 p.
Foley, L. L., 1926, The origin of faults in Creek and Osage counties, Oklahoma: Am. Assoc. Petroleum Geologists, Bull., v. 10, no. 3 , p. 293-303.
Geological Highway Map Committee, 1966, Mid-continent region geological highway map, Kansas-Missouri-Oklahoma-Arkansas: Am. Assoc. Petroleum Geologists, Tulsa, Okla., Map no. 1.
Hills, E. S., 1963, Elements of structural geology: John Wiley and Sons, Inc., New York, N.Y., 483 p.
Hinds, Henry, and Greene, F. C., 1915, The stratigraphy of the Pennsylvanian Series in Missouri: Missouri Bur. Geology and Mines, v. XIII, 2nd ser., 407 p.
Hubbert, M. K., 1928, Direction of stresses producing given geologic strains: Jour. Geol., v. 36, p. 75-84.
Jewett, J. M., 1951, Geologic structures in Kansas: Kansas Geol. Survey, Bull. 90, pt. 6, 68 p. [available online]
Lee, Wallace, 1943, The stratigraphy and structural development of the Forest City Basin in Kansas: Kansas Geol. Survey, Bull. 51, 142 p. [available online]
Lee, Wallace, 1956, Stratigraphy and structural development of the Salina Basin area: Kansas Geol. Survey, Bull. 121, 167 p. [available online]
McCoy, A. W., 1921, A short sketch of the paleogeography and historical geology of the Midcontinent oil district and its importance to petroleum geology: Am. Assoc. Petroleum Geologists, Bull., v. 6, no. 5, p. 541-584.
Melton, F. A., 1929, A reconnaissance of the joint systems in the Ouachita Mountains and Central Plains of Oklahoma: Jour. Geol., v. 37, p. 729-764.
Merriam, D. F., 1958, Preliminary regional structural contour map on top of the Lansing Group (Penn.) in Kansas: Kansas Geol. Survey, Map 19.
Merriam, D. F., 1960, Preliminary regional structural contour map on top of the Mississippian rocks in Kansas: Kansas Geol. Survey, Map 22.
Merriam, D. F., 1964, The geologic history of Kansas: Kansas Geol. Survey, Bull. 162, 317 p. [available online]
Monnett, V. E., 1922, Possible origin of the structures of the Midcontinent oil field: Econ. Geol., v. 17, p. 194-200.
Moody, J. D., and Hill, M. J., 1956, Wrench-fault tectonics: Geol. Soc. Am., Bull., v. 67, p. 1207-1246.
Moore, R. C., 1918, Geological history of crystalline rocks of Kansas: Am. Assoc. Petroleum Geologists, Bull., v. 2, p. 98-113.
Nevin, C. M., 1949, Principles of structural geology, 4th Ed.: John Wiley and Sons, Inc., New York, N.Y., 410 p.
Oakes, M. C., 1959, Geology and mineral resources of Creek County, Oklahoma: Oklahoma Geol. Survey, Bull. 81, 134 p.
Parker, J. M., III, 1942, Regional systematic jointing in slightly deformed sedimentary rocks: Geol. Soc. Am., Bull., v. 53, p. 381-408.
Powers, Sidney, 1925, Structural geology of the Midcontinent Region: A field for research: Geol. Soc. Am., Bull., v. 36, p. 379-392.
Reeves, J. R., 1929, El Dorado Oil Field, Butler County, Kansas: Structure of typical American oil fields, a symposium: Am. Assoc. Petroleum Geologists, v. 2, p. 160-167.
Rich, J. L., 1931, Source and date of accumulation of oil in Granite Ridge Pools of Kansas and Oklahoma: Am. Assoc. Petroleum Geologists, Bull., v. 15, no. 12, p. 1431-1452.
Stewart, G. F., 1967, Jointing in Upper Pennsylvanian limestones in northeastern Kansas: Kansas Geol. Survey, Bull. 187, pt. 1, p. 17-19.
Tanner, W. F., 1963, Tectonic patterns in the Appalachian-Ouachita Oklahoma Mountain complex: Shale Shaker, v. 14, no. 3, p. 2-6.
Walters, R. F., 1958, Differential entrapment of oil and gas in Arbuckle Dolomite of central Kansas: Am. Assoc. Petroleum Geologists, Bull., v. 42, no. 9, p. 2133-2173.
Kansas Geological Survey,
Placed on web June 16, 2010; originally published in Sept. 1968.
Comments to webadmin@kgs.ku.edu
The URL for this page is http://www.kgs.ku.edu/Publications/Bulletins/191_2/index.html