Kansas Geological Survey, Bulletin 152, pt. 2, originally published in 1961
Originally published in 1961 as Kansas Geological Survey Bulletin 152, pt. 2. This is, in general, the original text as published. The information has not been updated. An Acrobat PDF version (4.6 MB) is also available.
Plastic flowage in the pillars and floors of salt mines at Hutchinson and Lyons, Kansas, is indicated by buckling, spalling, and fracturing. Detailed measurements of the relative size of the pillars in newly opened rooms and crosscuts were made over a period of 11 months. These data indicate that the salt flowage is due to pressure of the overburden and is controlled by the volume of salt excavated and configuration of the excavation. Plastic flowage causes folds and fractures to develop only in the floor of the Lyons mine. The orientation of structures and rates of flowage in the base, top, and middle of pillars are governed by the direction of easiest relief of stress, which is controlled by the mining plan.
Plastic flowage indicated by pillar spreading and spalling is observed in the Lyons, Kansas, mine of the American Salt Company and the Hutchinson, Kansas, mine of the Carey Salt Company. Floor buckling and fracturing takes place only in the Lyons mine. The purpose of this investigation was to determine in detail the nature of these movements and relationship of floor structures to the mining plan.
We are grateful to Mr. Leo Reid of the Carey Salt Company and Mr. Otto Rueschoff of the American Salt Company for granting us permission to use mine facilities. James L. Peterson, John C. Davis, Kenneth Wainwright, Daniel Habib, William J. Horner, and Robert Tedrick helped in recording measurements.
When salt is mined underground, stresses originally distributed throughout a large area are concentrated in the pillars. These stresses are relieved as the pillars undergo continuous permanent deformation without fracture, a process commonly called plastic flow. Plastic flowage begins the instant a small amount of salt is excavated. As mining continues, pressure on the pillars increases and plastic flow continues indefinitely.
The plastic flow mechanism in crystal aggregates has been studied in the field of metallurgy (Barrett, 1943; Stanford, 1949; Rotherham, 1951). Metal crystals under stress show displacement of the relative position of atoms in the crystal lattices, this displacement resulting in plastic flow (Taylor and Quinney, 1933-1934). It has been found that many plastic flow characteristics of metals are generally applicable to salt (Bailey, 1926; Griggs, 1939, 1940; Kanter, 1956).
A salt grain in an aggregate is surrounded on all sides by other salt grains and cannot change its shape in an arbitrary manner. The single salt crystal tends to act like the aggregate as a whole. Plastic flowage is the result of many complex processes going on inside the aggregate (Nadai, 1931). Some of the processes that will cause a change in shape of salt crystals are listed below:
Reusch investigated the behavior of halite under compressive stress, and later, Rinne (1904) subjected confined prisms of rock salt to pressures as great as 28,452 psi for periods ranging from 8 to 25 minutes. Adams (1910) repeated some of Rinne's experiments using pressures as great as 157,000 psi. These workers found that in all cases pressures caused the salt to deform, and under extreme pressures the salt was flattened with almost no fracturing.
Plastic movement of salt in mines was first measured in Germany at the turn of the century (Busch, 1907). The interior diameters of 300-foot crosscuts at a depth of 2,460 feet were gauged, and salt was found to be moving in the newly excavated shaft at rates as much as 0.13 millimeters per day. Busch also drilled holes into the walls, 40 millimeters in diameter and 50 centimeters deep. These holes were filled with lead bars that fitted closely upon insertion. The bars at a depth of 1,640 feet were jammed after a few months, those at 964 feet jammed after 2 years, and above 820 feet the holes remained open. In the United States, few salt mines extend below 1,000 feet, hence conditions have not been conducive to studies of plastic flow. More recently Stamatiu (1936, 1937), did extensive work on crystal aggregates of rock salt, and other workers have studied single natural and synthetic crystals in order to determine the physical properties of salt.
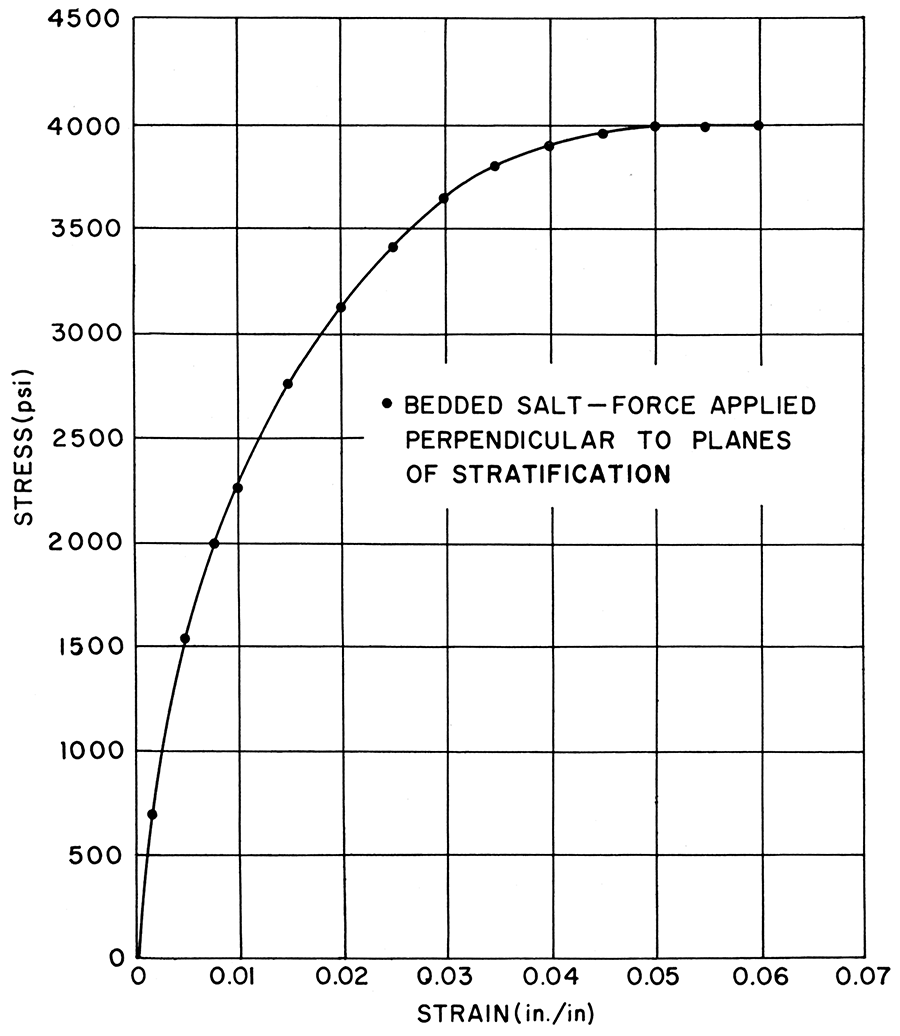
Salt crystal aggregates are currently being investigated by the University of Texas and by the U.S. Atomic Energy Commission in conjunction with radioactive-waste disposal. Results of laboratory work by Gunter and Parker (1961) show stress-strain relationships in bedded salt (Fig. 1; Table 1), the salt blocks used in these experiments having been taken from the Carey Salt Company's mine at Hutchinson, Kansas.
Table 1—Structural properties of bedded salt: when force is appLied perpendicuLar to bedding (Gunter and Parker, 1961).
| 1. Compressive strength (psi) | 4000 ± 400 |
| 2. Yield strength (psi) | 2300 ± 300 |
| 3. Apparent elastic limit (psi) | 1700 ± 200 |
Figure 1—Results of stress-strain tests at room temperature on un irradiated bedded salt loaded perpendicular to planes of stratification (Gunter and Parker, 1961).
The salt mines are located in the Hutchinson Salt member of the Wellington Shale, of Leonardian (Permian) age. The total thickness of the salt member is approximately 325 feet, and the unit being mined is 246 to 257 feet below the top of the member. The mine level is 645 feet below the surface at Hutchinson and is 1,000 feet below the surface at Lyons, owing to gentle westward regional dip.
At mine level, the salt unit contains a minimum of 95 percent sodium chloride and less than 5 percent impurities, principally clay. Clay particles are scattered throughout the salt, but most of the clay is concentrated in laminae or 'jahresringe', which are characteristic of most bedded salt deposits. These laminae are separated by 1- to 6-inch layers of relatively pure sodium chloride. Each lamina is generally thin and consists of a lateral series of small lenses of clay concentrated in low areas on the salt surface of deposition. A sufficient thickness of clay was deposited at some horizons to form a nearly continuous layer. This results in a zone of weakness along which separation or movement is possible (Dellwig, 1958).
The salt is mined by the room-and-pillar method. Pillars range from 40 feet square in some areas of the mine to 70 feet long and 50 feet wide in the area of study. Rooms (E-W) are approximately 48 feet wide and crosscuts (N-S) 35 feet wide. Vertical limits of mining are determined by shale beds. The mine floor is cut as close as possible to a 1- to 4-in~h shale bed. Only enough salt is left in the floor to prevent breakthrough and contamination of the mined product. Rooms are approximately 9 feet high, and above the roof are two additional partings. Mining to the "high top" (44 inches above present roof) results in a weak roof and collapse of the 36 inches of salt between the "high top" parting and the next higher parting. The 36-inch unit is too impure to be used.
The room-and-pillar method of mining is also used at Hutchinson. Pillars are approximately 45 to 50 feet square, and rooms and crosscuts are 45 to 50 feet wide. Vertical limits of mining are defined by a clay bed at the top and a 1-foot anhydrite layer at the bottom. The mine floor is cut as close as practicable to the anhydrite layer, leaving only enough salt on the floor to prevent breakthrough and contamination of the mined product. The rooms are approximately 10 feet high.
The salt layer left in the floor of the Lyons mine is characterized by folds and by shear and tension fractures (Pl. 1). These structures extend downward to the top of the shale bed, where they terminate. The nature and orientation of a structure and its location within a room or crosscut depend upon: (1) rate and direction of mining; (2) thickness of the salt layer left in the floor; and (3) shape and orientation of pillars. If a thick layer of salt is left in the floor, a broad arch develops that spans the entire room or crosscut. A small arch generally develops in a thin layer of salt at a point in the room where the salt is weakest. This arch will eventually crack in its crest and on its flanks. An arch may react in various ways: (1) it may continue through several rooms; (2) it may be broken at the intersection of a room and crosscut; or (3) it may turn from a room into an adjacent crosscut (Pl. 2).
Plate 1—A. Floor buckling along main haulageway, Lyons mine. Note right side of track rising even though in constant use. B. Floor buckle and tension crack, Lyons mine. Area was mined out 4 1/2 years before photograph. Room width had decreased 0.78 foot to cause buckle along wall. C. Folds in area that had been mined out for approximately 3 years, Lyons mine. Shearing in central fold oblique to fold axes.
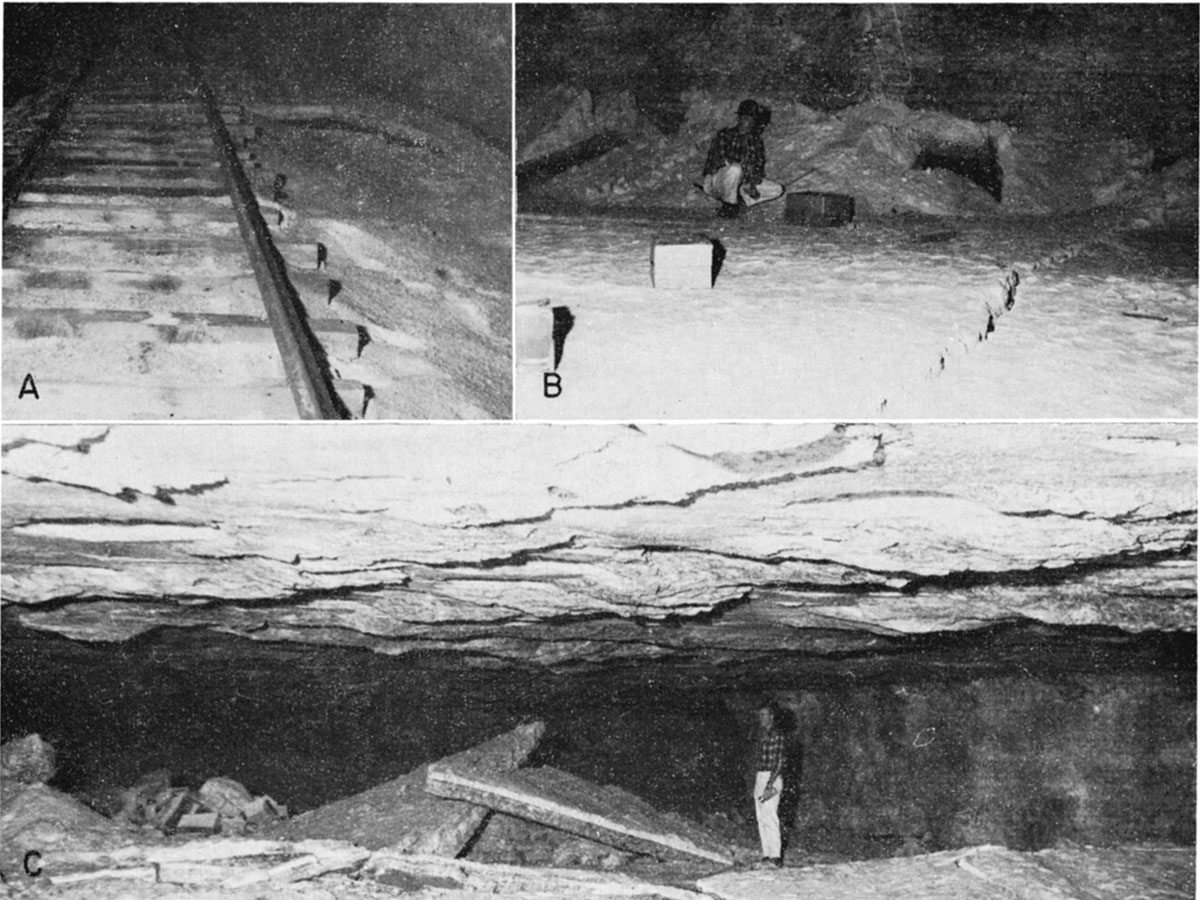
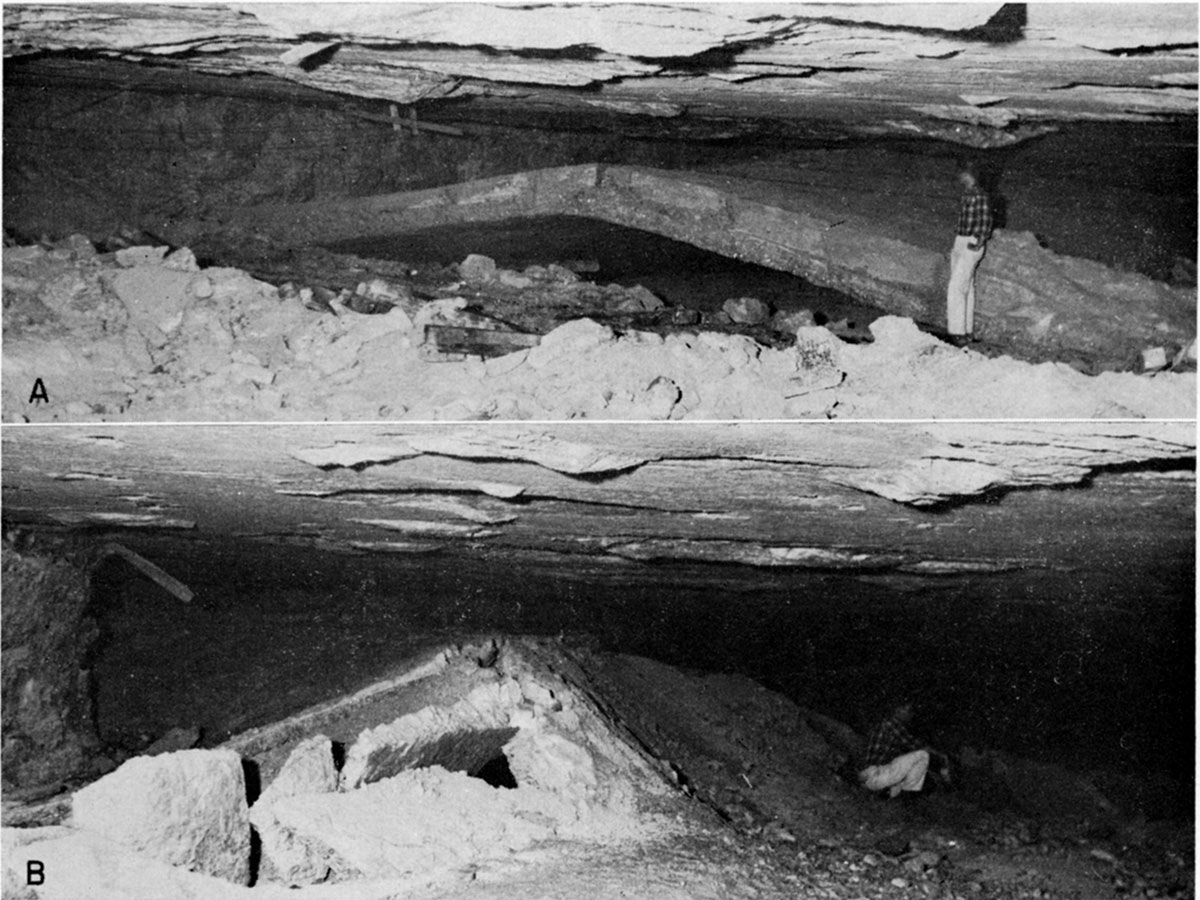
Plate 2—A. Floor buckles along abandoned main haulageway, Lyons mine. Room is 48 feet wide and originally 6.3 feet high. At open end of fold 2-foot salt layer has risen 3.36 feet. In rear of room, salt layer has buckled to touch roof (camera facing west). B. Continuation of fold shown in A. In this room only a thin layer of salt was left in floor (camera facing south).
Both shear and tension fractures develop in the intersections of rooms and crosscuts (Fig. 2d-g). These fractures commonly develop from the corner of one pillar to the corner of another pillar, perpendicular to the pillar face or across a room or crosscut. These openings may be as wide as 8 inches and generally develop soon after the folds begin to appear. Spalling of the pillars occurs throughout the mine. Generally it begins and ultimately is most pronounced near the junction of pillar and roof.
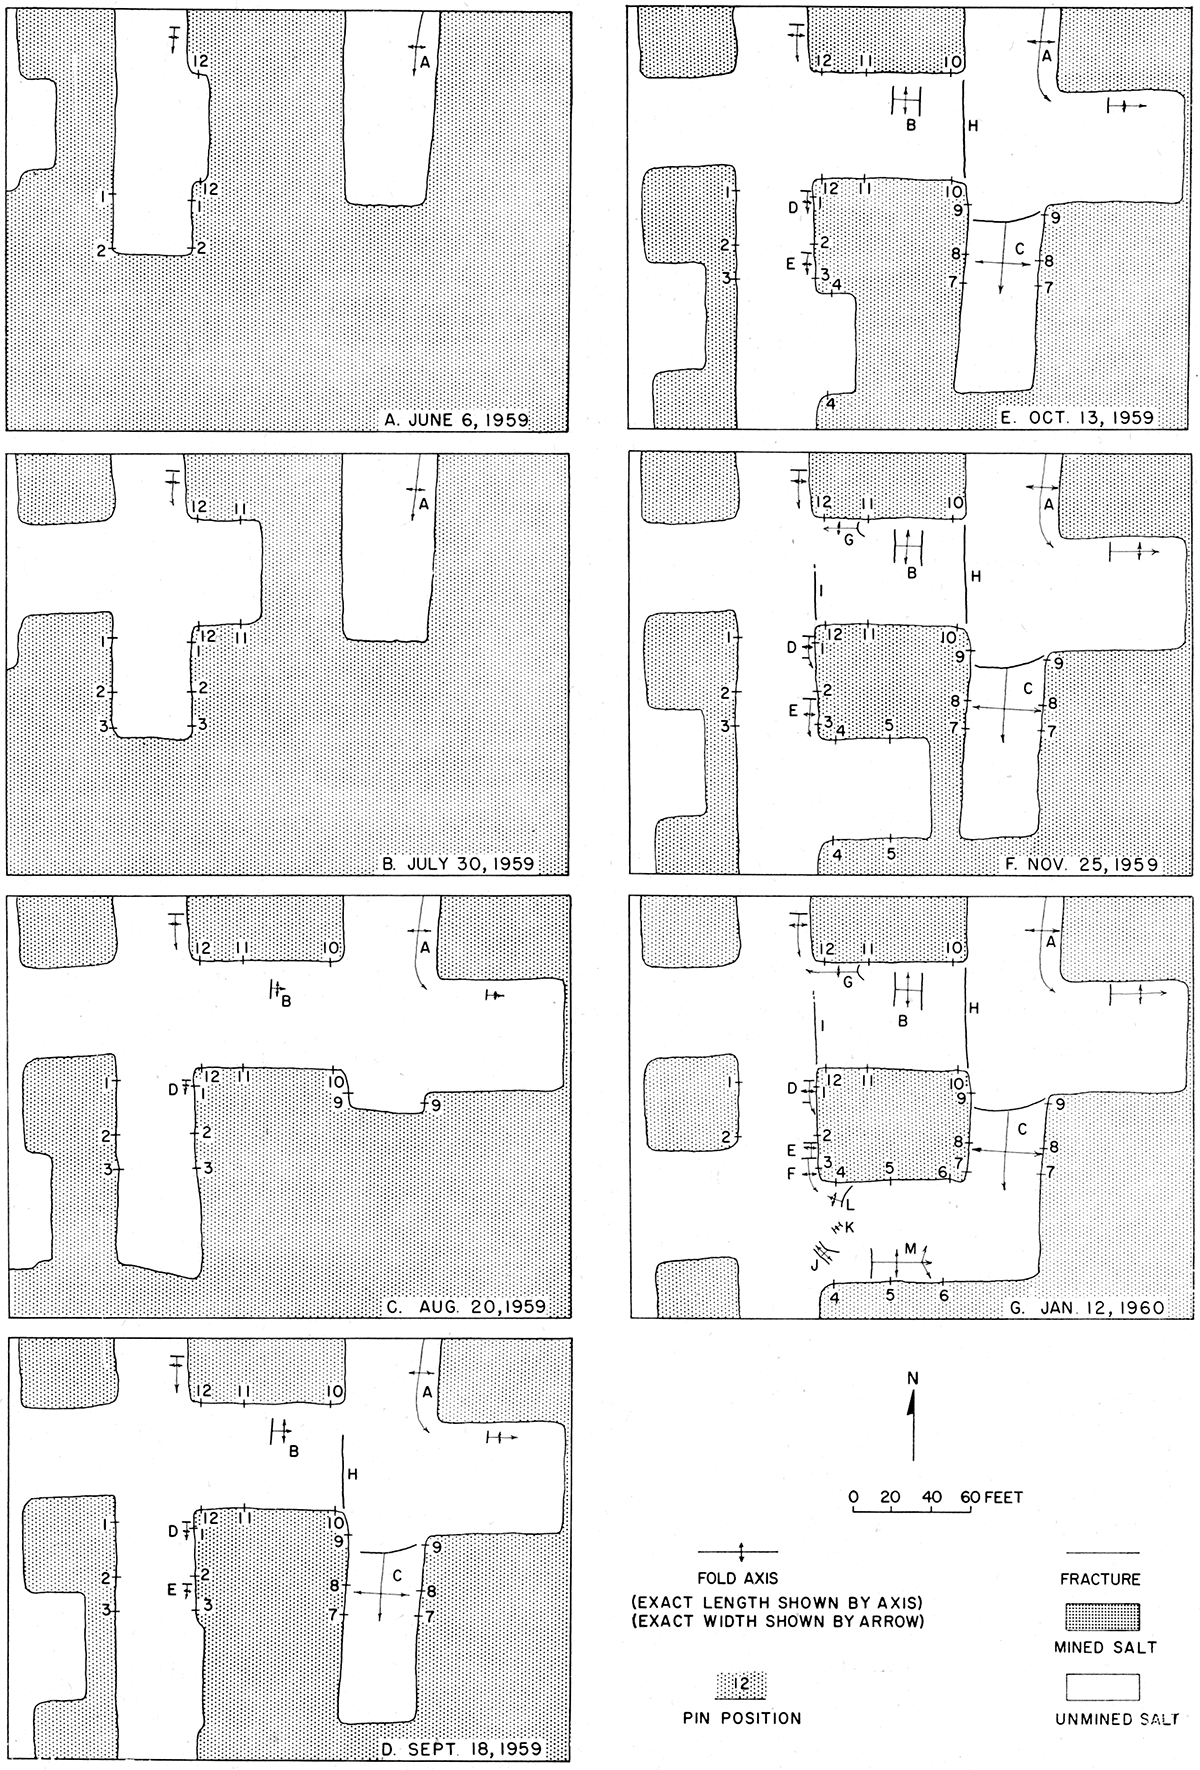
Figure 2—Mine plan of study area, Lyons mine, American Salt Company.
There are no visible structures developed in the salt left in the floor of the mine at Hutchinson. Pillar spalling does occur although not to the extent found at Lyons.
Two different methods were employed to determine the relative amount of movement in different areas of the pillars. There was a twofold purpose in choosing these methods of study: (1) movement could be recorded in the early stages of salt flowage; and (2) measurements could be taken at a working face without interfering with the mining equipment. Both methods were used in the Lyons mine but only one was employed in the mine at Hutchinson.
Figure 3—Mine plan of study area, Hutchinson mine, Carey Salt Company (see Fig. 2 for explanation of symbols).
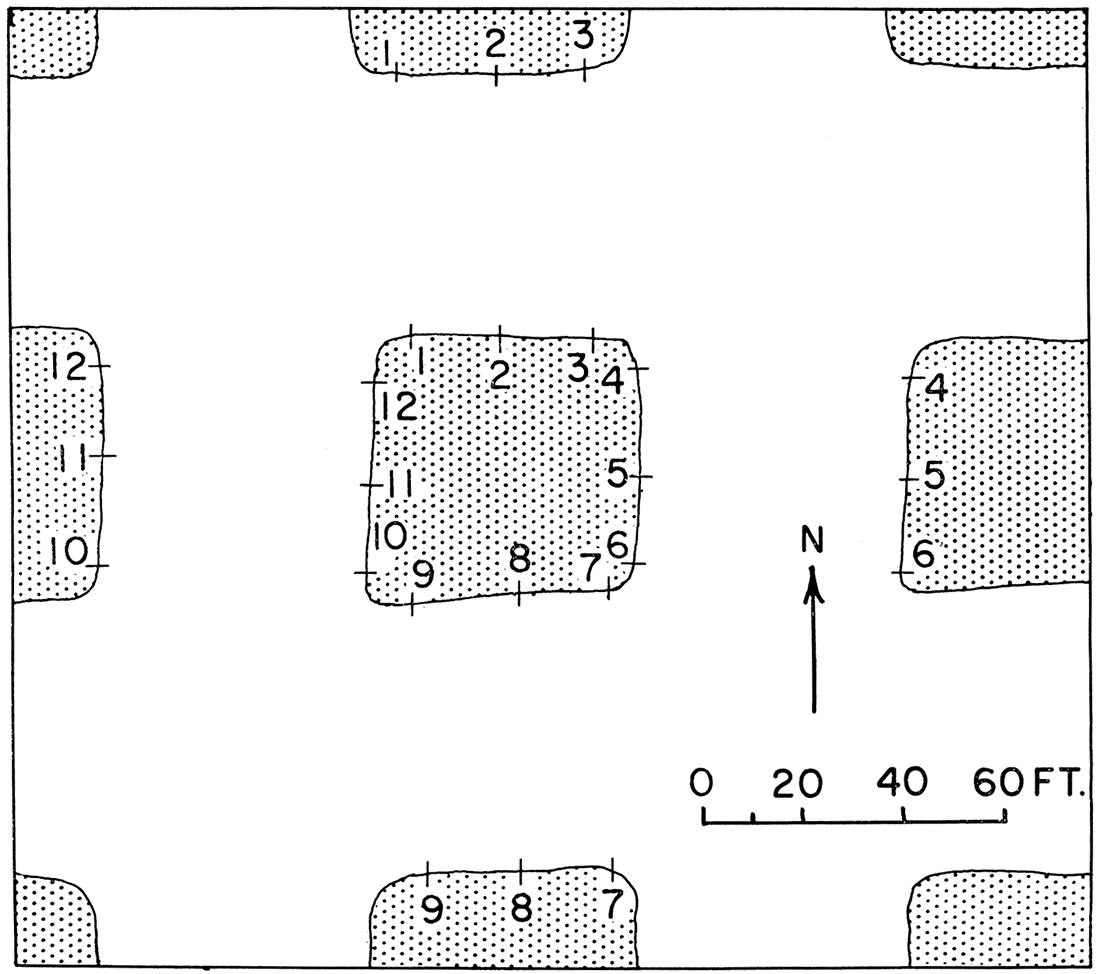
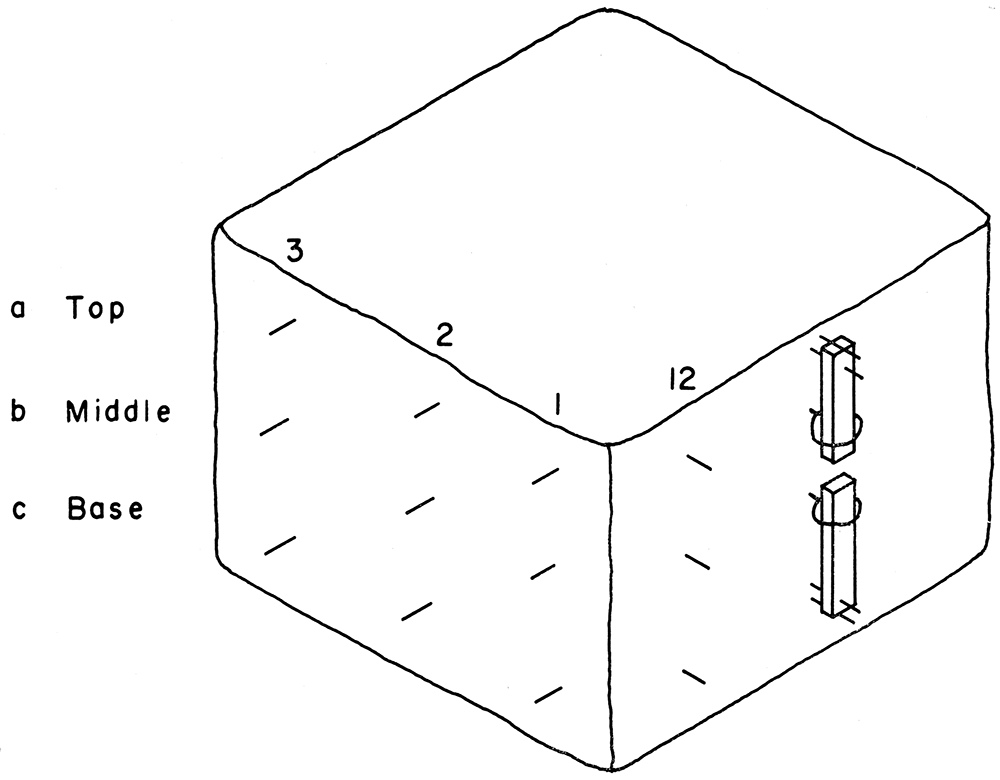
Figure 4—Locations of pins on face of salt pillars at Lyons and Hutchinson mines. Position of steel bars and reference pins on pillar face at Lyons mine.
By calculating the overburden using an average weight of 150 pounds per cubic foot for lithified sediments and 105 pounds per cubic foot for unconsolidated sands and gravels, and assuming that Gunter and Parker's pressure tests on the salt blocks are correct (Table 1), one may show that there is enough pressure to cause some degree of plastic flowage in the salt pillars of both mines (Table 2). Because of the difference in pressure on pillars at Lyons and Hutchinson, and the absence of a shale layer below the floor at Hutchinson, there is a difference in amount and nature of deformation in these two mines.
Table 2—Thickness of overburden and estimation of pressure on pillars in Lyons and Hutchinson mines.
| Lyons | Hutchinson | |
|---|---|---|
| Unconsolidated sediments (thickness in feet) | 55 (estimate) | 60 |
| Consolidated sediments (thickness in feet) | 945 | 585 |
| Extraction percentage | 69% | 75% |
| Pressure on salt in pillars (p.s.i.) | 3328 | 2612 |
| Elastic limit (Gunter and Parker, 1961) (p.s.i.) | 1700 | 1700 |
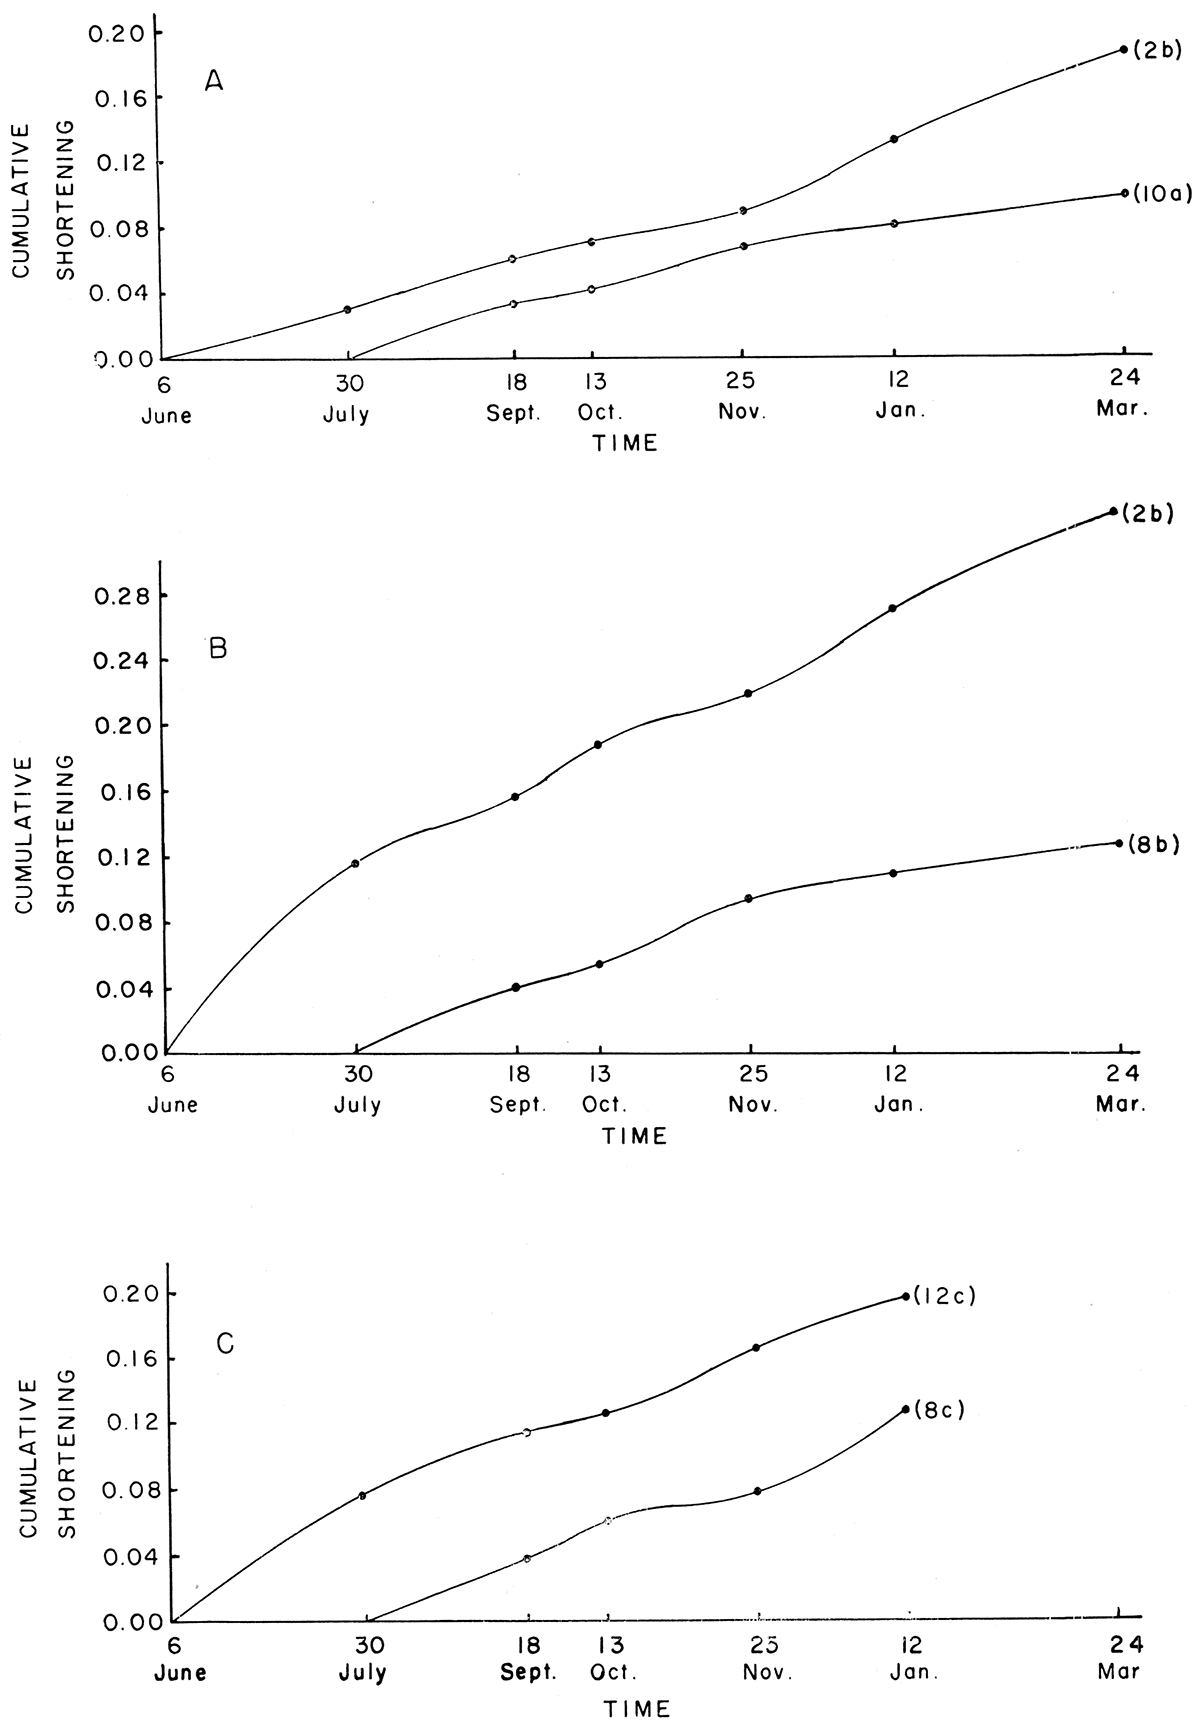
The spreading of the pillars was noticed almost immediately after the opening of the room. In all parts of the pillar, movement was rapid at first, then decreased for 2 to 3 months, then became rapid again (Fig. 5). The mining plan affected the rate of movement in all areas of the pillar. The maximum flowage per unit time took place in the center of the pillar, the intermediate amount of flowage was found in the base, and the least amount of flowage was found in the top. Movement in all parts of the pillar should eventually decrease again, and continue to decrease with time (Dellwig, 1958). As the rate of flowage decreases, spalling should become more common.
Figure 5—Curves showing cumulative decrease in measurements between pillars, in feet, Lyons mine. A. Maximum (2a) and minimum (10a) between tops of pillars. B. Maximum (2b) and minimum (8b) between middles of pillars. C. Maximum (12c) and minimum (8c) between bottoms of pillars.
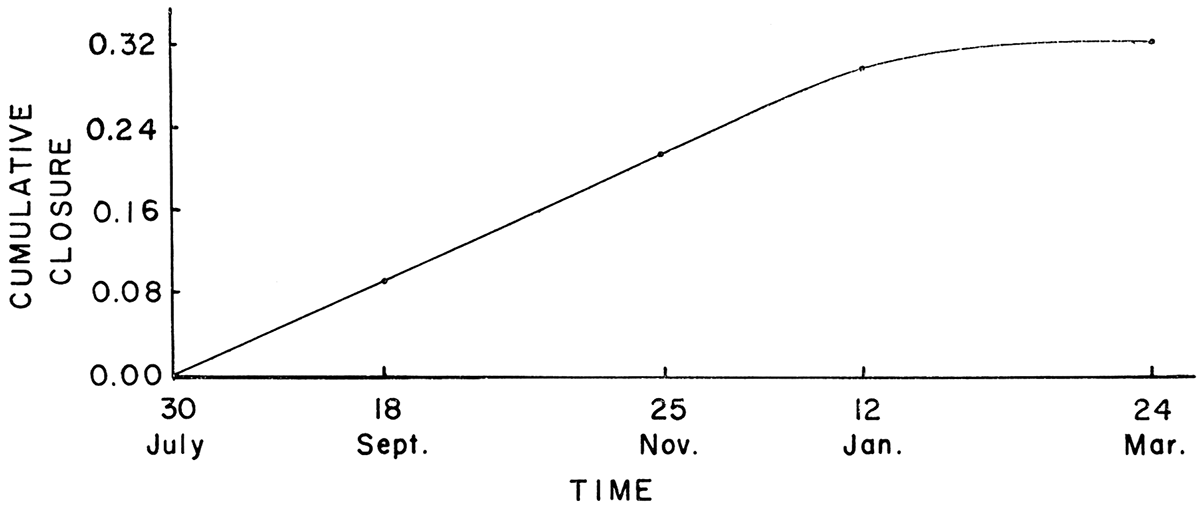
Periodic measurements with an inside micrometer between the two steel bars showed a vertical or pinching movement of the pillars. This movement was rapid at first and continued at a decreasing rate (Fig. 6). The mining plan had no effect on this type of movement.
Figure 6—Curve showing cumulative closure (in inches) between two steel bars in Lyons mine.
Flowage effects in the pillars were visible in the floor as early as 10 days after the opening of the room (buckle 'B' in Fig. 2c developed 10 days after the salt had been excavated). A simultaneous compressive and tensional force was exerted in each room and crosscut, owing to the outward spreading of the pillars as the salt was excavated. The compressive force was applied in a direction perpendicular to the pillar faces. The axes of the resulting arches are oriented parallel to the pillar faces. Where compressive forces were applied in the same direction by two adjacent pillars in two adjacent rooms, tensional forces developed in the same direction in the intervening crosscut.
The shale bed that underlies the salt left in the floor consists of alternating layers of silty shale and plastic clay shale. The latter acted as lubricating layers and reduced the frictional force between the salt in the pillar and the salt layer below the shale. This shale bed prevented the salt layer below it from acting as a strut, thus permitting easy expansion near the floor. Slickensides can be found in the shale beneath the arches. Development of structures relative to mining plan is plotted in Figure 2 a-g. Movement seemingly will continue indefinitely. An example can be found in one area of the mine that has been open for 20 years or more. The salt layer left in the floor has buckled to touch the roof and shows movement at the present time (Pl. 2 A, B).
Table 3—CaLcuLated and measured closure of salt piLLars at Lyons mine. (See Fig. 6g and Table 1).
| Calculated closure from uplift, feet |
Measured closure at nearest row of pins, feet |
|||
|---|---|---|---|---|
| Buckle | Pin | |||
| B | 0.260 | 11 | a | 0.191 |
| b | 0.230 | |||
| c | 0.132 | |||
| C | 0.240 | 7 | a | 0.100 |
| b | 0.150 | |||
| c | 0.103 | |||
| D | 0.300 | 1 | a | 0.176 |
| b | 0.335 | |||
| c | 0.192 | |||
| E | 0.250 | 2 | a | 0.192 |
| b | 0.337 | |||
| c | 0.151 | |||
"In the roof area the 61/2 feet of salt above the 9-foot roof acts as a strut, thus holding flowage in the higher part of the pillar to a minimum. Mining of the 44 inches of salt between the 9-foot roof and the 'high top' leaves a roof strut of only 36 inches between the 'high top' and the upper parting, which is not sufficiently strong to resist the lateral force, and readily buckles downward, aided by gravity" (Dellwig and Snyder, 1959, p. 41).
The total closure between the salt pillars can be correlated with the total movement required to form the arches in the floor (Table 3), keeping in mind, however, that the lower pins are fastened approximately 1.5 feet above the floor and probably do not show total movement that occurs at the base.
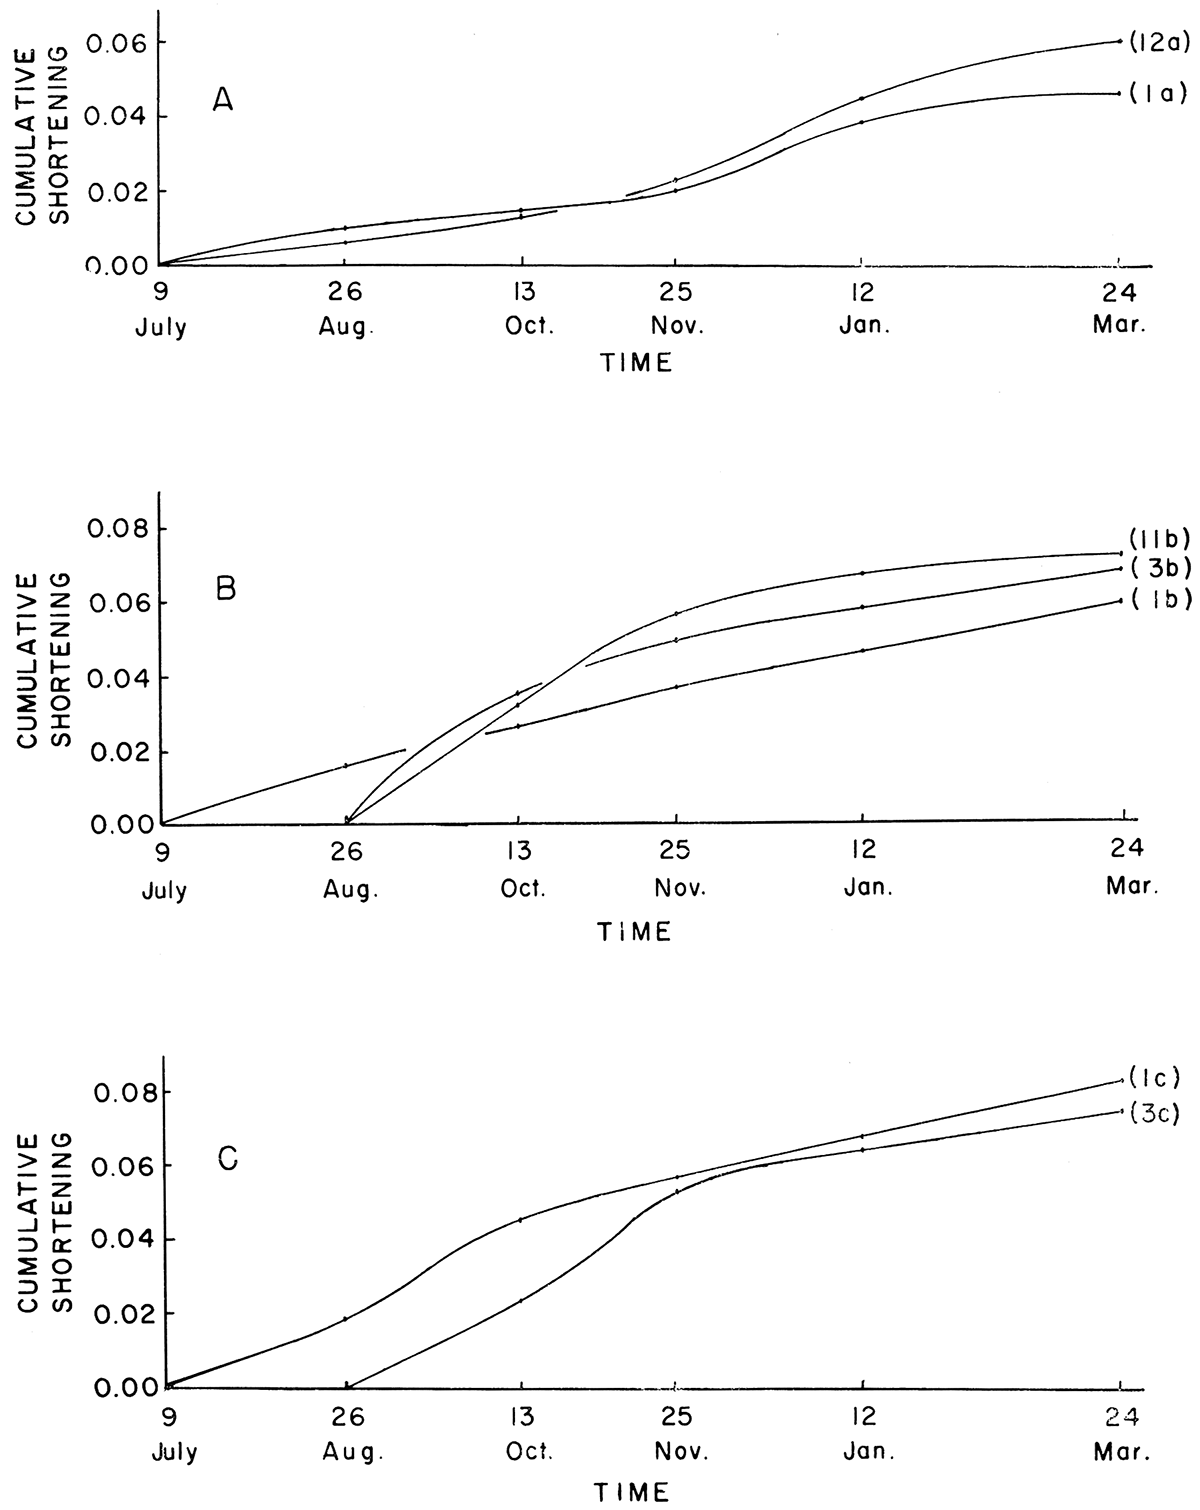
Because of the absence of an underlying lubricating shale layer, no visible floor structures were developed in the Hutchinson mine. Plastic flowage took place in the pillars but not to the extent found at Lyons. Rates of movement differed in different areas of the pillar (Fig. 7). Between the middle pins movement was fairly rapid at first, then decreased with time. The mining plan seems to have had no effect on the rate of movement in the center of the pillars. In the base and top of the pillars, the rate of plastic flowage seemingly was affected by the opening of a new room or the extension of mining. After mining in an area is complete, plastic flowage will decrease indefinitely in all parts of the pillar (Fig. 7). The maximum amount of movement took place in the center of the pillar. Movement was essentially the same in the base and in the top of the pillar.
Figure 7—Curves showing cumulative decrease in measurements between pillars, in feet, Hutchinson mine. A. Maximum (12a) and minimum (1a) between tops of pillars. B. Maximum (11b) , intermediate (3b), and minimum (1b) between middles of pillars. C. Maximum (1c) and minimum (3c) between bottoms of pillars.
Pressure due to the overburden but modified by the percentage of salt excavated and by the configuration of the excavation caused plastic flowage of the salt. The development of the structures was the result of spreading of the pillars' by this plastic flow and of movement along the lubricating underlying shale layer. Thickness of the salt left in the floor and rate at which the area was mined determined the size and shape of the structures that developed.
The variation in rate of plastic flowage in the pillars is due to the mining plan. The rate of movement was rapid at first and then tapered off, but as a new room was opened or mining extended, forces were redistributed and more pressure was applied on the nearby pillars. The increased pressure caused the rate of plastic flow to increase again. After an area is completely mined out, plastic flowage should decrease indefinitely. A series of creep curves shows change in the rate of flow indicating a change in load as mining progressed.
Adams, F. D. (1910) An experimental investigation into the action of differential pressure on certain minerals and rocks employing the process suggested by Professor Kick: Jour. Geology, v. 18, p. 489-525.
Bailey, R. W. (1926) Note on the softening of strain-hardened metals and its relation to creep: Jour. Inst. Metals, v. 35, p. 27.
Barrett, C. S. (1943) Structure of metals: New York, McGraw-Hill Co., 567 p.
Busch, B. (1907) Etwas uber die expansivkraft des salzes: Zeitschrift Praktisch Geologie, v. 15, p. 367-371.
Dellwig, L. F. (1958) Flowage in rock salt at Lyons, Kansas: Kansas Geol. Survey Bull. 130, pt. 4, p. 165-175. [available online]
Dellwig, L. F., and Snyder, J. D. (1959) Plastic flow in Hutchinson salt member in mines at Lyons, Kansas: Guidebook, 24th Field Conference, Kansas Geol. Soc., p. 35-41.
Griggs, D. T. (1939) Creep of rock: Jour. Geology, v. 47, p. 225-251.
Griggs, D. T. (1940) Experimental flow of rocks: Geol. Soc. America Bull., v. 51, p. 1001- 1022.
Gunte, R, B. D., and Parker, F. L. (1961) The physical properties of rock salt as influenced by gamma rays: Oak Ridge National Laboratory, 71 p.
Kanter, J. J. (1956) Interpretation and use of creep results: Amer. Soc. Metals, Trans. , v. 24, p. 870.
Nadai, Arpad (1931) Plasticity, a mechanics of the plastic state of matter: New York, McGraw-Hill Co., 349 p.
Rinne, F. (1904) Plastiche umformung von steinsalz und sylvin uter allseitigem druck: Neues Jahrb. Mineralogie, Abh., v.l, p. 114-122.
Rotherham, L. A. (1951) Creep of metals: London, Inst. of Physics, 80 p.
Stamatiu, M. (1936) Quelques remarques sur la plasticité du sel gemme: Societe Roumaine de Geologie Bull., v. 3, p. 143-159.
Stamatiu, M. (1937) New data on some physical and mechanical properties of rock salt: Bull. Sect. Sci. Acad. Roumaine, v. 18, p. 41-51.
Stanford, E. G. (1949) The creep of metal and alloys: London, Temple Press Ltd., 162 p.
Taylor, G. I., and Quinney, H. (1934) The latent energy remaining in a metal after cold working: Royal Soc. Proc., ser. A., v.143, p. 307-326.
Kansas Geological Survey
Placed on web Dec. 11, 2018; originally published Sept. 15, 1961.
Comments to webadmin@kgs.ku.edu
The URL for this page is http://www.kgs.ku.edu/Publications/Bulletins/152_2/index.html