Kansas Geological Survey, Bulletin 142, pt. 6, originally published in 1960
Originally published in 19660 as Kansas Geological Survey Bulletin 142, pt. 6. This is, in general, the original text as published. The information has not been updated. An Acrobat PDF version (6.9 MB) is also available.
Mineral production in Kansas in 1959 exceeded $500,000,000 for the fourth consecutive year. Total value of all minerals produced or processed in the state was $524,634,619, an increase of 2.6 percent from 1958. Of the total, $442,788,460 or 84.39 percent came from sale of mineral fuels and associated products, $81,501,619 or 15.54 percent was contributed by the nonmetals excluding mineral fuels, and $344,540 or 0.65 percent by the metals. Production and value of coal, helium, natural gasoline, LP gases, oil or petroleum, and zinc in 1959 were each less than in 1958; all other mineral commodities showed increases.
Again 3 of the 105 counties in Kansas reported no mineral production in 1959; Mitchell County joined the producing counties but Ottawa County reported no mineral production in 1959. Oil, gas, or both were produced in 82 counties, sand and gravel in at least 71 counties, and stone in 41 counties. In 1959 each of 59 counties, 5 more than in 1958, produced minerals worth $1,000,000 or more. Barton County again led in the value of mineral production ($34,775,252), followed by Ellis County ($33,391,076) and Russell County ($27,216,157). Butler, Grant, and Graham Counties also each produced minerals worth more than $20,000,000. In the $10,000,000 to $20,000,000 category were 13 counties, one more than in 1958. Only seven of the counties producing $1,000,000 or more in mineral wealth in 1959 produced mainly nonfuel minerals, and six of these are in eastern Kansas. The counties that produced the greatest dollar value of minerals are those in which oil is found, mainly western Kansas counties, although Allen, Butler, and Greenwood Counties, all in eastern Kansas, are included in the list. Counties that exploited the most different minerals were Cherokee and Reno, seven minerals each, and Barber, Grant, Kearny, Kingman, and Sedgwick, six minerals each. The minerals that led in value were oil, natural gas, portland cement, stone, salt, clay and clay products, carbon black, butane, and coal. This report gives the amount and value of all minerals produced in the state in 1959 and compares them with 1958 statistics, and it also includes directories of mineral producers on record as of December 31, 1959. A brief summary of mineral production, value, and trends in Kansas for the 1950-59 decade concludes the report.
Mineral production in Kansas in 1959 exceeded $500,000,000 for the fourth consecutive year. Total value of all minerals produced or processed in the state was $524,634,619 or $10,400,174 more than in 1958, an increase of 2.6 percent. Since 1932 Kansas has ranked among the first ten states in the value of mineral commodities produced annually. Within the state 22 minerals are produced commercially, 5 others are available but currently are not exploited, at least 6 others are known to occur but have not been studied sufficiently to determine their commercial possibilities, and at least 2 minerals are processed into useful mineral commodities from raw materials shipped into the state. Table 1 presents data on mineral production in Kansas for 1958 arid 1959, together with the 1959 rank of each mineral with respect to the other minerals produced in the state.
Table 1—Quantity and value of Kansas mineral production, by commodities, 1958 and 1959.
| Commodity | Unit | 1958 | 1959 | 1959 Rank |
|||
|---|---|---|---|---|---|---|---|
| Quantity | Value ($) | Quantity | Value ($) | ||||
| Carbon black | Pound | 75,443,750 | 5,261,142 | 91,644,160 | 6,387,598 | 8 | |
| Cement (masonry) | 376-lb. bbl. | 320,270 | 1,204,594 | 349,265 | 1,393,350 | 14 | |
| Cement (natural) | 376-lb. bbl. | * | * | * | * | 19 | |
| Cement (portland) | 376-lb. bbl. | 9,298,427 | 28,843,139 | 10,055,944 | 30,889,337 | 3 | |
| Clay (raw) | Short ton | 875,441 | 1,144,983 | 1,020,560 | 1,270,341 | 16 | |
| Clay and clay products | Short ton | 10,500,000 | 11,500,000 | 6 | |||
| Coal | Short ton | 830,329 | 3,818,042 | 774,360 | 3,491,700 | 10 | |
| Diatomaceous marl | Short ton | * | * | * | * | 24 | |
| Gypsum (crude) | Short ton | * | * | * | * | 15 | |
| Helium-shipments | Cu. ft. | 27,888,000 | 432,264 | 21,642,500 | 342,619 | 17 | |
| Lead (recoverable content of ores) | Short ton | 1,299 | 303,966 | 481 | 110,630 | 20 | |
| Natural gas | M cu. ft | 535,937,434 | 58,953,118 | 595,244,836 | 65,476,932 | 2 | |
| Natural gas liquids | |||||||
| Butane | 42-gal. bbl. | 993,269 | 1,539,567 | 1,507,175 | 3,112,280 | 12 | |
| Natural gasoline | 42-gal. bbl. | 2,600,607 | 6,007,402 | 2,554,365 | 5,900,583 | 9 | |
| LPG | 42-gal. bbl. | 404,027 | 626,242 | 55,848 | 86,564 | 21 | |
| Propane | 42-gal. bbl. | 1,363,436 | 2,113,326 | 1,426,595 | 3,152,775 | 11 | |
| Perlitea | Short ton | * | * | * | * | 23 | |
| Petroleum (crude) | 42-gal. bbl. | 119,942,094 | 362,225,124 | 119,473,875 | 354,837,409 | 1 | |
| Pumicite (volcanic ash) | Short ton | * | * | * | * | 26 | |
| Salt (brine) | Short ton | * | * | * | * | 13 | |
| Salt (common) | Short ton | 867,924 | 9,827,759 | 899,252 | 11,687,446 | 5 | |
| Sand and gravel | Short ton | 10,578,668 | 7,044,966 | 11,334,128 | 7,937,205 | 7 | |
| Sandstone (dimension) | Short ton | * | * | * | * | 25 | |
| Stone (limestone, sandstone, chat) | Short ton | 12,505,060 | 15,039,3850 | 13,987,952 | 17,072,506 | 4 | |
| Vermiculitea | Short ton | * | * | * | * | 22 | |
| Zinc (recoverable content of ores, etc.) | Short ton | 4,421 | 901,884 | 1,017 | 233,910 | 18 | |
| * Undistributed | 2,056,660 | 4,152,905 | |||||
| Total value | $514,234,445" | $524,634,619b | |||||
| (a) Minerals processed but not mined in Kansas. (b) Totals adjusted to eliminate duplication in the value of clays and stone. (c) Excludes sandstone, value of which is included under "Undistributed". * Quantity and value of individual commodities cannot be revealed. |
|||||||
Minerals are widely distributed in the state; oil, gas, or both were produced in 82 counties, 4 more than in the previous year; sand and gravel were obtained in at least 71 counties instead of 70 as in 1958; and stone in 41 counties, 5 fewer than in 1958. Coal is being mined in 7 eastern counties. Salt and gypsum, known to underlie at least 40 central and southwestern counties, are currently being produced in only 6 counties.
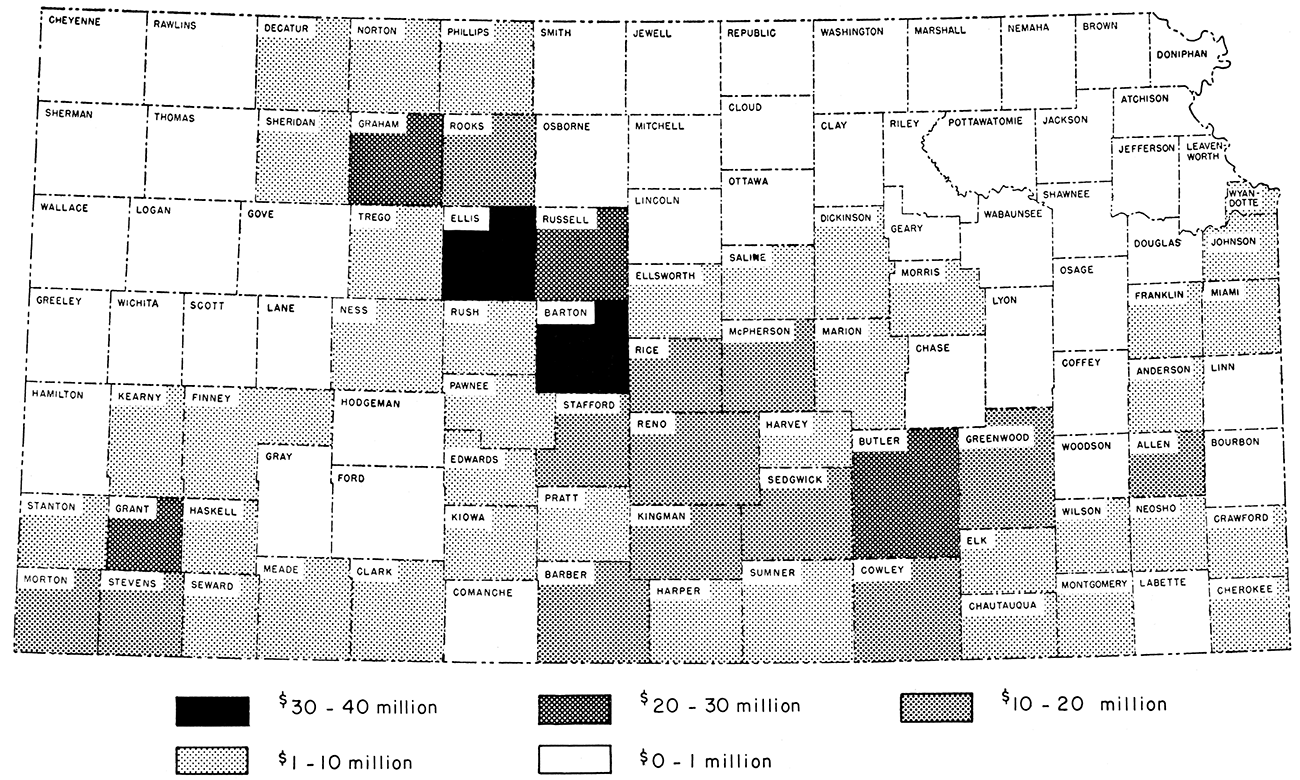
Of the 105 counties in Kansas, all but 3 (Greeley, Lane, and Ottawa) reported mineral production in 1959, the same as in 1958. In 1958, however, Mitchell County was one of the three nonproducing counties, rather than Ottawa County. In 1959, each of 59 counties, 5 more than in 1958, produced minerals worth $1,000,000 or more. Barton County, as in previous years, led with $34,775,252, followed by Ellis County with $33,391,076. Russell County ($27,216,157) again was third, and was followed by Butler County ($23,808,817), Grant County ($21,484,291), and Graham County (somewhat more than $20,460,398) in the $20,000,000 to $30,000,000 category. Counties producing in 1959 mineral wealth valued between $10,000,000 and $20,000,000 were in order of rank Greenwood, Stafford, Rooks, Rice, Morton, Sedgwick, Reno, Allen, Cowley, Barber, Kingman, Stevens, and McPherson. Table 2 summarizes the range of value of the 1958 and 1959 mineral production per county.
Table 2—Range of value of 1958 and 1959 mineral production per county
| Value of annual production, millions of dollars |
Number of counties producing minerals valued in this range |
|
|---|---|---|
| 1958 | 1959 | |
| 20-30 | 3 | 4 |
| 10-20 | 13 | 14 |
| 1-10 | 36 | 39 |
| 0- 1 | 48 | 43 |
| No production | 3 | 3 |
Counties that produced the greatest dollar value of minerals ($10,000,000 or more) are those in which oil is found. Most of these are western counties, but Allen, Butler, and Greenwood, all eastern counties, are included. Seven of the 59 counties producing $1,000,000 or more in mineral wealth in 1959 produced mainly nonfuel minerals, and six of these are eastern counties, Allen, Dickinson, Johnson, Montgomery, Neosho, and Wyandotte; Reno is the only western county. Elk and Wilson Counties' mineral wealth is about equally divided between fuel and nonfuel minerals. Counties that exploited the most different minerals were Cherokee and Reno (seven minerals) and Barber, Grant, Kearny, Kingman, and Sedgwick (six each); of these only Cherokee produced no oil (Fig. 1). A summary evaluation of mineral fuels and nonfuel minerals for Kansas counties in 1959 is presented in Table 3 and Figure 2.
Figure 1—Map of Kansas showing mineral commodities produced in each county in 1959. Minerals are listed in order of value within counties. Bu—butane. C—cement. CB—carbon black. Cl—clay. Co—coal. Dm—diatomaceous marl. G—natural gas. Gp—gypsum. H—helium. LP—liquefied petroleum gases. NC—natural cement. NG—natural gasoline. O—Oil. P—pumicite or volcanic ash. Ph—lead. Pe—perlite. Pr—propane. S—salt. SG—sand and gravel. St—stone. Zn—zinc.
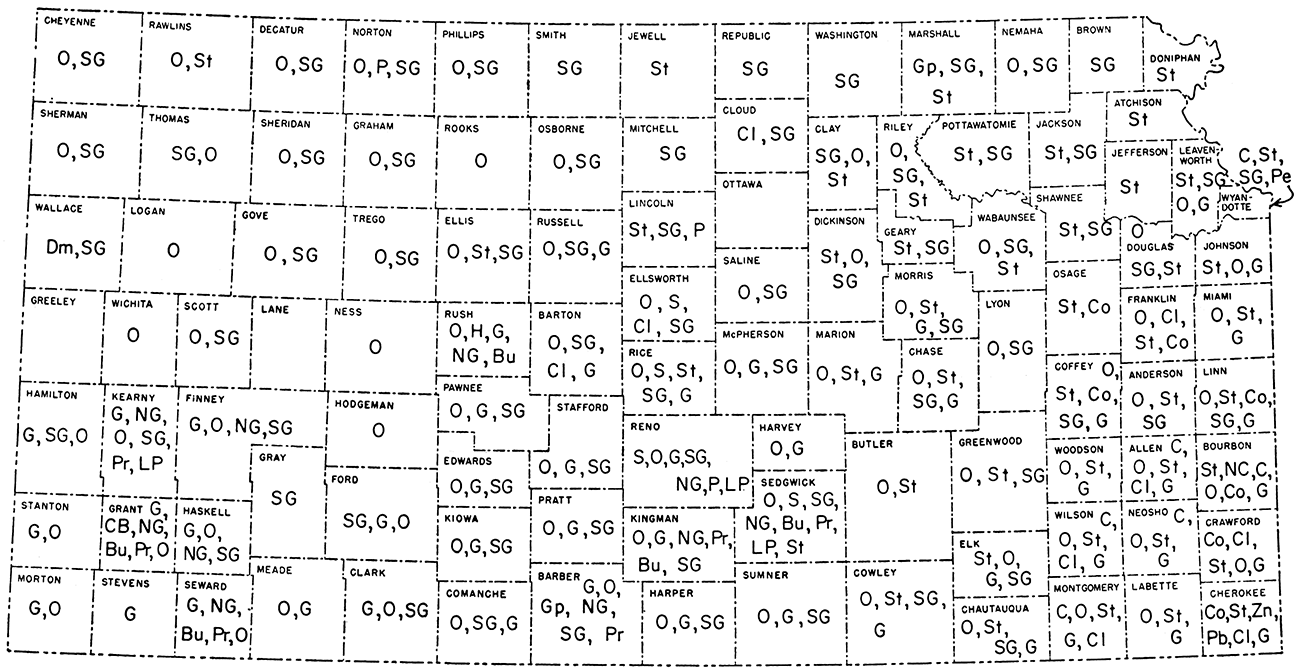
Table 3—Value of mineral production in Kansas, by county, in 1959
| County | Value of mineral production | Commoditiesb in order of decreasing value |
||
|---|---|---|---|---|
| Fuelsb ($) |
Nonfuels ($) |
Total ($) |
||
| Allen | 2,685,404 | 10,075,562 | 12,760,966 | C, O, St, Cl, G |
| Anderson | 1,352,881 | 75,638 | 1,428,519 | O, St, SG |
| Atchison | 330,563 | 330,563 | St | |
| Barber | 11,057,807 | * | * | G, O, Gp, NG, Pr, SG |
| Barton | 34,440,153 | 335,099 | 34,775,252 | O, SG, Cl, G |
| Bourbon | 98,998 | 657,386 | 756,384 | St, NC, C, O, Co, G |
| Brown | * | * | SG | |
| Butler | 23,550,217 | 258,600 | 23,808,817 | O, St |
| Chase | 340,653 | * | * | O, St, SG, G |
| Chautauqua | 2,719,744 | 124,125 | 2,843,869 | O, St, G, SG |
| Cherokee | 2,178,621 | 625,742 | 2,804,363 | Co, St, Zn, Pb, Cl, SG, G |
| Cheyenne | 45,926 | 13,210 | 59,136 | O, SG |
| Clark | 1,343,206 | 18,750 | 1,361,956 | G,O, SG |
| Clay | 43,371 | 114,869 | 158,240 | SG, O, St |
| Cloud | 285,564 | 285,564 | Cl, SG | |
| Coffey | 300,870 | 62,069 | 362,939 | O, St, Co, SG, G |
| Comanche | 81,938 | 7,687 | 89,625 | O, SG, G |
| Cowley | 11,759,169 | 660,469 | 12,419,638 | O, St, SG, G |
| Crawford | 1,346,317 | * | * | Co, Cl, O, St, G |
| Decatur | 1,089,526 | 20,616 | 1,110,142 | O, SG |
| Dickinson | 224,381 | 1,108,891 | 1,333,272 | St, O, SG |
| Doniphan | 342,222 | 342,222 | St | |
| Douglas | 73,396 | 60,381 | 133,777 | O, SG, St |
| Edwards | 2,217,211 | 6,260 | 2,223,471 | O,G , SG |
| Elk | 774,661 | * | * | St, O, G, SG |
| Ellis | 33,331,282 | 59,794 | 33,391,076 | O, St, SG |
| Ellsworth | 6,428,754 | 1,025,833 | 7,454,587 | O, S, Cl, SG |
| Finney | 8,495,291 | 44,331 | 8,539,622 | G, O, NG, SG |
| Ford | 34,565 | 98,750 | 133,315 | SG, G, O |
| Franklin | 816,162 | 223,302 | 1,039,464 | O, Cl, St, Co |
| Geary | 642,357 | 642,357 | St, SG | |
| Gove | 38,212 | 11,234 | 49,446 | O, SG |
| Graham | 20,460,398 | * | * | O, SG |
| Grant | 21,484,291 | 21,484,291 | G, CB, NG, Bu, Pr, O | |
| Gray | * | * | SG | |
| Greeley | ||||
| Greenwood | 17,592,074 | 151,332 | 17,743,406 | O, St, SG |
| Hamilton | 515,737 | 47,874 | 563,611 | G, SG, O |
| Harper | 4,057,045 | 23,027 | 4,080,072 | O, G, SG |
| Harvey | 1,173,180 | 1,173,180 | O, G | |
| Haskell | 5,862,397 | * | * | G, O, NG, SG |
| Hodgeman | 892,162 | 892,162 | O | |
| Jackson | 98,747 | 98,747 | St, SG | |
| Jefferson | 486,750 | 486,750 | St | |
| Jewell | * | * | St | |
| Johnson | 15,382 | 993,047 | 1,008,429 | St, O, G |
| Kearny | 8,410,568 | 40,692 | 8,451,260 | G, NG, O, SG, Pr, LP |
| Kingman | 11,510,222 | * | * | O, G, NG, Pr, Bu, SG |
| Kiowa | 2,758,238 | 30,145 | 2,788,383 | O, G, SG |
| Labette | 324,930 | * | * | O, St, G |
| Lane | ||||
| Leavenworth | 5,855 | 573,562 | 579,417 | St, SG, 0, G |
| Lincoln | 503,665 | 503,665 | St, SG, P | |
| Linn | 202,901 | 172,161 | 375,062 | O, St, Co, SG, G |
| Logan | 1,936 | 1,936 | O | |
| Lyon | 544,200 | * | * | O, SG |
| McPherson | 11,111,669 | 1,284 | 11,112,953 | O, G, SG |
| Marion | 9,415,983 | * | * | O, St, G |
| Marshall | 720,076 | 720,076 | Gp, SG, St | |
| Meade | 4,577,437 | 4,577,437 | O,G | |
| Miami | 1,353,106 | 269,548 | 1,622,654 | O, St, G |
| Mitchell | 7,371 | 7,371 | SG | |
| Montgomery | 1,507,265 | 5,649,708 | 7,156,973 | C, O, St, G, Cl |
| Morris | 1,135,745 | 86,931 | 1,222,676 | O, St, G, SG |
| Morton | 14,013,585 | 14,013,585 | G, O | |
| Nemaha | 34,559 | 7,081 | 41,640 | O, SG |
| Neosho | 1,438,487 | 6,773,059 | 8,211,546 | C, O, St, G |
| Ness | 1,718,228 | 1,718,228 | O | |
| Norton | 2,460,120 | * | O, P, SG | |
| Osage | 29,475 | 114,400 | 143,875 | St, Co |
| Osborne | 216,947 | 16,800 | 233,747 | O, SG |
| Ottawa | ||||
| Pawnee | 5,296,874 | 81,082 | 5,377,956 | O, G, SG |
| Phillips | 5,640,516 | 165,145 | 5,805,661 | O, SG |
| Pottawatomie | 93,838 | 93,838 | St, SG | |
| Pratt | 7,248,693 | 13,520 | 7,262,213 | O,G,SG |
| Rawlins | 247,047 | 473 | 247,520 | O, St |
| Reno | 3,729,186 | 9,074,433 | 12,803,619 | S, O, G, SG, NG, P, LP |
| Republic | * | * | SG | |
| Rice | 14,205,842 | 2,466,875 | 16,672,717 | O, S, St, SG, G |
| Riley | 165,455 | 104,636 | 270,091 | O, SG, St |
| Rooks | 17,289,128 | 17,289,128 | O | |
| Rush | 1,804,778 | 1,804,778 | O, H, G, NG, Bu | |
| Russell | 26,736,907 | 479,250 | 27,216,157 | O, SG, G |
| Saline | 1,769,047 | * | * | O, SG |
| Scott | 101,903 | 6,613 | 108,516 | O, SG |
| Sedgwick | 10,668,902 | 3,159,978 | 13,828,880 | O, S, SG, NG, Bu,Pr, V |
| Seward | 4,882,257 | 4,882,257 | G, NG, Bu, Pr, O | |
| Shawnee | 930,957 | 930,957 | St, SG | |
| Sheridan | 1,611,544 | 19,200 | 1,630,744 | O, SG |
| Sherman | 381,748 | 93,904 | 475,652 | O, SG |
| Smith | 7,650 | 7,650 | SG | |
| Stafford | 17,565,372 | * | * | O, G, SG |
| Stanton | 2,662,177 | 2,662,177 | G,O | |
| Stevens | 11,382,711 | 11,382,711 | G | |
| Sumner | 8,830,761 | 64,343 | 8,895,104 | O, G, SG |
| Thomas | 5,411 | 72,630 | 78,041 | SG, O |
| Trego | 5,325,512 | " | " | O, SG |
| Wabaunsee | 689,067 | 27,813 | 716,880 | O, SG, St |
| Wallace | * | * | Dm, SG | |
| Washington | 138,965 | 138,965 | SG | |
| Wichita | 644 | 644 | O | |
| Wilson | 578,459 | 5,658,715 | 6,237,174 | C, O, St, Cl, G |
| Woodson | 2,227,371 | 66,500 | 2,293,871 | O, St, G |
| Wyandotte | 8,911,196 | 8,911,196 | C, St, SG, Pe | |
| Unassigned | 48,310 | 11,820,476 | 11,868,786 | Cl prod., St, SG |
| Undistributed | 4,331,403 | 93,089,022 | ||
| Kansas total | $442,788,460 | $81,846,159c | $524,634,619c | |
| * Undistributed values may not be revealed. (a) The new minimum price of 11 cents per 1000 cubic feet of natural gas measured at 14.65 psia (pounds per square inch absolute) established by the Kansas Corporation Commission for the Hugoton Gas Area has been applied to all Kansas gas production, including minor amounts of unprorated production, much of which probably brought a higher price. (b) Commodities: B, brine; Bu, butane; C, cement; CB, carbon black; Cl, clay; Co, coal; Dm, diatomaceous marl; G, natural gas; Gp, gypsum; H, helium; LP, liquefied petroleum gases; NC, natural cement; NG, natural gasoline; O, oil; P, pumicite (volcanic ash); Pb, lead; Pe, perlite; Pr, propane; S, salt; SG, sand and gravel; St, stone; V, vermiculite; Zn, zinc. (c) Adjusted to eliminate duplication in value of clays and stone. |
||||
Figure 2—Map of Kansas showing range of value of 1959 mineral production by county.
The mineral fuels—coal, oil, natural gas, the natural gas liquids, and related products (helium and carbon black)—contributed, as in former years, the greatest share to the mineral wealth produced in Kansas. In 1959 it amounted to 84.4 percent of the total value ($442,788,460) as compared to 85.7 percent ($440,976,227) in 1958 (Table 4, Fig. 3).
Figure 3—Percent and value of mineral production in Kansas, 1959.
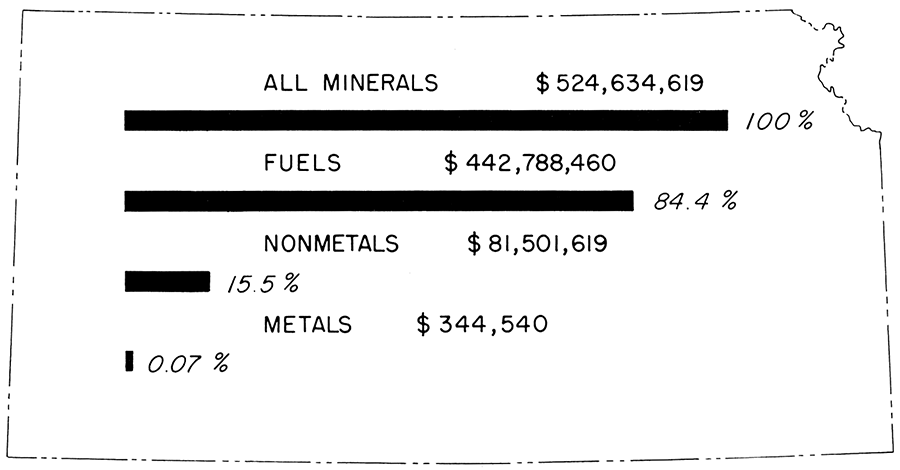
Table 4—Value of minerals produced in Kansas in 1958 and 1959
| Year | Mineral fuels and associated products |
Percent of total |
Nonmetals (excluding mineral fuels) |
Percent of total |
Metals | Percent of total |
All minerals |
|---|---|---|---|---|---|---|---|
| 1958 | $440,976,227 | 85.7 | $72,052,368 | 14.0 | $1,205,850 | 0.3 | $514,234,445 |
| 1959 | $442,788,460 | 84.39 | $81,501,619 | 15.54 | $344,540 | 0.07 | $524,634,619 |
Coal production in Kansas in 1959 amounted to 774,360 tons, of which 768,632 tons or 99.2 percent was mined by stripping and 5,728 tons or 0.8 percent was deep or shaft mined. Although coal tonnage in 1959 was 7.4 percent less than the 1958 production of 830,009 tons, it was greater by 19,921 tons than in 1957, and 35,274 tons more than in 1955. Compared to the annual average of 1,312,229 tons of coal produced in the 1950-59 decade, however, coal production in 1959 was 537,869 tons or 40.9 percent less (Fig. 6). The coal mined in 1959 was worth $3,491,700. In 1959 only 19 mines were in operation, 10 fewer than in the previous year. The 1950-59 decade saw a steady decline in the number of coal mines, both strip and shaft, in operation. In 1950, coal was mined in 52 strip mines and 32 shaft mines in Kansas, whereas at the end of the decade only 17 strip mines and 2 shaft mines were operating. Likewise the number of persons employed in the mines has decreased sharply from 1,261 at the beginning of the decade to 338 in 1959.
In 1959, seven counties produced coal in Kansas. Of these, Cherokee County, which produced 484,096 tons valued at $2,178,432, was foremost, as it has been since 1953. Next in importance was Crawford County, followed by Osage, Bourbon, Coffey, Linn, and Franklin Counties. Labette County ceased production in 1958. Production, value, and number of mines in 1959 are presented, by county, in Table 5.
Table 5—Kansas coal production by type of mine and by county, value of coal, rank of counties, and number of mines, 1958 and 1959
| County | 1958 | 1959 | Rank | Number of mines, 1959 |
||||||||
|---|---|---|---|---|---|---|---|---|---|---|---|---|
| Production, short tons | Value ($) | Production, short tons | Value ($) | |||||||||
| Strip | Deep | Total | Strip | Deep | Total | 1958 | 1959 | Strip | Deep | |||
| Bourbon | 4,810 | 4,810 | 22,226 | 4,551 | 4,551 | 22,755 | 4 | 4 | 2 | |||
| Cherokee | 529,185 | 529,185 | 2,434,251 | 484,096 | 484,096 | 2,178,432 | 1 | 1 | 4 | |||
| Coffey | 2,138 | 2,138 | 9,935 | 2,230 | 2,230 | 11,150 | 5 | 5 | 1 | |||
| Crawford | 279,756 | 6,155 | 285,911 | 1,315,191 | 273,344 | 2,784 | 276,128 | 1,242,576 | 2 | 2 | 5 | 1 |
| Franklin | 195 | 195 | 897 | 157 | 157 | 785 | 7 | 7 | 1 | |||
| Linn | 1,157 | 1,157 | 5,322 | 1,303 | 1,303 | 6,515 | 6 | 6 | 2 | |||
| Osage | 3,088 | 3,525 | 6,613 | 30,420 | 2,951 | 2,944 | 5,895 | 29,475 | 3 | 3 | 2 | 1 |
| All counties | 820,329 | 9,680 | 830,009 | $3,818,042 | 768,632 | 5,728 | 774,360 | $3,491,688 | 17 | 2 | ||
The 1950-59 decade was a period of great variation in coal production in Kansas. Production in everyone of the eight coal producing counties declined greatly. Cherokee County, which has held first place in production since 1953, had the least decline, 26.3 percent; Crawford County, which ranked second, had a decrease of 84.9 percent, but even this was not as great as the production decline in Linn County (99.7 percent) or in Labette County, which in 1958 ceased coal mining operations entirely.
As in former years the Pittsburg-Midway, Clemens, and Apex-Compton coal companies produced approximately 90 percent of the total coal output, 774,360 tons; Pittsburg-Midway Company produced more than half. The Blue Ribbon Coal Company of Crawford County and Bell mine in Osage County were the only shaft mines in operation in 1959.
Measured and indicated coal reserves in Kansas at the end of 1959 are estimated at 1,115,500,000 tons, of which approximately 836,500,000 tons is believed to be recoverable coal.
Coal companies operating in Kansas on record as of December 31, 1959, are listed in Table 6.
Table 6—Directory of Kansas coal mining companies on record as of December 31, 1959
| County | Coal company | Office address |
|---|---|---|
| Bourbon | Garrett | Route 2, Garland |
| Bourbon | Pellett | Route 5, Fort Scott |
| Cherokee | Black Diamond | Weir |
| Cherokee | Pittsburg-Midway Coal Mining |
P. O. Box 269, Pittsburg |
| Cherokee | S&M | Route 1, Scammon |
| Cherokee | Wilkinson | Weir |
| Coffey | S. L. Rogers | Lebo |
| Crawford | Apex-Compton | P. O. Box 211, Pittsburg |
| Crawford | Blue Ribbon | Girard |
| Crawford | Cliff Carr | Route 1, Mulberry |
| Crawford | Clemens | P. O. Box 299, Pittsburg |
| Crawford | Davis | Cherokee |
| Crawford | Palmer & Son | Mulberry |
| Crawford | Wisdom | Pittsburg |
| Crawford | Wisdom Excavating Co. | 805 N. Rouse St., Pittsburg |
| Franklin | McGrath-O'Dea | Homewood |
| Linn | Fyock | Prescott |
| Linn | Wood | Route 1, Pleasanton |
| Osage | Bell | Burlingame |
| Osage | Graham | Reading |
| Osage | Johnson | Scranton |
Crude oil production in Kansas in 1959 amounted to 119,473,875 bbl. or 468,219 bbl. less than in 1958, a decline of 0.4 percent. Of the total oil produced, approximately 15 percent or 17.9 million barrels was obtained by secondary recovery methods. The value was $354,837,409 as compared to $362,225,124 in 1958. The 2 percent change in value is attributed both to decreased production and to decrease in average price from $3.02 a barrel to $2.97 (Table 7). For the first time in many years Kansas ranked sixth instead of fifth among the oil producing states, although oil still ranked first among the mineral commodities produced in the state (Table 1) .
Table 7—Crude oil production, value, and reserves, and number of oil fields named and revived in Kansas, 1958 and 1959
| 1958 | 1959 | Percent change from 1958 |
||
|---|---|---|---|---|
| Production, bbl. | 119,942,094a | 119,473,875a | -0.4 | |
| Value | $362,225,124 | $354,837,409 | -2.0 | |
| Price per bbl. | $3.02 | $2.97 | ||
| Reserves, million bbl. | 922.4 | 917.5 | -0.5 | |
| Oil fields: | ||||
| Named | 141b | 159c | ||
| Revived | 8 | 8c | ||
| (a) Figures supplied by State Corporation Commission, Conservation Division. (b) Five fields produced both oil and gas. (c) Two fields produced both oil and gas. |
||||
Since records of oil production in the state have been kept, Kansas has produced to the end of 1959 a recorded cumulative total of at least 3,130 million barrels of crude oil valued at $6,350,000,000. Of this cumulative amount nearly 1,177,500,000 bbl. of oil or slightly more than 37 percent was produced in the 1950-59 decade. This oil was valued at approximately $3,294,500,000 or slightly more than 51 percent of the total value of all oil produced in the state in the 70 years since 1889 (Table 35). Annual production of oil in Kansas since 1950 has exceeded 100,000,000 bbl. and the value has exceeded $275,000,000.
The number of counties actually reporting production of oil was 80, four more than in 1958. Among the ten leading oil producing counties, Barton, Ellis, Russell, Butler, and Graham Counties maintained the first five places respectively as in 1958. Greenwood County, which in 1958 ranked sixth, dropped to eighth place in 1959, and Rooks and Stafford Counties, which ranked seventh and eighth respectively in 1958, advanced to sixth and seventh places respectively in 1959 (Table 8).
Table 8—Ten leading oil producing counties in Kansas, 1958 and 1959
| County | Production, bbl. | Rank | ||
|---|---|---|---|---|
| 1958 | 1959 | 1958 | 1959 | |
| Barton | 11,546,500 | 11,404,683 | 1 | 1 |
| Ellis | 11,314,968 | 11,222,654 | 2 | 2 |
| Russell | 9,005,985 | 8,922,064 | 3 | 3 |
| Butler | 7,714,554 | 7,929,366 | 4 | 4 |
| Graham | 6,800,352 | 6,889,023 | 5 | 5 |
| Rooks | 6,389,441 | 6,066,361 | 7 | 6 |
| Stafford | 5,887,005 | 5,845,204 | 8 | 7 |
| Greenwood | 6,466,719 | 5,844,543 | 6 | 8 |
| Rice | 5,314,385 | 4,666,987 | 9 | 9 |
| Cowley | 4,171,897 | 3,858,450 | 10 | 10 |
Fifteen counties had a recorded and estimated cumulative production of 50 million barrels or more of oil at the end of 1959 (Table 9). Of these, Butler County, in eastern Kansas, ranked first, having produced 437,516,367 bbl. of oil or 105,326,169 bbl. more than second-place Barton County and 131,062,212 bbl. more than Russell County, third in rank.
Table 9—Leading oil producing counties in Kansas based upon reported, estimated, and recorded cumulative production to end of 1959
| County | Cumulative production, bbl. | Rank | ||
|---|---|---|---|---|
| 1958 | 1959 | 1958 | 1959 | |
| Butler | 429,587,001 | 437,516,367 | 1 | 1 |
| Barton | 320,785,515* | 332,190,198 | 2 | 2 |
| Russell | 297,532,091 | 306,454,155 | 3 | 3 |
| Greenwood | 223,042,369 | 228,886,912 | 4 | 4 |
| Ellis | 215,675,431 | 226,888,085* | 6 | 5 |
| Rice | 221,189,082 | 225,856,069* | 5 | 6 |
| McPherson | 144,568,785* | 148,269,306* | 7 | 7 |
| Stafford | 132,617,382* | 138,426,185* | 8 | 8 |
| Cowley | 96,488,132 | 100,346,582 | 9 | 9 |
| Ellsworth | 91,774,706 | 93,924,791 | 10 | 10 |
| Rooks | 80,471,282* | 86,537,643 | 11 | 11 |
| Sumner | 70,001,482* | 72,893,539 | 12 | 12 |
| Sedgwick | 67,726,683 | 70,479,157 | 13 | 13 |
| Reno | 62,893,875 | 63,896,384 | 14 | 14 |
| Graham | 50,555,688 | 57,444,711 | 15 | 15 |
| * Corrected cumulative. | ||||
Most of the larger oil fields are in western Kansas (Table 10). Of the six major oil fields, only the El Dorado field in Butler County lies east of the Sixth Principal Meridian, which is the division line between eastern and western Kansas insofar as oil and gas are concerned. Of the six leading oil fields, the El Dorado and Chase-Silica fields had increases in annual production in 1959; the Chase-Silica field advanced from fifth rank to third, exchanging positions with the Trapp field.
Table 10—Leading oil fields in Kansas, 1958 and 1959
| Field | Rank | County | Annual production, bbl. | ||
|---|---|---|---|---|---|
| 1958 | 1959 | 1958 | 1959 | ||
| Bemis-Shutts | 1 | 1 | Ellis-Rooks | 5,062,516 | 4,867,675 |
| El Dorado | 2 | 2 | Butler | 4,370,959 | 4,443,182 |
| Chase-Silica | 5 | 3 | Rice-Barton-Stafford | 3,259,898 | 3,689,358 |
| Hall-Gurney | 4 | 4 | Russell- Barton | 3,295,576 | 3,253,461 |
| Trapp | 3 | 5 | Russell- Barton | 3,365,752 | 3,120,143 |
| Kraft-Prusa | 6 | 6 | Barton-Ellsworth | 3,092,206 | 2,889,685 |
In keeping with the trend of recent years, Kansas in 1959 continued to consume a greater percentage of its annual oil production. In 1954 Kansas consumed 74.6 percent of its annual oil production whereas in 1959 it consumed 92.1 percent, 4.6 percent more than in 1958 (Table 11). Imports of oil in 1959 were 41,884,138 bbl. as compared to 37,895,812 bbl. in 1958, an increase of 10.5 percent. Exports were less, however, in 1959 than in 1958 by 1,472,113 bbl. or 2.8 percent. Total quantity of oil accounted for in 1959 was 161,358,014 bbl. compared to 157,837,906 bbl. in 1958. Data on production, consumption, imports, exports, and total quantity of oil accounted for in 1958 and 1959 are listed in Table 11. During the 1950-59 decade consumption and imports steadily increased. Production increased to a maximum of nearly 124,500,000 bbl. in 1956 and has since declined; exports have fluctuated between about 49,700,000 and 58,700,000 bbl. Figure 6 shows the trends of oil production and value over the decade.
Table 11—Production, consumption, imports, and exports of crude oil in Kansas, 1958 and 1959*, in bbl.
| Year | Production | Consumption | Imports | Exports | Total quantity, production plus imports |
|
|---|---|---|---|---|---|---|
| Quantity | Percent of production |
|||||
| 1958 | 119,942,094 | 105,107,743 | 87.6 | 37,895,812 | 52,730,163 | 157,837,906 |
| 1959 | 119,473,875 | 110,099,964 | 92.2 | 41,884,139 | 51,258,050 | 161,358,014 |
| * From Conservation Division, State Corporation Commission. | ||||||
Crude oil reserves in 1959 are estimated at 917,500,000 bbl. or 0.5 percent less than in 1958 (Table 7). Crude oil reserves have gradually declined since 1955 although the total number of new oil fields has in general increased. In 1959, 198 new oil and gas fields excluding 8 revived fields were named; 153 were oil fields, 39 gas fields, 1 an oil and gas field, and 5 fields later abandoned. Counties in which new oil fields were named in 1959 are listed in Table 12.
Table 12—Number of oil and gas fields named and revived, by county, in 1959
| County | New | Revived | Total | ||||||
|---|---|---|---|---|---|---|---|---|---|
| Oil | Gas | Oil and gas |
Dry and abandoned |
Oil | Gas | Oil and gas |
Dry and abandoned |
||
| Barber | 2 | 2 | 1 | 5 | |||||
| Barton | 18 | 1 | 19 | ||||||
| Butler | 6 | 1 | 7 | ||||||
| Chase | 1 | 1 | |||||||
| Chautauqua | 1 | 1 | |||||||
| Cheyenne | 3 | 3 | |||||||
| Clark | 4 | 4 | |||||||
| Cowley | 7 | 1 | 8 | ||||||
| Decatur | 2 | 2 | |||||||
| Edwards | 2 | 1 | 1 | 4 | |||||
| Ellis | 16 | 1 | 17 | ||||||
| Finney | 3 | 3 | |||||||
| Geary | 1 | 1 | 2 | ||||||
| Gove | 1 | 1 | |||||||
| Graham | 9 | 9 | |||||||
| Grant | 2 | 3 | 5 | ||||||
| Greenwood | 1 | 1 | |||||||
| Hamilton | 1 | 1 | 2 | ||||||
| Harper | 1 | 1 | 2 | ||||||
| Harvey | 1 | 1 | |||||||
| Haskell | 3 | 3 | |||||||
| Hodgeman | 4 | 4 | |||||||
| Kearny | 1 | 1 | |||||||
| Kingman | 2 | 1 | 3 | ||||||
| Kiowa | 1 | 1 | |||||||
| Logan | 1 | 1 | |||||||
| McPherson | 3 | 3 | |||||||
| Marion | 4 | 1 | 5 | ||||||
| Meade | 8 | 8 | |||||||
| Morris | 1 | 1 | |||||||
| Morton | 4 | 4 | |||||||
| Ness | 2 | 2 | |||||||
| Norton | 1 | 1 | |||||||
| Pawnee | 1 | 1 | 2 | ||||||
| Phillips | 2 | 2 | |||||||
| Pratt | 2 | 1 | 3 | ||||||
| Rawlins | 4 | 4 | |||||||
| Reno | 2 | 1 | 3 | ||||||
| Rice | 2 | 2 | |||||||
| Riley | 1 | 1 | |||||||
| Rooks | 6 | 1 | 7 | ||||||
| Rush | 1 | 1 | |||||||
| Russell | 3 | 3 | |||||||
| Saline | 2 | 2 | |||||||
| Scott | 1 | 1 | |||||||
| Sedgwick | 1 | 2 | 1 | 4 | |||||
| Sheridan | 3 | 3 | |||||||
| Stafford | 10 | 2 | 1 | 2 | 15 | ||||
| Stanton | 2 | 1 | 3 | ||||||
| Stevens | 4 | 4 | |||||||
| Sumner | 9 | 9 | |||||||
| Thomas | 1 | 1 | |||||||
| Trego | 1 | 1 | |||||||
| Wabaunsee | 1 | 1 | |||||||
| Total | 153 | 39 | 1 | 5 | 5 | 0 | 2 | 1 | 206 |
During 1959, 30 miles of 8-inch oil pipeline, 45 miles of 6- and 8-inch trunk line, and 15 miles of gathering lines were connected to the Jayhawk pipeline at Harper Ranch station in Clark County, Kansas, from Oklahoma. In addition the capacity of the Jayhawk Pipeline Corp. crude line was increased by two new booster stations, one at Harper Ranch and one at Haviland in Kiowa County. The Eubank and Taloga oil fields of southwestern Kansas were connected to the Jayhawk pipeline during the year. Also a gathering line, consisting of 44 miles of 6-inch and 12 miles of 3- and 4-inch pipe, serving the Pleasant Prairie pool in Kearny County, was completed and connected to the Jayhawk Pipeline Corp. system. At Stockton, Rooks County, the Cooperative Refinery Association added 6 miles of 6-inch line to their pipeline system.
A new HF alkylation unit was put in operation at the Skelly Oil Company's refinery at El Dorado, Butler County, in 1959. At Kansas City, Wyandotte County, the Phillips Petroleum Company was constructing a 6,600-bbl. HF alkylation unit. During the year the Derby Refining Company changed its name to Derby Refining Company Division, Colorado Oil and Gas Corporation.
The Iowa Farm and Supply Company of Des Moines, Iowa, acquired the Midland Cooperative, Inc., interest in the National Cooperative Refinery Association, which operates a 30,000-bbl. refinery at McPherson, McPherson County. A directory of refineries is given in Table 13. [Note: For names of oil companies, independent operators, and consulting geologists, see Kansas Geological Society Directory published by the Society at 508 East Murdock Street. Wichita 5, and Morrison Petroleum Directory of Kansas, published annually by John H. Morrison, Box 191, Wichita.]
Table 13—Directory of petroleum refineries in Kansas as of December 31, 1959
| Refinery | Office address | County |
|---|---|---|
| American Petrofina Co. of Texas | El Dorado | Butler |
| Anderson-Prichard Oil Corp. | Arkansas City | Cowley |
| Century Refining Co., Inc.a | 114 W. Pine, Garden City | Finney |
| Cooperative Refinery Assn. | Coffeyville | Montgomery |
| Cooperative Refinery Assn. | P.O. Box 570, Phillipsburg | Phillips |
| Derby Refining Co. | 420 W. Douglas, Wichita | Sedgwick |
| Mid-America Refining Co., Inc. | Chanute | Neosho |
| Mobil Oil Co. | Augusta | Butler |
| National Cooperative Refinery Assn. |
P.O. Box 770, McPherson | McPherson |
| Phillips Petroleum Co. | 2029 Fairfax Trafficway, Kansas City |
Wyandotte |
| Skelly Oil Co. | 1401 S. Douglas Road, El Dorado |
Butler |
| Standard Oil Co. (Indiana) | 1101 Illinois, Neodesha | Wilson |
| Vickers Petroleum Co., Inc. | Wichitab | Sedgwick |
| (a) Successor to Shallow Water Refining Company, refinery at Shallow Water, Scott County. (b) Refinery at Potwin, Butler County. |
||
Table 14—Natural gas production, value, and reserves, and gas fields named and revived in Kansas, 1958 and 1959
| 1958 | 1959 | Percent change from 1958 |
||
|---|---|---|---|---|
| Production, M cu. ft. (14.65 psia) | 535,937,434 | 595,244,836 | +11.1 | |
| Value | $58,953,118 | $65,476,932 | +11.1 | |
| Reserves, million cu. ft. | 20,230,000 | 19,980,000 | -1.2 | |
| Gas fields: | ||||
| Named | 21a | 41b | ||
| Revived | 2 | 2b | ||
| (a) Five fields produced both oil and gas. (b) Two fields produced both oil and gas. |
||||
Table 15—Production and value of natural gas in Hugoton Gas Area, Kansas, 1958 and 1959
| Year | Production, M cu. ft. (14.65 psia) |
Value | Percent of state total production |
Cumulative production, M cu. ft. |
|---|---|---|---|---|
| 1958 | 349,263,723 | $38,419,009 | 65.0 | |
| 1959 | 404,764,021 | $44,524,042 | 68.0 | 5,014,481,442 |
| Percent change from 1958 |
+15.9 | +15.9 |
Natural gas was produced in 1959 in 50 counties, one more than in the previous year. Each of 18 counties, one fewer than in 1958, (Table 16), produced 2 billion cubic feet or more of gas. All except Edwards and Rush Counties produced more gas in 1959 than in 1958, although counties below 9th place in 1959 ranked somewhat differently than in 1958. Although Edwards County had produced 2,038,145 M cu. ft. of gas in 1958, it ranked 19th in 1959, producing only 1,681,798 M cu. ft. Annual gas production has exceeded 500,000,000 M cu. ft. since 1956 and 100,000,000 M cu. ft. since 1943 (Fig. 6).
Table 16—Production of natural gas in Kansas counties producing 2 billion cubic feet or more annually, 1958 and 1959
| County | Production, M cu. ft. (14.65 psia) |
Rank | ||
|---|---|---|---|---|
| 1958 | 1959 | 1958 | 1959 | |
| Stevensa | 90,231,496 | 103,479,190 | 1 | 1 |
| Granta | 76,951,008 | 90,869,682 | 3 | 2 |
| Mortona, b | 84,762,672 | 85,803,592 | 2 | 3 |
| Kearnya | 62,477,345 | 69,576,597 | 4 | 4 |
| Barber | 51,428,484 | 55,081,079 | 5 | 5 |
| Finneya | 36,885,767 | 44,291,434 | 6 | 6 |
| Haskella | 23,456,900 | 28,702,647 | 8 | 7 |
| Sewarda, b | 24,421,166 | 26,228,374 | 7 | 8 |
| Stantona | 19,944,619 | 23,846,214 | 9 | 9 |
| Kingman | 11,686,453 | 15,351,781 | 10 | 10 |
| Meade | 10,295,596 | 12,738,162 | 11 | 11 |
| Clark | 6,536,692 | 6,897,840 | 12 | 12 |
| Harper | 2,977,950 | 4,839,145 | 15 | 13 |
| Reno | 3,578,905 | 4,653,637 | 14 | 14 |
| Hamiltona | 4,228,915 | 4,254,341 | 13 | 15 |
| Pawnee | 2,607,146 | 2,744,249 | 17 | 16 |
| Kiowa | 2,090,043 | 2,617,650 | 18 | 17 |
| Rush | 2,632,657 | 2,401,929 | 16 | 18 |
| Edwards | 2,038,145 | 19 | ||
| (a) Hugoton Gas Area counties. (b) Not all gas produced in Morton and Seward Counties is from the Hugoton Gas Area. |
||||
Three more counties, Harper, Reno, and Kiowa, were added to the list of counties that had a cumulative production of natural gas of 10 billion cubic feet or more to the end of 1959 (Table 17). Changed in rank from 1958 are Kingman County, 11th in 1959 as compared to 12th in 1958, Pawnee County, 12th instead of 11th, Edwards County, 18th instead of 19th, and Stafford County, 20th instead of 18th. Although complete production records are not available, it is certain that four eastern counties, Allen, Cowley, Montgomery, and Wilson, have each produced 10 billion cubic feet or more of gas since production started. Table 17 shows the cumulative gas production and rank of the leading Kansas counties.
Table 17—Leading gas producing counties in Kansas based on estimated and recorded cumulative production to end of 1959*
| County | Cumulative production, M cu. ft. (14.65 psia) |
Rank | |
|---|---|---|---|
| 1958 | 1959 | ||
| Stevensa | 1,778,350,978 | 1 | 1 |
| Granta | 1,020,941,851 | 2 | 2 |
| Kearnya | 726,059,436 | 3 | 3 |
| Mortona, b | 609,800,873 | 4 | 4 |
| Barber | 451,985,074 | 5 | 5 |
| Finneya | 377,080,328 | 7 | 6 |
| Haskella | 367,001,271 | 6 | 7 |
| Sewarda, b | 293,666,784 | 8 | 8 |
| Stantona | 171,159,802 | 9 | 9 |
| Meade | 51,544,220 | 10 | 10 |
| Kingman | 50,775,962 | 12 | 11 |
| Pawnee | 40,546,071 | 11 | 12 |
| Rice | 35,553,190 | 13 | 13 |
| Hamiltona | 34,785,760 | 14 | 14 |
| Barton | 24,318,652 | 15 | 15 |
| Pratt | 21,777,560 | 16 | 16 |
| Clark | 19,773,690 | 17 | 17 |
| Edwards | 14,065,788 | 19 | 18 |
| Harper | 13,987,087 | 19 | |
| Stafford | 13,590,727 | 18 | 20 |
| Reno | 11,960,480 | 21 | |
| Kiowa | 10,441,040 | 22 | |
| (a) Hugoton Gas Area counties. (b) Not all gas produced in Morton and Seward Counties is from the Hugoton Gas Area. * Several eastern Kansas counties, although no longer important gas producers. formerly yielded great quantities of gas. Published cumulative production data on gas production for eastern counties are not available. It is reasonably certain. however. from data that are extant, that Allen, Cowley, Montgomery. and Wilson Counties have each produced 10 billion cubic feet of gas or more. |
|||
Reserves of natural gas in 1959 were estimated at 19,980,000 million cubic feet, 1.2 percent less than in 1958 (Table 14), although reserves have generally increased during the last decade. Forty-one new gas fields (39 gas and 2 gas and oil fields) were discovered in 1959, 20 more than in the previous year. Also two gas fields producing oil were revived (Table 14) .
Cities Service Gas Company added 21.5 miles of 30-inch pipe to its system from Welda, Anderson County, to Princeton, Franklin County; 10 miles of 16-inch pipe in the Ottawa area, Franklin County; 7.2 miles of 16-inch pipe in the Fort Scott area, Bourbon County; 25 miles of 12-inch pipe between Hutchinson, Reno County, and Ellsworth, Ellsworth County; and completed 4.4 miles of 16-inch replacement pipe west of Lawrence, Douglas County.
The Michigan Wisconsin Pipe Line Company constructed four 24-inch loops and part of a fifth for a total of 137 miles of line on its main line that extends from the Hugoton Gas Area diagonally eastward across the state. The Wheatland Natural Gas Company installed 125 miles of 1- to 4-inch pipeline in Scott, Wichita, and Wallace Counties for supplying fuel to irrigation systems. A second similar gas-distributing system of the same company was completed in Finney, Gray, and Haskell Counties, totaling 65 miles of 1- and 2-inch pipeline. The Northern Natural Gas Company constructed 11 miles of 30-inch pipe on its line between Clifton, Washington County, and Trescott, Ottawa County; 8 miles of 30-inch pipe between Trescott and Bushton, Barton County; and 8 miles of 30-inch pipe along a line from Beaver, Oklahoma, to Mullinville, Kiowa County, Kansas. In the Hugoton Gas Area, Panhandle Eastern Pipeline Company completed 16 miles of 10-inch, 13 miles of 6-inch, 40 miles of 4-inch, and 1 mile of 2-inch gathering lines. In the northwestern part of the state the Kansas-Nebraska Natural Gas Company completed 15.5 miles of 12-inch loop.
Cities Service Gas Company built its first satellite compressor station near Sublette, Haskell County, in 1959, and the KansasNebraska Natural Gas Company installed a 1,800-horsepower compressor station at Quinter, Gove County, a 950-horsepower station at Holcomb, Finney County, and a similar compressor station at Palco, Rooks County. The Northern Natural Gas Company added 2000 horsepower to its compressor stations at Clifton, Washington County; Mullinville, Kiowa County; and Bushton. Barton County.
In 1959 Kansas produced 5,543,983 bbl. of natural gas liquids—natural gasoline, propane, butane, and other miscellaneous liquefied gases, valued at $12,252,202. Production in 1959 was 3.4 percent greater than in 1958, and value was 19.1 percent greater (Table 18). The price per barrel of natural gasoline in 1959 was $2.31, the same as in the previous year. The estimated price per barrel of all other natural gas liquids in 1958 was $1.55 whereas in 1959 propane was priced at $2.21 per barrel, butane at $2.06 per barrel, and all other LPG at $1.55 per barrel. Although the total quantity of natural gas liquids in 1959 was greater by 3.4 percent than in 1958, Kansas produced less natural gasoline and miscellaneous LPG in 1959 than in 1958. Production of propane and butane, on the other hand, showed increases (Table 18).
Table 18—Production and value of natural gas liquids in Kansas, 1958 and 1959
| 1958 | 1959 | |||
|---|---|---|---|---|
| Quantity, bbl. | Valuea ($) | Quantity, bbl. | Value ($) | |
| Natural gasoline | 2,600,607 | 6,007,402 | 2,554,365 | 5,900,583 |
| Propane | 1,363,436 | 2,113,326 | 1,426,595 | 3,152,775 |
| Butane | 993,269 | 1,539,567 | 1,507,175 | 3,112,280 |
| Other LPG | 404,027 | 626,242 | 55,848 | 86,564 |
| Total | 5,361,339 | $10,286,537 | 5,543,983 | $12,252,202 |
| Percent change from 1958 | +3.4 | +19.1 | ||
| (a) Estimated average price $2.31 per barrel for natural gasoline, all others $1.55. | ||||
During the 1950-59 period Kansas produced 48 million barrels of natural gas liquids valued at $117,000,000 (Fig. 6). The 1950-59 production and value of natural gas liquids approximated 58 and 63 percent respectively of the estimated cumulative production (recorded since 1916 for natural gasoline, since 1941 for LPG) of 82,000,000 bbl. valued at $187,000,000.
Proved reserves of natural gas liquids, 196,912,000 bbl., were 1.3 percent less than in 1958, when reserves were estimated to be 199,552,000 bbl. The estimated 1959 reserves of natural gas liquids were exceeded but once during the 1950-59 decade.
Okan Pipeline Company built 28 miles of 4-inch pipeline for LPG and natural gasoline between their Mocane plant in Beaver County, Oklahoma, and their station at Liberal, Seward County, Kansas.
In 1959 natural gasoline and liquefied petroleum gas were produced by 14 companies in 14 plants in 10 counties (Table 19).
Table 19—Directory of Kansas plants producing natural gasoline and liquefied petroleum gas on record as of December 31, 1959
| Plant location | Company | |
|---|---|---|
| County | Town | |
| Barber | Medicine Lodge | Skelly Oil Company |
| Finney | Holcomb | Northern Natural Gas Company |
| Grant | Ulysses | Hugoton Production Company |
| Grant | Ulysses | Pan American Petroleum Corporation |
| Grant | Ulysses | Socony Mobil Oil Company, Inc. |
| Haskell | Sublette | Northern Natural Gas Company |
| Kearny | Lakin | Colorado Interstate Gas Company |
| Kearny | Deerfield | Kansas-Nebraska Natural Gas Company |
| Kingman | Spivey | Socony Mobil Oil Company, Inc. |
| Reno | Burrton | Cities Service Oil Company |
| Rush | Otis | Dunn-Mar Oil & Gas Company |
| Sedgwick | Wichita | Cities Service Oil Company |
| Sedgwick | Cheney | Plateau Natural Gas Company |
| Seward | Liberal | Panhandle Eastern Pipeline Company |
Both production and shipments of helium in Kansas were less in 1959 than in 1958. Production in 1959 amounted to 24,004,300 cu. ft. and shipments were 21,642,500 cu. ft. whereas in 1958 production was 25,858,000 cu. ft. and shipments were 27,888,000 cu. ft. Shipments in 1959 were 22.4 percent less than in 1958. The 1959 shipments were worth $342,619 or 20.7 percent less than in 1958, when helium shipments were valued at $432,264. Production and price are controlled by the Federal Government. Federal agencies pay $15.50 per 1000 cu. ft. at the production plants plus 45c per cylinder filling charge for shipment in cylinders. Other users pay $19.00 at the plant and an additional $2.00 per 1000 cu. ft. for helium supplied in standard cylinders. Annual production and shipments of helium during the 1950-59 decade rose to 45,000,000 cu. ft. in 1956 and have since declined (Fig. 6). Total value of helium shipments during the decade approximates $4,700,000.
Helium was produced at the United States Bureau of Mines plant at Otis, Rush County. The gas is extracted from heliumbearing natural gas from about 80 wells distributed in Barton, Pawnee, and Rush Counties. Helium-contributing gas fields include the Otis-Albert field in Rush and Barton Counties, the Ryan field in Rush and Pawnee Counties, the Pawnee Rock field in Pawnee County, the Reichel field in Rush County, and the Behrens and Unruh fields in Barton County. The Ash Creek field, Pawnee County, and the Dundee and Bergtal fields, Barton County, which formerly supplied helium, have been abandoned.
In 1959 Kansas produced 91,644,160 lbs. of carbon black, 16,200,410 lbs. (21.4 percent) more than in 1958. The 1959 product was valued at $6,387,598 or 21.4 percent more than in 1958, when the value was $5,261,142. An estimated 4.62 billion cubic feet of gas and 0.39 million barrels of natural gas liquids were consumed in the manufacture of carbon black in 1959. Carbon black ranked eighth in value among the mineral commodities produced in the state. Production of carbon black exceeded 857,000,000 lbs., worth $48,000,000, during the 1950-59 decade. In 1959 carbon black was produced by the Columbian Carbon Company at Hickok and by the United Carbon Company at Ryus, both in Grant County.
The value of the 1959 production of nonmetallic minerals, exclusive of mineral fuels, and associated products (cement, clay, diatomaceous marl, gypsum, pumicite or volcanic ash, salt, sand and gravel, stone, and perlite and vermiculite products) was $81,501,619 or 15.54 percent of the total value of all minerals produced in the state (Table 4, Fig. 3).
Cement production, shipments, and value in 1959 exceeded those of 1958. Total production and total shipments of cement, excluding natural cement, in Kansas in 1959 were 10,525,16'3 bbl. and 10,405,209 bbl. respectively, whereas in 1958 total cement production amounted to 9,537,119 bbl. and total shipments to 9,600,697 bbl. The increases in total production and shipments were smaller in 1959 (10.4 and 8.4 percent respectively) than in 1958 (13.2 and 17.4 percent). The value of shipments in 1959 was $32,282,687 or $2,234,954 (7.4 percent) more than in the previous year, when it amounted to $30,047,733. Of the total quantity of cement produced, 10,177,183 bbl. or 96.7 percent was portland cement and only 347,880 bbl. or 3.3 percent was masonry cement. Portland cement production in 1959 was greater by 932,999 bbl. (10 percent) than it was in 1958. Shipments of portland cement in 1959 exceeded 1958 shipments by 8.1 percent in quantity and 7.1 percent in value. Quantity and value of portland cement shipped in 1959 were respectively 10,055,944 bbl. and $30,889,337, whereas in 1958 the amount shipped was 9,298,427 bbl. worth $28,843,139. The average price of portland cement in 1959 was $3.07 per barrel, 3¢ less than in the previous year. Kansas produced 347,880 bbl. of masonry cement in 1959 or 18.8 percent more than in 1958. Shipments and value of masonry cement exceeded by 15.5 and 15.7 percent respectively those of 1958. Shipments in 1959 amounted to 349,265 bbl. valued at $1,393,350. The average price of masonry cement in 1959 was $3.99 per barrel, the same as in 1958. Data on production, shipments, and value of portland, masonry, and total cement are presented in Table 20.
Table 20—Production, shipments, and value of portland and masonry cement in Kansas, 1958 and 1959, 376-lb. bbl.
| Commodity | Production, bbl. | Shipments | |||||
|---|---|---|---|---|---|---|---|
| 1958 | 1959 | ||||||
| 1958 | 1959 | Bbl. | Value | Bbl. | Value | ||
| Portland | 9,244,184 | 10,177,183 | 9,298,427 | $28,843,139 | 10,055,944 | $30,889,337 | |
| Average price/bbl. | 3.10 | 3.07 | |||||
| Percent change from 1958 | +10.1 | +8.1 | +7.1 | ||||
| Masonry | 292,935 | 347,880 | 302,270 | $1,204,594 | 349,265 | $1,393,350 | |
| Average price/bbl. | 3.99 | 3.99 | |||||
| Percent change from 1958 | +18.8 | +15.5 | +15.7 | ||||
| Total | 9,537,119 | 10,525,063 | 9,600,697 | $30,047,733 | 10,405,209 | $32,282,687 | |
| Percent change from 1958 | +10.4 | +8.4 | +7.4 | ||||
As in previous years Allen County, which includes two of the seven cement plants in the state, led in production and shipments in 1959. Neosho County was second, followed by Montgomery County. Although Wilson County led Wyandotte in shipments, Wyandotte County produced slightly more than Wilson County. Bourbon County, represented by the only natural cement producing company in the state, the Fort Scott Hydraulic Cement Company, Fort Scott, produced some masonry cement. Stocks on hand at year's end were 1,001,142 bbl. as compared to 923,218 bb1. on December 31, 1958, an increase of 8.4 percent.
Value of natural cement production is included under "Undistributed" minerals in Table 1 and is discussed [later].
Kansas cement is exported to Arkansas, Illinois, Iowa, Minnesota, Missouri, Nebraska, Oklahoma, South Dakota, Texas, Wyoming, and several foreign countries. Cement is third in importance among the minerals produced in the state.
The seven cement producers on record as of December 31, 1959, are listed in Table 21.
Table 21—Directory of cement producers in Kansas, 1959
| County | Company | Office address | Quarry | Type |
|---|---|---|---|---|
| Allen | Lehigh Portland Cement Co. | Young Bldg., 718 Hamilton St., Allentown, Pennsylvania |
Iola | Portland and masonry |
| Allen | Monarch Cement Co. | Humboldt | Humboldt | Portland and masonry |
| Bourbon | Fort Scott Hydraulic Cement Co. | P.O. Box 267, Fort Scott | Fort Scott | Natural and masonry |
| Montgomery | Universal Atlas Cement Co. | 100 Park Ave., New York 17, New York |
Independence | Portland and masonry |
| Neosho | Ash Grove Lime & Portland Cement Co. |
101 W. 11th, Kansas City 6, Missouri |
Chanute | Portland and masonry |
| Wilson | Consolidated Cement Corp. | Fredonia | Fredonia | Portland and masonry |
| Wyandotte | Lone Star Cement Corp. | 1006 Grand Ave., Kansas City 6, Missouri |
Bonner Springs | Portland and masonry |
Clay and shale production in Kansas in 1959 amounted to 1,020,560 tons valued at $1,270,341, an increase of 16.6 percent in tonnage and 10.9 percent in value. Production and value in 1959 are the highest in the 1950-59 decade. Kansas clay and shale produced consisted of fire clay and miscellaneous clay (including shale used for cement), the former being produced in Barton, Cloud, Crawford, and Ellsworth Counties and the latter in Allen, Cherokee, Crawford, Franklin, Montgomery, and Wilson Counties. Fire clay production in 1959 increased 45.6 percent in quantity and 17.5 percent in value from 1958, whereas production of miscellaneous clay exceeded the 1958 production by 8.8 percent and value exceeded 1958 value by 6.8 percent.
Clay used for cement in 1959 amounted to 411,865 tons or 13 percent more than in 1958 when 364,588 tons was used. In 1959, eight companies operating in nine counties produced clay or shale. Disregarding clay used for cement, Cloud, Crawford, Franklin, and Barton Counties led in 1959. Kansas clay and shale is used primarily for the manufacture of brick (136,757,000 were produced in 1959 or 25,847,000 more than in 1958), tile, cement, and lightweight aggregate. Raw clay and shale ranked 16th among mineral commodities produced in 1959 and 6th if clay products are included. Table 22 presents data on clay and shale sold or used by producers in Kansas in 1958 and 1959.
Table 22—Clay and shale sold or used by producers in Kansas, 1958 and 1959
| Year | Brick, tile, lightweight aggregate |
Cement | Total | Clay and clay products |
|||
|---|---|---|---|---|---|---|---|
| Tons | Value | Tons | Value | Tons | Value | ||
| 1958 | 510,853 | $780,395 | 364,588 | $364,588 | 875,441 | $1,144,983 | $10,500,000 |
| 1959 | 608,695 | $858,476 | 411,865 | $411,865 | 1,020,560 | $1,270,341 | $11,500,000 |
| Percent change from 1958 | +19.2 | +10.0 | +13.0 | +13.0 | +16.6 | +10.9 | |
The Cloud Ceramics Company of Concordia, Cloud County, reopened 10 periodic kilns during 1959, increasing output to 3.5 million bricks per month. The Consolidated Cement Corp., located at Fredonia, Wilson County, is now the General Portland Cement Company of 111 West Monroe Street, Chicago, Illinois. Kansas Industries, Inc., formerly at 4001 Kaw Drive, Kansas City, has moved.
Reserves of clay and shale are almost without limit. In central and north-central Kansas, where the most valuable clays in the state are found, reserves of strippable high grade clays are estimated to be at least 125 billion tons.
A directory of clay and shale producers in Kansas in 1959 is given in Table 23.
Table 23—Directory of clay and shale producers in Kansas in 1959
| County | Company | Office address | Pit location | Type plant* |
|---|---|---|---|---|
| Allen | Humboldt Shale Mining Co. | P.O. Drawer 97, Humboldt | Humboldt | B |
| Allen | Lehigh Portland Cement Co. | Young Bldg., 718 Hamilton St., Allentown, Pa. | Iola | C |
| Allen | Monarch Cement Co. | Humboldt | Humboldt | C |
| Allen | United Brick & Tile Co. | 207 Pickwick Bldg., Kansas City 42, Mo. | Iola | B |
| Barton | Acme Brick Co. | P.O. Box 425, Fort Worth, Texas | Great Bend | B |
| Barton | Kansas Brick & Tile Co. | Hoisington | Hoisington | B |
| Cherokee | United Brick & Tile Co. | 207 Pickwick Bldg., Kansas City 42, Mo. | Weir | B |
| Cloud | Cloud Ceramics | Concordia | Concordia | B |
| Crawford | W. S. Dickey Clay Mfg. Co. | 607-617 Commerce Trust Bldg., Kansas City 6, Mo. | Pittsburg | B |
| Ellsworth | Acme Brick Co. | P.O. Box 425, Fort Worth, Texas | Kanopolis | B |
| Franklin | Buildex, Inc. | P.O. Box 299, Pittsburg | Ottawa | A |
| Jewell | Ideal Cement Co. | 507 Denver National Bank Bldg., Denver, Colo. | C | |
| Montgomery | United Brick & Tile Co. | 207 Pickwick Bldg., Kansas City 42, Mo. | Coffeyville | B |
| Montgomery | Universal Atlas Cement Co. | 100 Park Ave., New York 17, N.Y. | Independence | C |
| Neosho | Ash Grove Lime & Portland Cement Co. | 101 W. 11th St., Kansas City 6, Mo. | Chanute | C |
| Wilson | Acme Brick Co. | P.O. Box 425, Fort Worth, Texas | Buffalo | B |
| Wilson | General Portland Cement Co. | 111-West Monroe St., Chicago, Ill. | Fredonia | C |
| Wilson | Excelsior Brick Co. | P.O. Box 32, Fredonia | Fredonia | B |
| * A, aggregate; B, brick; C, cement. | ||||
For the third time in the 1950-59 decade, salt production in Kansas has shown an increase. In 1959 Kansas produced a total of 899,252 tons of salt of which 510,292 tons or 56.7 percent was rock salt and 388,960 tons or 43.3 percent was evaporated salt. Production of salt in 1959 exceeded production in 1958 by 5 percent. Value of salt produced in 1959 amounted to $11,687,446 or 10.9 percent more than in 1958. Value of salt produced has increased each year in the decade by amounts ranging from 3.1 percent in 1951 to 12.2 percent in 1950. Although Kansas produces more rock salt than evaporated salt each year, the value of the evaporated salt greatly exceeds that of rock salt. In 1959 the value of evaporated salt was $9,034,759 whereas the value of rock salt was only $2,652,687. Tonnage of rock and evaporated salt in 1959 exceeded tonnage of the previous year by 5.5 and 4.2 percent respectively (Table 24).
Table 24—Salt sold or used by producers in Kansas, 1958 and 1959, short tons
| Year | Evaporated salt | Rock salt | Total | |||
|---|---|---|---|---|---|---|
| Tons | Value | Tons | Value | Tons | Value | |
| 1958 | 373,263 | $7,962,669 | 483,562 | $2,575,700 | 856,825 | $10,538,369 |
| 1959 | 388,960 | $9,034,759 | 510,292 | $2,652,687 | 899,252 | $11,687,446 |
| Percent change from 1958 |
+4.2 | +13.5 | +5.5 | +3.0 | +5.0 | +10.9 |
Commercial salt was produced by five companies operating in three counties, Ellsworth, Reno, and Rice; the Reno County production was more than half of the total. A new company, the Pawnee Salt Corp. of Pawnee Rock in Barton County, organized in 1958 to produce salt by the evaporating process, had not completed their plant and did not report any salt production in 1959. In addition to the ordinary commercial salt producing companies, the Frontier Chemical Company of Kansas, Inc., Wichita, a division of Vulcan Materials Company of Birmingham, Alabama, produces its own salt from wells in Sedgwick County for use in the manufacture of industrial inorganic chemicals.
Salt ranked fifth in value among minerals produced in the state in 1959. Kansas salt in 1959 was shipped to 33 states, the District of Columbia, Canada, Guatemala, and Puerto Rico. Since salt production first started, Kansas has produced approximately 42,600,000 tons valued at $215,500,000. Known salt reserves amount to more than 5 trillion tons.
All companies producing or preparing to produce salt in Kansas in 1959 are listed in Table 25.
Table 25—Directory of salt companies in Kansas in 1959
| County | Company | Office address | Location of mine or well |
Type of plant |
|---|---|---|---|---|
| Barton | Pawnee Salt Corp. | Pawnee Rock | Pawnee Rock |
Evaporated Rock |
| Ellsworth | Independent Salt Co. | 4115 Parkers Ave., Chicago 9, Ill. |
Kanopolis | Evaporated |
| Reno | The Barton Salt Co. | Hutchinson | Hutchinson | Rock and evaporated |
| Reno | The Carey Salt Co. | Hutchinson | Hutchinson | Rock and evaporated |
| Reno | Morton Salt Co. | 120 S. La Salle, Chicago 3, Ill. |
do | Evaporated |
| Rice | American Salt Co. | 630 New York Life Bldg., K.C. 6, Mo. |
Lyons | Evaporated and rock |
| Sedgwick | Frontier Chemical Co. of Kansas, Inc. |
P.O. Box 545, Wichita |
Wichita | Brine |
In 1959 Kansas produced 11,334,128 tons of sand and gravel worth $7,937,205, an increase of 7.1 percent in tonnage and 12.7 percent in value from 1958, when production and value were 10,578,668 tons and $7,044,966 respectively. With the exception of 1956, when Kansas produced 12,515,164 tons of sand and gravel valued at $8,022,312, the 1959 production and value were the greatest in the decade. Total production in the decade amounted to 99,400,000 tons valued at $65,500,000. Of all recorded sand and gravel production since 1865, 50.1 percent (worth 57.9 percent of the total value) was produced in the last decade (Table 26).
Table 26—Sand and gravel sold or used by commercial and noncommercial producers in Kansas, 1958 and 1959
| Year | Commercial | Noncommercial | Total sand and gravel | Ave. price per ton |
|||
|---|---|---|---|---|---|---|---|
| Short tons | Value | Short tons | Value | Short tons | Value | ||
| 1958 | 8,529,691 | $6,073,020 | 2,048,977 | $971,946 | 10,578,668 | $7,044,966 | .65 |
| 1959 | 9,256,747 | $6,661,483 | 2,077,381 | $1,275,722 | 11,334,128 | $7,937,205 | |
| Percent change from 1958 |
+7.1 | +12.7 | |||||
Of the 11,334,128 tons of sand and gravel produced in 1959, 81.6 percent or 9,256,747 tons was classified as commercial sand and gravel and 18.4 percent or 2,077,381 tons as noncommercial sand and gravel. In value the commercially produced sand and gravel amounted to $6,661,483 or 83.8 percent and the noncommercial sand and gravel $1,275,722 or 16.2 percent of total value. Sand and gravel were produced in 71 counties by 95 commercial operators and at least 46 noncommercial producers, a total of 141 agencies. In 1959, sand and gravel ranked seventh in value among the minerals produced in the state. Most of the sand and gravel was used for paving and building (structural) purposes. Other uses of Kansas sand included fill, filter, engine, railroad ballast, blast, molding, grinding and polishing, hydrafraction, and miscellaneous purposes (Table 27). Wyandotte and Sedgwick Counties produced 4,204,000 tons of sand and gravel, or 37 percent of the total.
Table 27—Production of sand and gravel in Kansas, 1958 and 1959, by use
| Use | 1958 | 1959 | |||
|---|---|---|---|---|---|
| Tons | Value ($) | Tons | Value ($) | ||
| Sand: | |||||
| Building (structural) | 2,831,575 | 2,081,423 | 3,642,410 | 2,631,741 | |
| Paving | 4,248,870 | 2,623,238 | 3,629,238 | 2,032,376 | |
| Fill | 666,318 | 352,504 | |||
| Filter | 10,405 | 17,056 | |||
| Engine | 37,536 | 55,548 | 40,583 | 70,273 | |
| Miscellaneous (construction) |
34,673 | 29,830 | |||
| Railroad ballast | 79,109 | 29,031 | |||
| Blast | * | * | 18,140 | 8,138 | |
| Other | 841,609 | 465,975 | 378,031 | 228,523 | |
| Gravel: | |||||
| Paving | 2,135,897 | 1,391,198 | 2,664,244 | 2,178,711 | |
| Structural | 385,566 | 310,779 | 325,314 | 258,135 | |
| Other | 64,677 | 102,659 | 201,252 | 133,459 | |
| * Undistributed, value included with "Other", which also includes molding, grinding and polishing, glass, and hydrafraction sand. |
|||||
Sand and gravel reserves are regarded as inexhaustible because the demand for sand and gravel is insignificant compared to the quantity available. Furthermore, sand especially is continually being replaced by new deposits brought in by streams.
Sand and gravel producers that operated in 1959 are listed in Table 28.
Table 28—Directory of sand and gravel producers on record as of December 31, 1959
| County | Company or operator | Address |
|---|---|---|
| Anderson | Anderson Co. Highway Dept. | Garnett |
| Barber | Barber Co. Highway Dept. | Medicine Lodge |
| Barber | M. W. Watson | 1004 Nat'l Bank of Topeka Bldg., Topeka |
| Barton | Barton Co. Highway Dept. | P.O. Box 747, Great Bend |
| Barton | Arkansas Sand Co. | 1619 Stone St., Great Bend |
| Barton | DuBois Sand Co. | P.O. Box 172, Great Bend |
| Barton | Gruber Sand Plant | 918 Stone St., Great Bend |
| Barton | Klepper Sand Co. | Claflin |
| Barton | Moos Bros. Sand Co. | P.O. Box 406, Great Bend |
| Chase | Chase Co. Highway Dept. | Cottonwood Falls |
| Chautauqua | Chautauqua Co. Highway Dept. | Sedan |
| Cheyenne | New Era Sand & Gravel Co. | St. Francis |
| Clark | Clark Co. Highway Dept. | Ashland |
| Clay | Clay Co. Highway Dept. | Clay Center |
| Clay | Alsop Sand Co. | Wakefield |
| Clay | Clay Center Concrete & Sand Co. | Clay Center |
| Cloud | Cloud Co. Highway Dept. | Concordia |
| Cloud | Earl Beaver Co., Inc. | Glasco |
| Coffey | Coffey Co. Highway Dept. | Burlington |
| Comanche | Comanche Co. Road Dept. | Coldwater |
| Cowley | Cowley Co. Highway Dept. | Winfield |
| Cowley | McFarland Gravel Co. | 730 No. D St., Arkansas City |
| Cowley | Myers Materials, Inc. | P.O. Box 911, El Dorado |
| Cowley | Oxford Sand & Gravel Co. | P.O. Box 266, Oxford |
| Cowley | Warren R. Phillips | P.O. Box 50, Winfield |
| Cowley | Wilson Bros. | P.O. Box 59, Route 1, Arkansas City |
| Decatur | M. W. Watson | 1004 Nat'l Bank of Topeka Bldg., Topeka |
| Dickinson | Shoffner Sand & Gravel Co. | 134 E. Jewell St., Salina |
| Douglas | Bowersock Mills & Power Co. | 546 Massachusetts St., Lawrence |
| Edwards | Showalter Sand & Gravel Co. | Garfield |
| Elk | Elk Co. Highway Dept. | Howard |
| Ellis | Lewis C. Schmidtberger | P.O. Box 93, Victoria |
| Ellsworth | Ellsworth Co. Highway Dept. | Ellsworth |
| Ellsworth | Henry Milberger | Wilson |
| Ellsworth | San Ore Construction Co., Inc. | McPherson |
| Ellsworth | Stoppel Construction Co. | Ellsworth |
| Finney | Finney Co. Highway Dept. | Garden City |
| Finney | Sam Alsop Construction Co. | 1207 Pinecrest, Garden City |
| Ford | Davis & Sons Sand Sales | Route 1, Dodge City. |
| Ford | Dodge City Sand Co. | P.O. Box 430, Dodge City |
| Ford | Miller Sand & Gravel Co. | Dodge City |
| Geary | Junction City Sand & Gravel Co. | Route 3, Junction City |
| Geary | More Sand Co. | 626 W. 6th St., Junction City |
| Gove | Gove Co. Highway Dept. | Gove |
| Gove | Ray Higbee | Grinnel |
| Graham | San Ore Construction Co., Inc. | McPherson |
| Gray | Kerr Sand Co. | Cimarron |
| Hamilton | Hamilton Co. Highway Dept. | Syracuse |
| Hamilton | M. W. Watson | 1004 Nat'l Bank of Topeka Bldg., Topeka |
| Hamilton | Syracuse Sand & Gravel Co. | 107 N. Elizabeth St., Syracuse |
| Harper | Harper Co. Highway Dept. | Anthony |
| Haskell | Haskell Co. Highway Dept. | Sublette |
| Haskell | Atchison, Topeka & Santa Fe Rwy. | Topeka |
| Jackson | Jackson Co. Highway Dept. | Holton |
| Kearny | Kearny Co. Highway Dept. | Lakin |
| Kearny | Popejoy Sand & Gravel Co. | Ulysses |
| Kingman | Ray Wells. | Route 1, Kingman |
| Kiowa | Kiowa Co. Highway Dept. | Greensburg |
| Kiowa | Seacat Sand & Excavation Co. | Greensburg |
| Leavenworth | Leavenworth Co. Highway Dept. | Leavenworth |
| Leavenworth | Missouri Valley Sand, Inc. | P.O. Box 822, Leavenworth |
| Lincoln | San Ore Construction Co., Inc. | McPherson |
| Linn | Linn Co. Highway Dept. | Mound City |
| Lyon | Wesley Parks | 648 Oak St., Emporia |
| Marshall | Marshall Co. Highway Dept. | Marysville |
| Marshall | Blue River Sand & Gravel Co. | Blue Rapids |
| Marshall | C. V. Garrett | Blue Rapids |
| Marshall | Heinzelman Construction Co. | Marysville |
| Marshall | Hugo P. Vogler | Waterville |
| McPherson | McPherson Co. Road Dept. | McPherson |
| Mitchell | Harry Henery, Inc. | P.O. Box 15, Ottawa |
| Morris | Morris Co. Highway Dept. | Council Grove |
| Morris | Virgil Metcalf | Route 3, Council Grove |
| Nemaha | Anderson-Oxandale | P.O. Box 425, Herington |
| Norton | Norton Co. Highway Dept. | Norton |
| Osborne | Osborne Co. Highway Dept. | Osborne |
| Pawnee | Pawnee Co. Highway Dept. | Larned |
| Pawnee | Johnson Sand & Gravel Co. | P.O. Box 545, Larned |
| Pawnee | Larned Sand & Gravel Co. | P.O. Box 227, Larned |
| Phillips | D. G. Hansen | Logan |
| Pottawatomie | Wamego Sand Co. | Wamego |
| Pratt | Pratt Co. Highway Dept. | Pratt |
| Pratt | Mrs. C. D. Hogard | 507 So. Mound St., Pratt |
| Pratt | Miller Sand & Gravel Co. | Route 2, Pratt |
| Reno | City of Hutchinson Road Dept. | Hutchinson |
| Reno | Haven Sand Co. | Haven |
| Reno | J. N. Shears Sons, Inc. | P.O. Box 277, Hutchinson |
| Reno | J. E. Steele Sand & Gravel Co. | Route 4, Hutchinson |
| Reno | J. A. Mummey Sand & Gravel Co. | Nickerson |
| Reno | Fountain Sand Pit | Arlington |
| Republic | Republic Co. Highway Dept. | Belleville |
| Republic | Alsop Sand Co. | Wakefield |
| Rice | Arensman Sand & Gravel Co. | Chase |
| Rice | Rock Hill Stone & Gravel Co. | P.O. Box 412, Sterling |
| Rice | A. L. Stapleton | 121 N. Logan St., Lyons |
| Rice | Sterling Sand & Gravel Co., Inc. | P.O. Box 281, Sterling |
| Rice | Tobias, Wright & Birchenough, Inc. | Lyons |
| Riley | Walters Sand Co. | P.O. Box 30, Manhattan |
| Russell | Russell Co. Highway Dept. | Russell |
| Saline | Central Kansas Sand Co. | Mentor |
| Saline | Salina Sand Co., Inc. | Mentor |
| Scott | M. W. Watson | 1004 Nat'l Bank of Topeka Bldg., Topeka |
| Sedgwick | City Engineer, Wichita | Wichita |
| Sedgwick | Bentley Sand Co. | Bentley |
| Sedgwick | Big Three Sand & Gravel Co. | 3020 W. 21st St., Wichita 12 |
| Sedgwick | Dolese Brothers Co. | 13 N.W. 13th St., Oklahoma City, Okla. |
| Sedgwick | L. C. House Sand Co. | Route 2, Sedgwick |
| Sedgwick | J & H Sand Co. | 4226 Midland St., Wichita |
| Sedgwick | Walt Keeler Co., Inc. | P.O. Box 1972, Wichita 1 |
| Sedgwick | Miles Sand Service | 3925 W. 53rd St., Wichita |
| Sedgwick | Provence Sand Co. | 6600 W. 13th St., Wichita |
| Sedgwick | Southwest Sand & Gravel Co. | 4505 Southwest Blvd., Wichita 15 |
| Sedgwick | Superior Sand Co., Inc. | 1717 W. 21st St., Wichita 3 |
| Sedgwick | Vic's Sand & Gravel Co. | Sedgwick |
| Sedgwick | York Sand Co. | P.O. Box 306, Sedgwick |
| Shawnee | Consumers Sand Co. | 1101 W. Railroad, Topeka |
| Shawnee | Harry Henery, Inc. | P.O. Box 15, Ottawa |
| Shawnee | Kansas Sand Co., Inc. | 531 N. Tyler St., Topeka |
| Shawnee | River Sand Co. | P.O. Box 233, Topeka |
| Shawnee | Shoffner Sand, Inc. | 1939 McAllister St., Topeka |
| Shawnee | Victory Sand & Gravel Co. | Box 281, Topeka |
| Sheridan | Sheridan Co. Highway Dept. | Hoxie |
| Sheridan | Carl Kaiser | Grainfield |
| Sherman | Sherman Co. Highway Dept. | P.O. Box 22, Goodland |
| Sherman | Harry Henery, Inc. | P.O. Box 15, Ottawa |
| Smith | Smith Co. Highway Dept. | Smith Center |
| Stafford | Stafford Co. Highway Dept. | St. John |
| Stafford | Partin Sand & Gravel Co. | P.O. Box 274, Stafford |
| Sumner | Sumner Co. Engineering Dept. | Wellington |
| Sumner | Mulvane Sand Co., Inc. | 503 E. Mulvane St., Mulvane |
| Thomas | Thomas Co. Road Dept. | Colby |
| Thomas | Harry Henery, Inc. | P.O. Box 15, Ottawa |
| Thomas | Joe Hubbard | Colby |
| Thomas | Purma Drag Line Co. | 975-2nd St., Colby |
| Thomas | San Ore Construction Co., Inc. | McPherson |
| Trego | Trego Co. Highway Dept. | WaKeeney |
| Wabaunsee | Wabaunsee Co. Highway Dept. | Alma |
| Wallace | Wallace Co. Highway Dept. | Sharon Springs |
| Wallace | Harry Henery, Inc. | P.O. Box 15, Ottawa |
| Washington | Washington Co. Highway Dept. | Washington |
| Washington | Finlayson Gravel | Barnes |
| Washington | Mueller Sand & Gravel Co. | Hanover |
| Wilson | Wilson Co. Highway Dept. | Fredonia |
| Wyandotte | American Sand & Gravel Co. | 5731 Kansas Ave., Turner |
| Wyandotte | Builders Sand Co. | P.O. Box 658, Argentine Sta., Kansas City 6 |
| Wyandotte | Dreyer Sand Co. | Turner |
| Wyandotte | Happe Sand Co. | 5411 Birch St., Mission |
| Wyandotte | Holliday Sand & Gravel Co. | 2 West 40th St., Kansas City 11, Mo. |
| Wyandotte | Peck-Woolf Sand & Materials Co. | 1920 Paseo Blvd., Kansas City 8, Mo. |
| Wyandotte | Stewart Sand & Materials Co. | 4049 Penn. Ave., Kansas City 11, Mo. |
| Wyandotte | Superior Sand & Gravel Co. | P.O. Box 106, Edwardsville |
| Various | Sand, Inc. | 1313 West 31, South Wichita 13 |
Stone, fourth most important mineral commodity in Kansas in 1959, showed a gain of 11.8 percent in quantity and 13.5 percent in value compared to 1958. Total stone production in 1959 amounted to 13,987,952 tons, an increase of 1,482,892 tons. Value of the 1959 production was $17,072,506 or $2,033,121 more than the previous year's production (Table 27). Stone produced was limestone, sandstone, and chat (chert). The last is associated with the metal mining industry of the Tri-State Lead and Zinc District in southern Cherokee County. In the tables, chat is included under "miscellaneous" stone.
By far the largest part of the stone produced in the state was limestone that was crushed and used for concrete and road metal, 9,250,215 tons, valued at $11,847,532. Next in importance quantitatively was stone used for making portland and masonry cement, followed by railroad ballast, riprap, agricultural, and dimension stone. On the basis of value, stone for concrete and road metal was first ($11,914,147), then cement ($2,719,245), agricultural limestone ($545,766), dimension stone ($502,863), riprap ($340,375), and railroad ballast ($193,398). In 1959, stone used for concrete and road metal, cement, and agricultural limestone showed increases from 1958; stone used for riprap, railroad ballast, and dimension stone showed decreases. A summary of Kansas stone production and value, by kind of rock and use, for 1958 and 1959, is presented in Table 29.
Table 29—Production and value of stone in Kansas, by kind of rock and use, 1958 and 1959
| 1958 | 1959 | ||||
|---|---|---|---|---|---|
| Tons | Value ($) | Tons | Value ($) | ||
| Limestone: | |||||
| Concrete and road metal | 7,619,141 | 9,824,504 | 9,250,215 | 11,847,532 | |
| Cement | 2,464,135 | 2,464,135 | 2,810,559 | 2,719,245 | |
| Riprap | 588,437 | 471,882 | 379,990 | 340,375 | |
| Dimension stone | 51,019 | 530,345 | 39,004 | 502,863 | |
| Agricultural | 288,213 | 430,584 | 352,759 | 545,766 | |
| Railroad ballast | 31,800 | 31,981 | 33,746 | 34,892 | |
| Other or miscellaneous | 506,531 | 863,949 | 489,911 | 856,712 | |
| Total limestone | 11,549,276 | $14,617,410 | 13,356,184 | $16,847,385 | |
| Sandstone: | |||||
| Railroad ballast | * | * | * | * | |
| Concrete and road metal | * | * | * | * | |
| Riprap | 26,190 | 38,800 | * | * | |
| Other (including dimension stone) |
* | * | * | * | |
| Miscellaneous: | |||||
| Railroad ballast | 572,949 | 205,829 | 456,104 | 158,506 | |
| Concrete and road metal | 355,925 | 177,346 | 175,664 | 66,615 | |
| Total miscellaneous | 928,874 | 383,175 | 631,768 | 225,121 | |
| Total stone† | 12,504,340 | 15,039,355 | 13,987,952 | 17,072,506 | |
| * Included under "Undistributed" in Table 1. † Does not include items marked by asterisk. |
|||||
The stone reserves of Kansas are extremely large and for practical purposes may be regarded as inexhaustible.
Stone was produced in Kansas in 1959 by 71 commercial companies operating 104 quarries in 41 counties and by at least 26 noncommercial operators, principally county highway departments, producing stone at 26 sites in 21 counties. Greatest activity in the stone industry centered in Wyandotte, Johnson, Dickinson, and Elk Counties, which produced 4,147,146 tons of stone (29.6' percent of all stone produced) valued at $5,174,137 (30.3 percent of the total value). Wyandotte, Allen, Neosho, Johnson, Wilson, Dickinson, Elk, and Montgomery Counties produced 63.8 percent of the limestone, Bourbon and Lincoln Counties all of the sandstone, and Cherokee County was the sole producer of chat. Dimension limestone production was confined to Cowley, Geary, Neosho, and Pottawatomie Counties and dimension sandstone to Bourbon County.
A directory of stone producers operating in Kansas in 1959 is given in Table 30.
Table 30—Directory of stone producers on record as of December 31, 1959
| County | Company or operator | Address |
|---|---|---|
| Allen | Allen Co. Highway Dept. | Iola |
| Allen | Lehigh Portland Cement Co. | Iola |
| Allen | Monarch Cement Co. | Humboldt |
| Allen | Nelson Bros. Quarries | La Harpe |
| Anderson | Hunt Rock Co. | Garnett |
| Anderson | Murray Limestone Products Co. | Centerville |
| Atchison | Atchison Co. Highway Dept. | Atchison |
| Atchison | Ralph Bromley & Sons Quarries | Atchison |
| Atchison | Geo. W. Kerford Quarry Co. | Atchison |
| Bourbon | Bandera Stone Quarry | Redfield |
| Bourbon | Bourbon Co. Highway Dept. | Fort Scott |
| Bourbon | Cullor Limestone Co. | R.F.D. 5, Fort Scott |
| Bourbon | Fort Scott Hydraulic Cement Co. | P.O. Box 267, Fort Scott |
| Butler | Myers Material, Inc. | P.O. Box 911, El Dorado |
| Chase | Riddle Quarries, Inc. | Nat'l Bank of America Bldg., Salina |
| Chautauqua | Sedan Limestone Co. | Sedan |
| Cherokee | Baxter Chat Co. | Baxter Springs |
| Cherokee | Eagle-Picher | Miami, Okla. |
| Cherokee | C. Y. Semple | P.O. Box 390, Baxter Springs |
| Cherokee | Southwest Chat Co., Inc. | Baxter Springs |
| Cherokee | Southwest Rock & Chat Co. | Baxter Springs |
| Cherokee | John J. Stark | P.O. Box 7, Girard |
| Cherokee | Lee R. Thomas, Agt. | Baxter Springs |
| Clay | Riddle Quarries, Inc. | Nat'l Bank of America Bldg., Salina |
| Coffey | Jones Rock Co. | P.O. Box 128, Emporia |
| Coffey | Neosho Valley Rock Co. | Burlington |
| Cowley | John V. Elam | Winfield |
| Cowley | C. L. Daniels Stone Co. | P.O. Box 134, Winfield |
| Cowley | Silverdale Cut Stone Co. | Silverdale |
| Cowley | Silverdale Limestone Co. | Route 3, Box 180, Arkansas City |
| Crawford | John J. Stark | Box 7, Girard |
| Dickinson | Anderson-Oxandale | Box 425, Herington |
| Dickinson | Riddle Quarries, Inc. | Nat'l Bank of America Bldg., Salina |
| Doniphan | U.S. Corps of Engineers | 1800 Federal Office Bldg., Kansas City 6, Mo. |
| Doniphan | Everett Quarries, Inc. | Plattsburg, Mo. |
| Doniphan | Geo. W. Kerford Co., Inc. | Atchison |
| Doniphan | Wolf River Limestone, Inc. | Troy |
| Douglas | Palmyra Township Highway Dept. | Baldwin |
| Elk | Concrete Materials Const. Co. | Moline |
| Ellis | City of Ellis Highway Dept. | Ellis |
| Ellis | Ellis Co. Highway Dept. | Hays |
| Franklin | Franklin Co. Highway Dept. | Ottawa |
| Franklin | Dan Fogle | Ottawa |
| Geary | Grosshans-Peterson, Inc. | Marysville |
| Geary | Walker Cut Stone Co. | P.O. Box 269, Junction City |
| Greenwood | Greenwood Co. Highway Dept. | Eureka |
| Greenwood | Sedan Limestone Co. | Sedan |
| Jackson | Anderson-Oxandale | Box 425, Herington |
| Jackson | G. W. Baker | Holton |
| Jackson | Reno Construction Co. | P.O. Box 61, Overland Park |
| Jefferson | Roy Baker | Valley Falls |
| Jefferson | N. R. Hamm Quarry, Inc. | Perry |
| Jewell | Ideal Cement Co. | Superior, Nebr. |
| Johnson | Deitz Hill Development Co. | 28 SW Blvd., Kansas City 10, Mo. |
| Johnson | Johnson Co. Highway Dept. | Olathe |
| Johnson | Reno Construction Co. | P.O. Box 61, Overland Park |
| Johnson | J. A. Tobin Construction Co. | 3701 Rainbow Blvd., Kansas City |
| Labette | Labette Co. Highway Dept. | Oswego |
| Labette | John J. Stark | Box 7, Girard |
| Leavenworth | Kansas State Penitentiary | Lansing |
| Leavenworth | U.S. Corps of Engineers | 1800 Federal Office Bldg., Kansas City 6, Mo. |
| Leavenworth | J. C. Haigwood | Tonganoxie |
| Leavenworth | Loring Quarries, Inc. | P.O. Box 174, Bonner Springs |
| Lincoln | Quartzite Stone Co. | Lincoln |
| Linn | Lee Giles | Greeley |
| Linn | Murray Limestone Products | Centerville |
| Lyon | City of Emporia Highway Dept. | Emporia . |
| Marion | Walt Keeler Co., Inc. | P.O. Box 1972, Wichita 1 |
| Marion | Riddle Quarries, Inc. | Nat'l Bank of America Bldg., Salina |
| Marshall | R. Hopper Brothers Quarry | Pawnee, Nebr. |
| Marshall | Swanson Construction Co. | Frankfort |
| Miami | Miami Co. Highway Dept. | Paola |
| Miami | A. J. Forster | Paola |
| Miami | L. W. Hayes, Inc. | 4550 Main St., Kansas City 2, Mo. |
| Montgomery | City of Coffeyville | Coffeyville |
| Montgomery | Montgomery Co. Highway Dept. | Independence |
| Montgomery | H & S Rock Co. | R.F.D. 1, Elk City |
| Montgomery | Universal Atlas Cement Co. | 100 Park Ave., New York 17, N.Y. |
| Morris | Anderson-Oxandale | Box 425, Herington |
| Neosho | Neosho Co. Highway Dept. | Erie |
| Neosho | Anderson-Oxandale | Box 425, Herington |
| Neosho | Ash Grove Lime-Portland | 101 W. 11th Street, Kansas City, Mo. |
| Neosho | Harry Byers & Sons, Inc. | 500 N. Plummer, Chanute |
| Neosho | Joe O'Brian Rock Crusher | St. Paul |
| Osage | Clark Rock Quarry | Baldwin |
| Pottawatomie | Anderson-Oxandale | Box 425, Herington |
| Pottawatomie | Bayer Stone Co., Inc. | 509 Yuma St., Manhattan |
| Rice | Riddle Quarries, Inc. | Nat'l Bank of America Bldg., Salina |
| Riley | Bayer Construction Co. | 509 Yuma St., Manhattan |
| Sedgwick | Wichita Highway Dept. | City Building, Wichita |
| Shawnee | Geo. W. Kerford Co., Inc. | Atchison |
| Shawnee | Henry C. Luttjohann | 2001 James St., Topeka |
| Shawnee | Netherland Stone Co. | Route 2, Topeka |
| Wabaunsee | Wabaunsee Co. County Engineer | Alma |
| Wilson | Benedict Rock & Lime Co. | Benedict |
| Wilson | Carr Rock Products Co. | 315 N. 8th St., Neodesha |
| Wilson | General Portland Cement Co. | 111 West Monroe St., Chicago 3, Ill. |
| Woodson | Nelson Brothers Quarries | La Harpe |
| Wyandotte | American Rock Crusher | 3700 Rainbow Blvd., Rosedale |
| Wyandotte | Lone Star Cement Corp. | 1650 Dierks Bldg., Kansas City 6, Mo. |
| Wyandotte | Peerless Quarries, Inc. | Turner |
| Wyandotte | Thompson-Strauss Quarries, Inc. | 700 Holliday Drive, Kansas City |
| Wyandotte | J. A. Tobin Construction Co. | 3701 Rainbow Blvd., Kansas City |
| Various | Concrete Materials & Construction Co. | Moline |
Lead and zinc are the only metals mined in Kansas; four mines operated by four producers and several gougers in the southeast corner of Cherokee County, in the extreme southeast part of the state, produced lead and zinc. In 1959 the value of metals produced was only $344,540 as compared to $1,205,850 in 1958, a decrease of 71.5 percent. The metals contributed only 0.07 percent of the value of all minerals produced in the state (Table 4, Fig. 3).
Since 1956, when Kansas produced 7,635 tons of recoverable lead valued at $2,397,390, lead production and value have progressively declined; 1959 production of 481 tons was valued at $110,630, decreases of 63 and 63.6 percent respectively from 1958 (Table 31). Only four lead mines, operated by four companies and several gougers, produced lead in 1959 as compared to 25 in the previous year. Currently lead mining in Kansas is at the lowest ebb in the history of metal mining in the state.
The Red Lead and Zinc Company of Baxter Springs was the principal lead producer in 1959, replacing the Eagle-Picher Mining and Smelting Company of Miami, Oklahoma, which ranked second, followed by Ora-Black of Cardin, Oklahoma. The only lead smelter operated in Kansas was the Eagle-Picher Mining and Smelting Company at Galena, Cherokee County. This company produced pigments and sulfuric acid. Lead pigments were also produced at Coffeyville, Montgomery County, by the Ozark Smelting & Mining Company. Mining equipment, facilities, and most of the leases in the Baxter Springs area of the National Lead Company of Fredericktown, Missouri, were acquired by the Eagle-Picher Mining and Smelting Company. National Lead Company also dismantled its Ballard No. 8 mill, moving it to southeastern Missouri.
Data on lead production in Kansas in 1958 and 1959 are presented in Table 31. Table 32 is a directory of lead producers in Kansas on record as of December 31, 1959.
Table 31—Quantity and value of lead and zinc produced in Kansas, 1958 and 1959
| Recoverable lead | Recoverable zinc | |||
|---|---|---|---|---|
| Tons | Value ($) | Tons | Value ($) | |
| 1958 | 1,299 | 303,966 | 4,421 | 901,884 |
| 1959 | 481 | 110,630 | 1,017 | 233,910 |
| Percent change from 1958 | -63.0 | -63.6 | -77.0 | -74.1 |
Table 32—Directory of lead and zinc producers in Kansas on record as of December 31, 1959
| Company | Address | Mine* |
|---|---|---|
| Ora-Black | Cardin, Oklahoma | Lindsey |
| The Eagle-Picher Mining and Smelting Company |
Miami, Oklahoma | Bird Dog |
| National Lead Company | Fredericktown, Missouri | Ballard |
| C. H. Rea | Baxter Springs | Robinson |
| Gougers | Various | |
| * All lead and zinc mines are in Cherokee County. | ||
Zinc, like lead, experienced a decided setback in production and value in 1959 when compared to 1958 and the entire 1950-59 decade. In 1959, Kansas produced 1,017 tons of recoverable zinc as compared to 4,421 tons in 1958, a decrease of 77 percent. Value of the recoverable zinc in 1959 was $233,910 compared to $901,884 in 1957, a decrease of 74.1 percent. The same companies that produced lead produced zinc in 1959.
The Cherryvale Zinc Company operates a smelting plant at Cherryvale, Montgomery County.
Data on zinc production in Kansas in 1958 and 1959 are given in Table 31 and a directory of zinc producers on record as of December 31, 1959, is presented in Table 32.
Table 33—Directory of Kansas producers of gypsum in 1959
| County | Company | Office address | Mine or plant |
|---|---|---|---|
| Barber | National Gypsum | 325 Delaware Ave., Buffalo, N.Y. |
Medicine Lodge |
| Marshall | Bestwall Gypsum | 120 E. Lancaster, Ardmore, Penn. |
Blue Rapids |
Expanded perlite and vermiculite are processed in Kansas from raw materials imported from other states. In 1959 the quantity of expanded vermiculite sold was greater by 55.5 percent than in 1958 and the value greater by 24.6 percent. Survey records on expanded vermiculate date back to 1954, when the quantity sold was 9.1 percent greater than in 1959. Greatest quantity sold was in 1956, when the quantity sold was approximately 20.8 percent more than in 1959.
Perlite tonnage and value in 1959 were less than in 1958 by approximately 43 and 16 percent respectively. The 43 percent decline in perlite tonnage is the greatest decline recorded since 1953, the first year of the Survey's record. On the other hand, the 16 percent decrease in the value of expanded perlite processed in 1959 is, with the exception of 1956, the least annual decline recorded by the Survey. A considerable increase in the price per ton of the processed perlite in 1959 is indicated.
Expanded perlite is processed by Panocalite Perlite, Inc., of Kansas City, Wyandotte County, and expanded vermiculite by the Dodson Manufacturing Company of Wichita. Values of perlite and vermiculite for 1959 are included in the total listed under "Undistributed" in Table 1. Among the uses of expanded perlite processed in Kansas are building plaster, concrete aggregate, soil conditioners, and filter aids. Expanded vermiculite is used primarily for concrete roof deck and floors and for insulation.
Production and value of volcanic ash in Kansas, formerly the most important state in the production of pumicite or volcanic ash, have declined to the point where they are negligible. Production in 1959 was 0.7 percent greater than in 1958 but value was 14.6' percent less. Only two producers of volcanic ash operated in 1959, the same as in the previous year. On the basis of information available, Kansas has produced a minimum cumulative total of 1,303,000 tons of volcanic ash from the time when production first started in 1910 until the end of 1959. The value of this volcanic ash is estimated at $4,500,000. Production and value of volcanic ash in the 1950-59 decade are estimated at 52,000 tons and $270,000 respectively (Table 35). The greatest production in the decade was in 1954, when 21,000 tons of volcanic ash was used in the rebuilding of Kansas highways.
Volcanic ash is known to occur at 160 localities in 39 counties. Currently, however, production is limited to Lincoln and Norton Counties. Extensive deposits of the ash are found in Meade County, which until 1956 produced the greatest amount of ash in the state. In 1956 the Cudahy Packing Company of Omaha, Nebraska, ceased mining operations at Meade and disposed of their properties to the Purex Corporation, Ltd., of Meade.
Kansas volcanic ash has been used as an abrasive, especially in scouring compounds and soaps; as an ingredient of ceramic glazes and ceramic bodies; as an additive to cement; as a raw material for manufacture of several types of lightweight aggregate, cellular blocks, and glass; as a sweeping compound; as a dressing for bituminous-matt roads; and as an inert filler (Carey and others, 1952, p. 3).
Most recent estimate of Kansas usable volcanic ash reserves is for 1952 (Carey and others, 1952, p. 40) when they were estimated at 20 million tons. Producers on record for 1959 are listed in Table 34.
Table 34—Directory of Kansas producers of volcanic ash or pumicite in 1959
| County | Company | Office address | Pit location (nearest town) |
|---|---|---|---|
| Lincoln | Ernest Hauzlicek | Wilson | Wilson |
| Norton | Wyandotte Chemical Corporation |
1609 Biddle Ave., Wyandotte, Mich. |
Calvert |
Salt brine for industrial use is produced by the Frontier Chemical Company of Kansas, Inc., Wichita, a division of the Vulcan Materials Company of Birmingham, Alabama. Although production of salt brine in 1959 was only 3.6 percent greater than in 1958, its value was approximately 145 percent greater than in the previous year. Salt brine production and value have steadily increased from 1955, the first year of production. Value of the salt produced is included in the total listed under "Undistributed" in Table 1. The salt obtained from brine pumped from the company's wells in Sedgwick County is used in the manufacture of industrial chemicals.
Dimension sandstone was produced by the Bandera Stone Quarry Company of 222 West 72nd Street, Kansas City, Missouri. The quarry is located near Redfield, Bourbon County. In 1959, production declined 34 percent and value declined 27 percent. The Bandera sandstone is used for building stone, including rough construction stone, sawed stone, and flagging stone. Value of dimension sandstone is included in the total listed under "Undistributed" in Table 1.
Data on hand on production and value of dimension sandstone in Kansas are incomplete and hence no analysis of trends in the dimension sandstone industry in the 1950-59 decade is made.
Two of the most important mineral resources of Kansas are water, both surface and underground, and soil. Water and soil are truly mineral commodities, but because of their nature and universal usage are difficult to evaluate as to quantity and value. Water, to a considerable extent, is a replenishable resource in that water supplies may be completely replenished in some geologic situations and only partly replenished in others. Soil lost by erosion is replaced only by slow soil-building processes. No data are at hand at present in regard to the actual quantity of soil that exists in Kansas. Without the soil that covers the 82,113 square miles of land surface (total area including water surface is 82,276 square miles), Kansas could not have produced $1 billion to $1.5 billion worth of agricultural products including livestock each year since 1950. The amount of available water and the quantity used or consumed in the state in 1953 were estimated by the Kansas Water Resources Fact-Finding and Research Committee in 1954. According to the survey, a total of 1,898 mgd (million gallons a day) was withdrawn from the available water resources, but the amount consumed and removed from the supply for all purposes amounted to 652 mgd, or 237,980 millions gallons per year. The actual value of the 237,980 million gallons consumed per year is not known. It is estimated (Foley, Smrha, and Metzler, 1955, p. 1) that city dwellers pay an average of only about $5 a year each for water, and rural residents somewhat less. On the assumption that 51 percent of the population is urban and 49 percent rural, the minimum value of water consumed is computed to be about $9,000,000 a year. This sum, however, does not include the value of water consumed by industry, which is estimated to pay an additional $27,000,000 a year, or about threefourths of the state's water bill. The figures cited are not intended to be exact, but they do suggest the magnitude of the value of water consumed in Kansas each year.
In addition to the minerals produced, there are other mineral commodities in Kansas that either have never been exploited or are not at present being produced on a commercial scale. Such minerals include aluminum from clays (Kinney, 1943, 1952), bentonite (Kinney, 1942; Ives and Hill, 1960), chalk (Runnels and Dubins, 1949), of which the state has virtually unlimited supplies, iron (Jewett and Schoewe, 1942, p. 103), limestone for the manufacture of lime (Ives and Runnels, 1960), magnesium (Schoewe, 1943; Jeffords, 1948), mineral water (Schoewe, 1953, p. 133), oil shale (Runnels and others, 1952), phosphate nodules (Runnels, 1949; Runnels and others, 1953), pyrite (Jewett and Schoewe, 1942, p. 168), rock asphalt (Jewett, 1940), and tripoli (Jewett and Schoewe, 1942, p. 168). Still other minerals are known to occur in Kansas, such as germanium (Schleicher and Hambleton, 1954; Schleicher, 1959), and uranium (Runnels, Schleicher, and Van Nortwick, 1953), but these have not been investigated sufficiently to show whether they exist in commercial quantities. Further study of these unexploited minerals in Kansas coupled with favorable economic conditions may eventually result in the production of some, if not all, of these mineral commodities.
In Kansas the 1950-59 decade is outstanding for the value of minerals produced. Of the total value of all minerals produced, 85.2 percent was received for mineral fuels-coal, gas, liquefied petroleum gases, and oil, and the associated products carbon black and helium; 13.2 percent for the nonmetals exclusive of fuels; and 1.6 percent for the metals (Fig. 4). Especially noteworthy is the fact that sales in the last decade are such a large fraction of the total cumulative income for almost a century of exploitation of minerals. Value of all minerals produced in the last decade is 45.9 percent of the cumulative total; value of mineral fuels is 48.7 percent of the cumulative total of mineral fuels; value of other nonmetals is 40.9 percent of the cumulative total; and of metals is 13 percent (Table 35, Fig. 5).
Figure 4—Trend of value of minerals produced in Kansas, 1950-59.
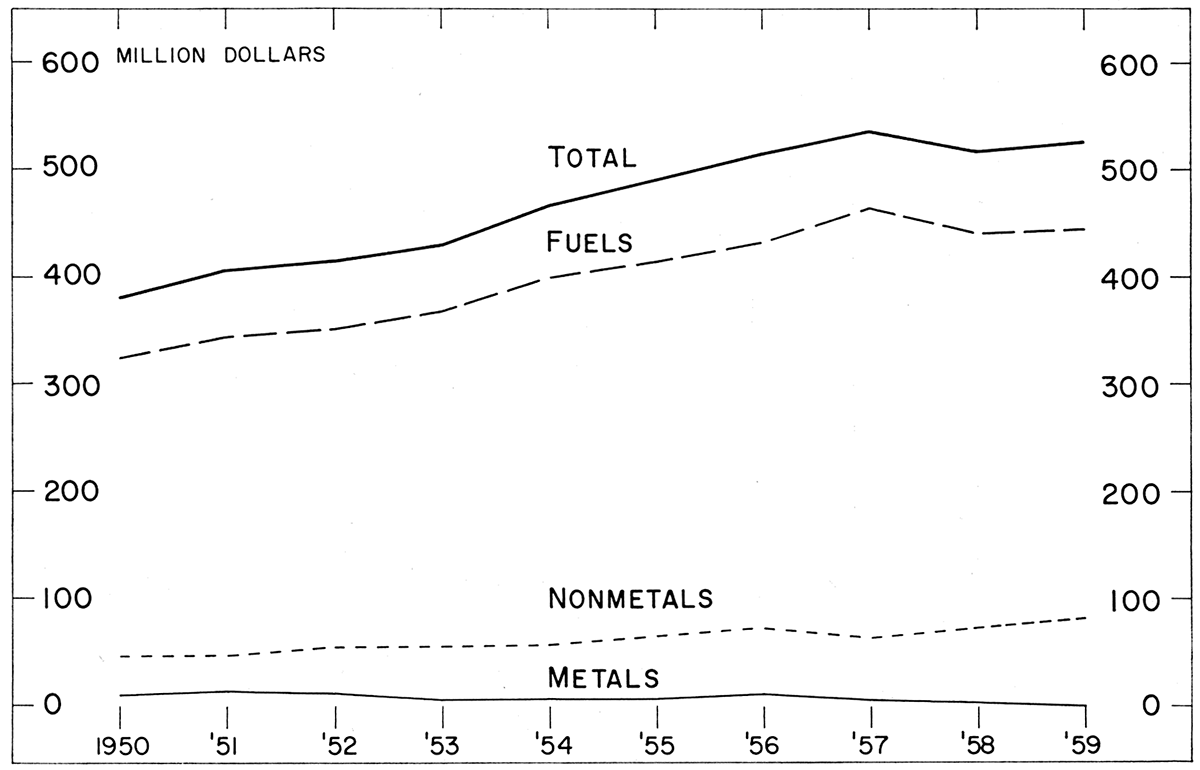
Table 35—Quantity and value of mineral production, by commodity, for 1950-1959 decade and total cumulative, in part estimated.
| Commodity | First record |
1950-59 | Cumulative to end 1959 | ||
|---|---|---|---|---|---|
| Quantity | Value ($) | Quantity | Value ($) | ||
| Carbon black, lb. | 1937 | 857,700,000 | 48,400,000 | 1,956,000,000 | 101,000,000 |
| Cement, 376-lb. bbl. | 1868 | 91,593,000 | 248,568,000 | 300,482,000 | 554,145,000 |
| Clay, ton | 1892 | a | 89,100,000 | a | 202,000,000 |
| Coal, ton | 1869 | 13,122,300 | 54,323,500 | 279,480,000 | 576,900,000 |
| Gypsum, tonb | 1889 | e | e | 8,339,000 | 11,000,000 |
| Helium, cu. ft. | 1903 | 319,160,100 | 4,735,104 | e | c |
| Lead, ton | 1876 | 50,900 | 15,214,000 | 643,900 | 87,630,000 |
| Natural gas, M cu. ft. | 1886 | 4,740,000,000 | 467,600,000 | 8,000,000,000 | 870,000,000 |
| L.P. gases, 42-gal. bbl. | 1913 | 48,000,000 | 117,000,000 | 82,000,000 | 187,000,000 |
| Petroleum, 42-gal. bbl. | 1889 | 1,177,500,000 | 3,294,500,000 | 3,130,000,000 | 6,350,000,000 |
| Salt, ton | 1887 | 8,870,000 | 83,925,000 | 42,600,000 | 215,500,000 |
| Sand and gravel, ton | 1865 | 99,400,000 | 65,500,000 | 198,000,000 | 113,000,000 |
| Stone, ton | 1865 | 105,200,000 | 128,400,000 | 166,900,000 | 225,000,000 |
| Volcanic ash, ton | 1910 | 52,000 | 270,000 | 1,303,000 | 4,500,000 |
| Zinc, ton | 1876 | 193,760 | 55,857,000 | 2,850,000 | 412,800,000 |
| (a) Data indeterminable; clay used in cement not segregated in early reports. (b) Estimated data. (c) Complete data not available. (d) Since 1919 only; earlier data not available. (e) Fewer than three producers; data may not be revealed. |
|||||
Figure 5—Quantity and value of individual minerals produced in Kansas, 1950-59, as percentage of cumulative production, 1865-1959.
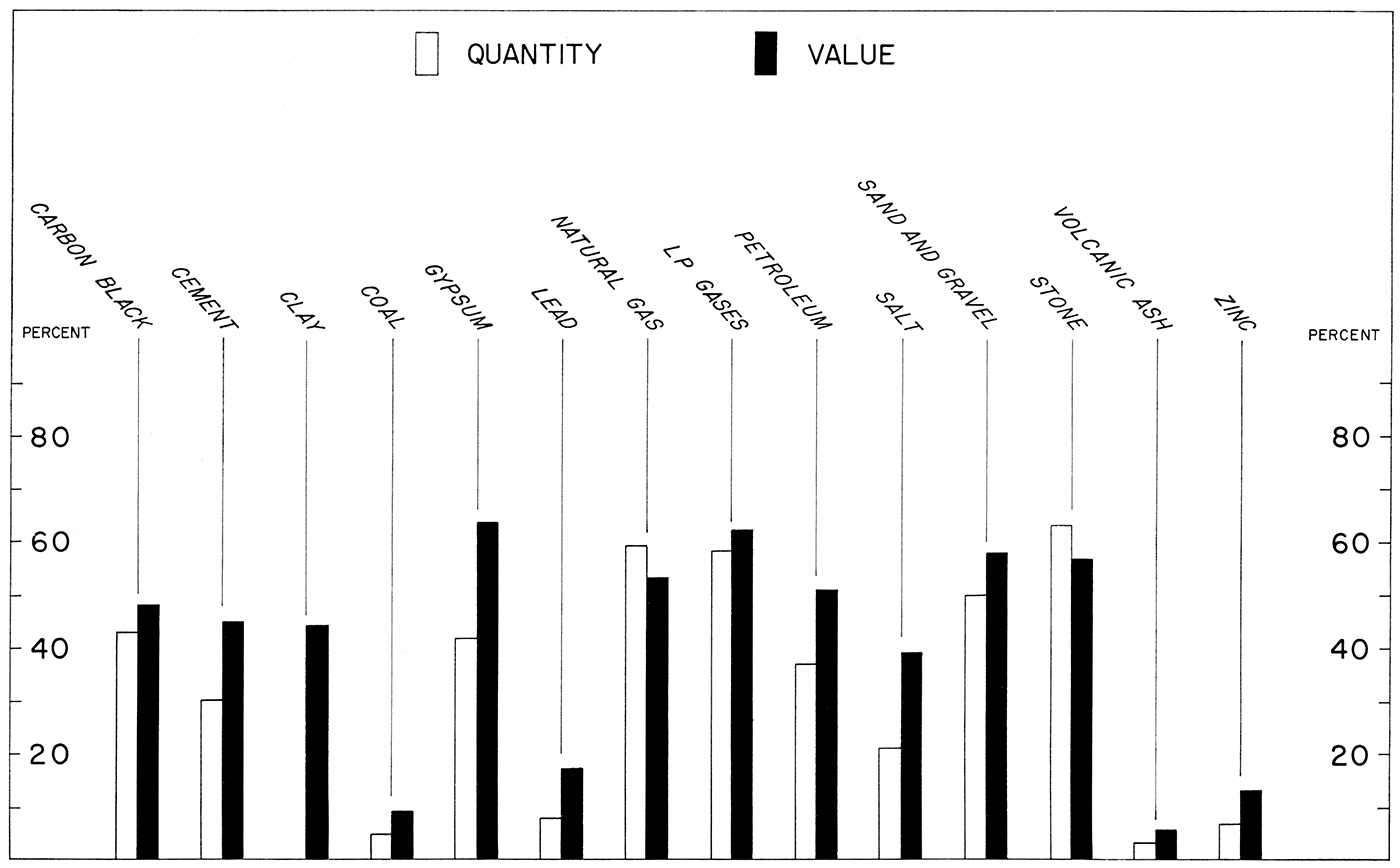
Table 35 presents a summary of the 1950-59 decade of quantity and value of mineral production, by commodity, with comparison to the cumulative quantity and value since production first started, based upon recorded and estimated data. Values of all mineral commodities except the metals (lead and zinc), coal, volcanic ash, and salt produced in 1950-59 exceed 40 percent of the cumulative value of these minerals, and value of salt approaches 40 percent. The trends of mineral production and value of the more important mineral commodities produced in the state in 1950 through 1959 are shown graphically in Figures 6, 7, and 8.
Figure 6—Trend of quantity and value of mineral fuels and associated products produced in Kansas, 1950-59.
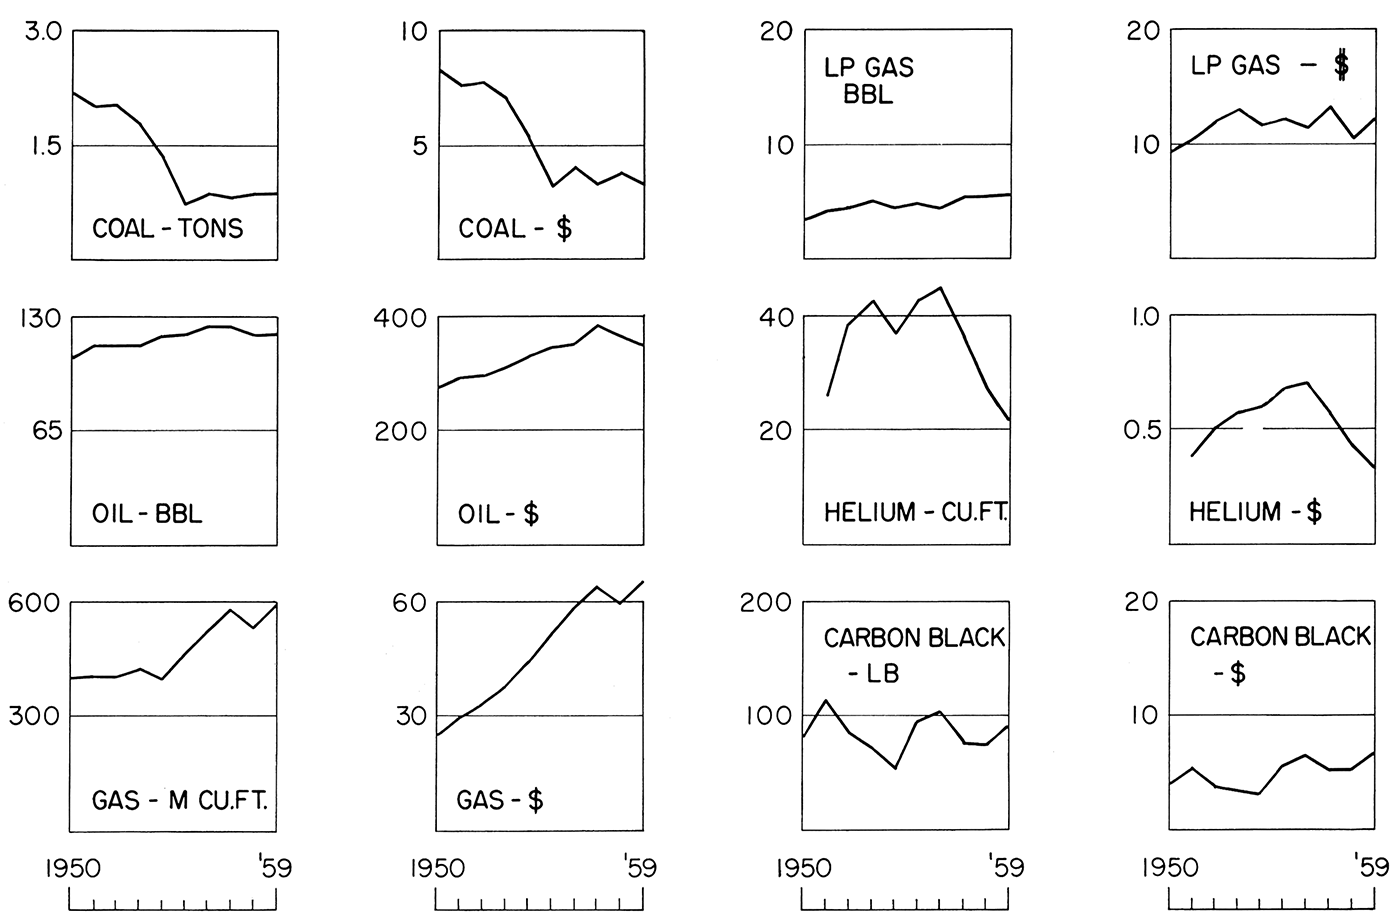
Figure 7—Trend of quantity and value of nonmetallic minerals produced in Kansas, 1950-59.
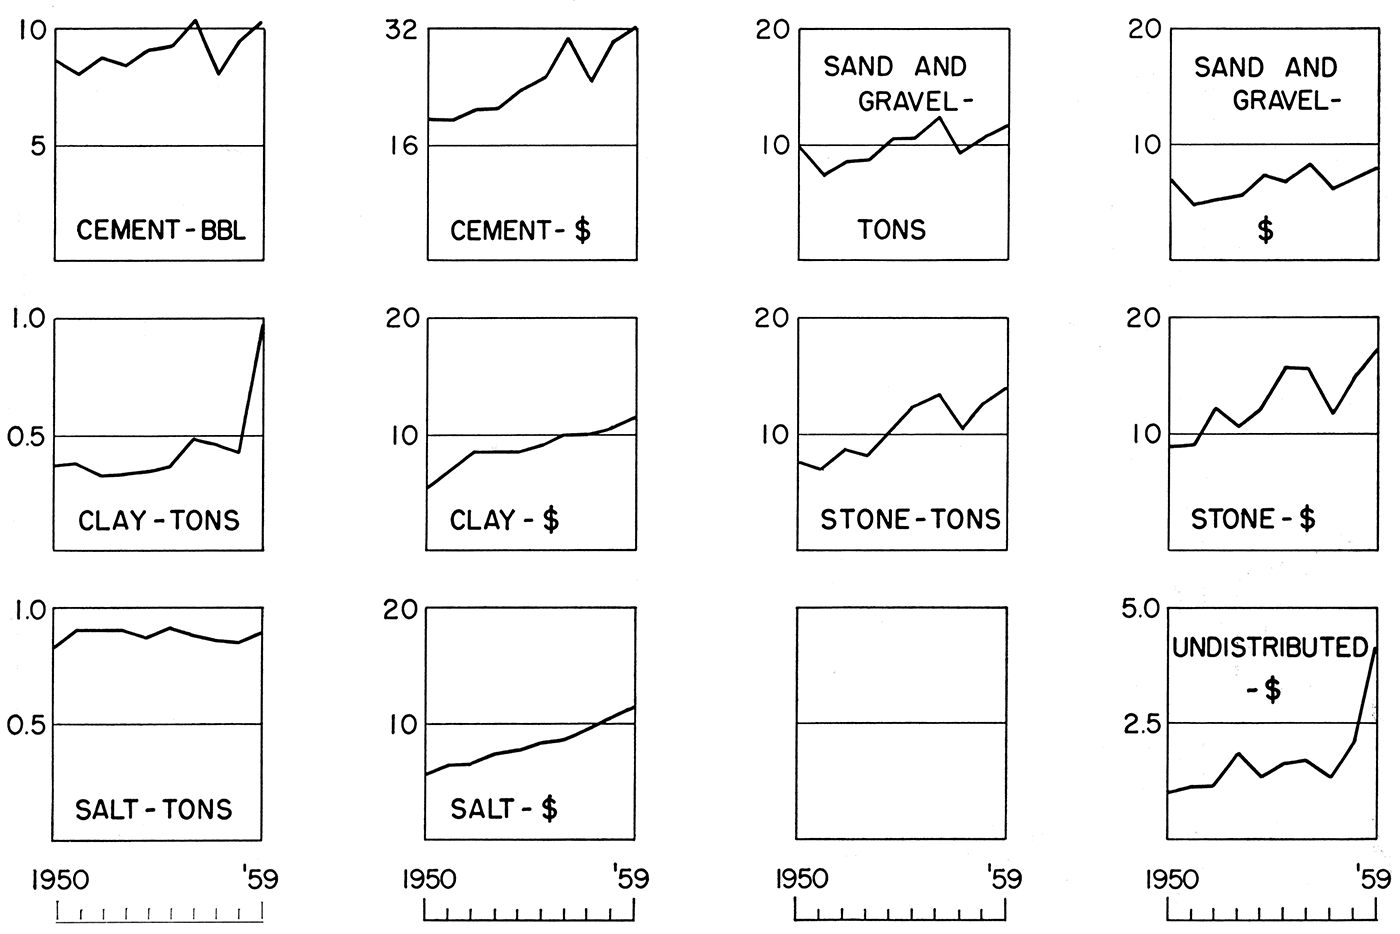
Figure 8—Trend of quantity and value of metals produced in Kansas, 1950-59.
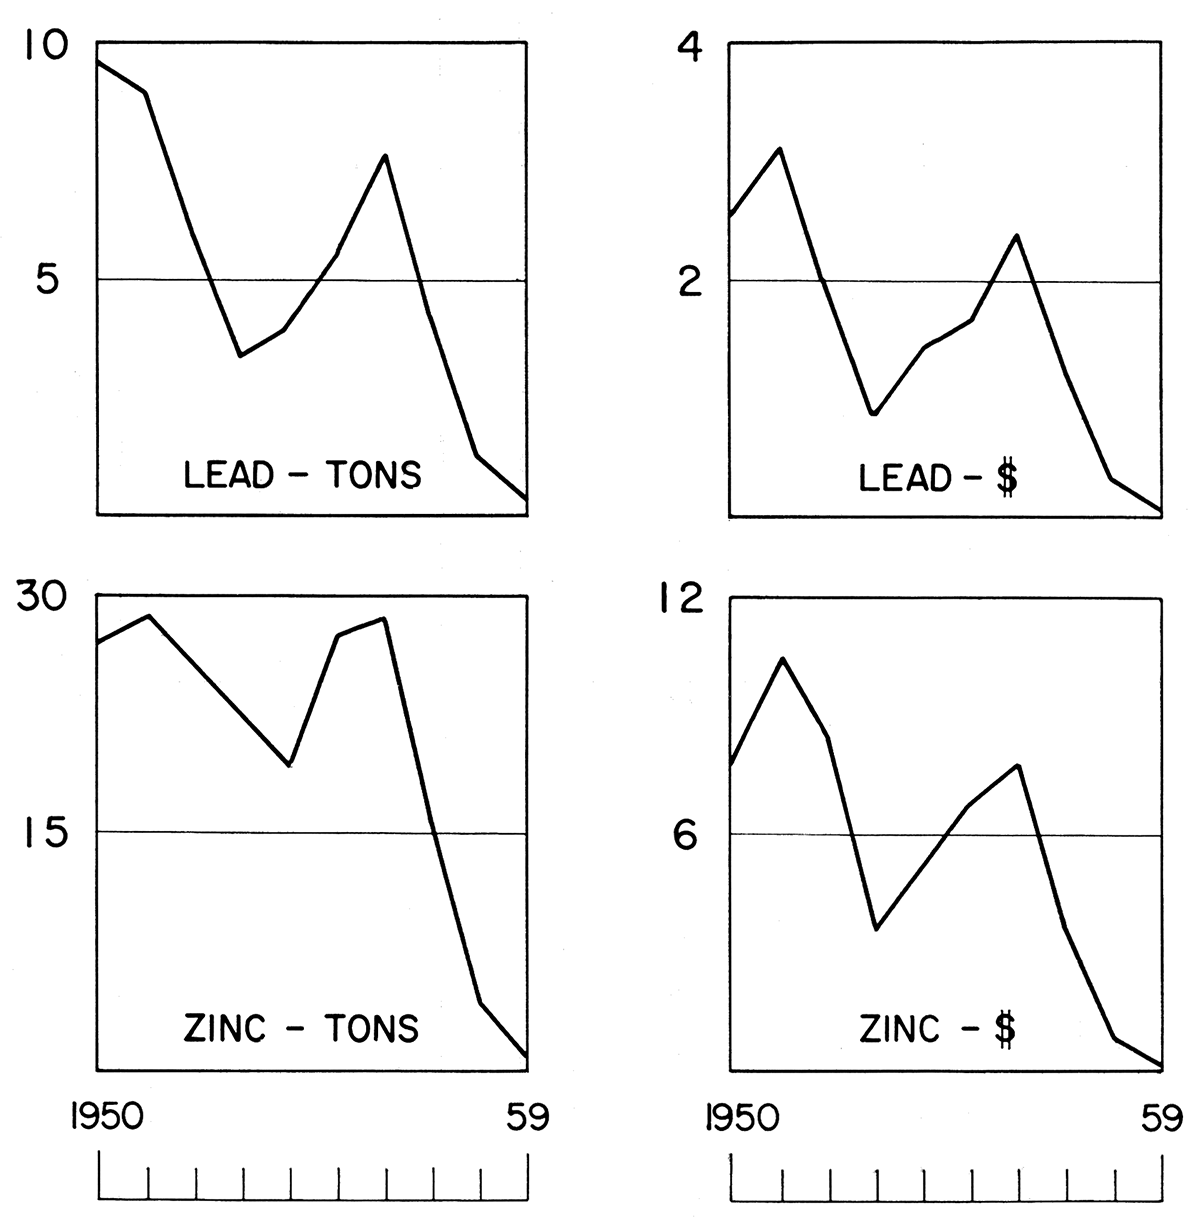
What the future decades may bring forth in the mineral industry in Kansas is, to be sure, unpredictable. It seems reasonable to assume, however, from data relative to mineral production and value for the 1950-59 decade (Fig. 4), that the mineral industry in the state is becoming stabilized. The current trend is toward a leveling off in the fuels category as shown especially by the decline in oil production and value during the last two years of the 1950-59 decade, a slow upward trend in the nonmetals, and a standstill or a very slow and insignificant rise in the metals.
Foley, F. C., Smrha, R. V., and Metzler, D. F. (1955) Water in Kansas, 1955, A report to the Kansas State Legislature: Kansas Water Resources Fact-Finding and Research Committee, Kansas Univ., p. 1-216, 53 fig.
Goebel, E. D., Hilpman, P. L., and Beene, D. L. (1959) Oil and gas developments in Kansas during 1958: Kansas Geol. Survey Bull. 138, p. 1-228, fig. 1-11, pl. 1-3.
Goebel, E. D., Hilpman, P. L., Beene, D. L., and Noever, R. J. (1960) Oil and gas developments in Kansas during 1959: Kansas Geol. Survey Bull. 147, p. 1-254, fig. 1-12, pl. 1-3.
Ives, W., and Runnels, R. T. (1960) Lime raw materials in the Kansas City area: Kansas Geol. Survey Bull. 142, pt. 3, p. 123-148, fig. 1-2, pl. 1. [available online]
Ives, W. and Hill, W. E. (1960) Occurrence and bleaching properties of some Kansas montmorillonite clays: Kansas Geol. Survey Bull. 142, pt. 4, p. 149-188, fig. 1-4.
Jeffords, R. M. (1948) Graphic representation of oil-field brines in Kansas: Kansas Geol. Survey Bull. 76, pt. 1, p. 1-12, fig. 1-6. [available online]
Jewett, J. M. (1940) Asphalt rock in eastern Kansas: Kansas Geol. Survey Bull. 29, p. 1-23, fig. 1-3, pl. 1-2. [available online]
Jewett, J. M., and Schoewe, W. H. (1942) Kansas mineral resources for wartime industries: Kansas Geol. Survey Bull. 41, pt. 3, p. 69-108, fig. 1-13. [available online]
Kinney, E. D. (1942) Kansas bentonite, its properties and utilization: Kansas Geol. Survey Bull. 41, pt. 9, p. 349-367, fig. 1, pl. 1-2. [available online]
Kinney, E. D. (1943) A process for extracting alumina from Kansas clay: Kansas Geol. Survey Bull. 47, pt. 4, p. 113-136.
Kinney, E. D. (1952) Amenability of certain Kansas clays to alumina extraction by the lime-sinter process: Kansas Geol. Survey Bull. 96, pt. 7, p. 301- 328, fig. 1-3.
Runnels, R. T. (1949) Preliminary report on phosphate-bearing shales in eastern Kansas: Kansas Geol. Survey Bull. 82, pt. 2, p. 37-48, pl. 1-2. [available online]
Runnels, R. T., and Dubins, I. M. (1949) Chemical and petrographic studies of the Fort Hays Chalk in Kansas: Kansas Geol. Survey Bull. 82, pt. 1, p. 1-36, fig. 1-6, pl. 1. [available online]
Runnels, R. T., Kulstad, R. O., McDuffee, C., and Schleicher, J. A. (1952) Oil shale in Kansas: Kansas Geol. Survey Bull. 96, pt. 3, p. 157-183, fig. 1-2, pl. 1-3. [available online]
Runnels, R. T., Schleicher, J. A., and Van Nortwick, H. S. (1953) Composition of some uranium-bearing phosphate nodules from Kansas shale: Kansas Geol. Survey Bull. 102, pt. 3, p. 93-104, fig. 1-3. [available online]
Schleicher, J. A. (1959) Germanium in Kansas coals: Kansas Geol. Survey Bull. 134, pt. 4, p. 161-179, fig. 1-2. [available online]
Schleicher, J. A., and Hambleton, W. W. (1954) Preliminary spectrographic investigation of germanium in Kansas coal: Kansas Geol. Survey Bull. 109, pt. 8, p. 113-124, fig. 1-2. [available online]
Schoewe, W. H. (1943) Kansas oil field brines and their magnesium content: Kansas Geol. Survey Bull. 47, pt. 2, p. 37-76, fig. 1-3.
Schoewe, W. H. (1953) The geography of Kansas, pt. 3, hydrogeography: Kansas Acad. Sci. Trans., v. 56, no. 2, p. 131-190, fig. 71-84.
Kansas Geological Survey
Placed on web Jan. 10, 2019; originally published Dec. 31, 1960.
Comments to webadmin@kgs.ku.edu
The URL for this page is http://www.kgs.ku.edu/Publications/Bulletins/142_6/index.html