Kansas Geological Survey, Bulletin 142, pt. 4, originally published in 1960
Originally published in 1960 as Kansas Geological Survey Bulletin 142, pt. 4. This is, in general, the original text as published. The information has not been updated. An Acrobat PDF version (4.2 MB) is also available.
Six deposits of clay, previously termed "bentonite", were examined and sampled for determination of their extent and quality. These deposits occur (1) in the Neogene Ogallala Formation, (2) at the Neogene-Cretaceous unconformity, and (3) in Cretaceous shales" Laboratory analyses indicated the principal constituent of the clays to be calcium montmorillonite. Of two deposits in Clark County, one has estimated reserves of 500,000 tons and the other 1,200,000 tons. Examination of an occurrence in Graham County indicates little economic potential. The Long Island region of Phillips County has twelve known exposures of clay and may contain large deposits but is currently under lease. Three deposits are known in sections 9, 10, and 11, T. 1 S., R. 18 W., Phillips County. The probable reserves in sec. 10 are estimated at 2,200,000 tons and in sec. 11 at 3,700,000 tons. A large area in Wallace County shows scattered exposures of clay, but delineation of distinct deposits was not possible.
Thirteen clay samples from these deposits were tested to ascertain relative bleaching power. Several different oils served as standards for tests of the clay in natural, heat-activated, and chemically activated states. All clays showed some bleaching ability in the natural state, but activation increased the bleaching power. These clays seemingly are suitable for commercial and industrial uses.
Industrial use of montmorillonitic clay has increased during the last decade (Gunsallus and Brett, 1958, fig. 2). Accordingly, studies of montmorillonitic clay found above or below the disconformity between the Ogallala Formation (Pliocene) and several Cretaceous formations in Clark, Graham, Phillips, and Wallace Counties, Kansas (Fig. 1), were undertaken to determine abundance and, where possible, mode of occurrence. Samples from Phillips, Wallace, and Clark Counties tested for bleaching properties gave promising results.
Figure 1—Map of western Kansas showing location of clay deposits investigated.
The clay discussed in this report commonly has been termed "bentonite". The name bentonite was first applied to a colloidal sodium montmorillonite clay in the Fort Benton beds (Cretaceous) of Wyoming. This clay swells to several times its original volume when placed in water, forms thixotropic (having the property of becoming fluid when shaken) gels, and results from the alteration of volcanic ash. Mineralogical use of the name bentonite has been extended to other montmorillonites formed by alteration of volcanic ash (Grim, 1953, p. 361). The U. S. Bureau of Mines (de Polo, 1960, p. 3) and many industrial users have extended the name bentonite to montmorillonitic clays regardless of origin. In this report, the term "bentonitic clay" is used in preference to bentonite because direct evidence is lacking that the clays are definitely the product of alteration of volcanic ash, and these same clays are also termed "montmorillonitic clays" because presence of montmorillonite as a principal constituent in most samples had been established.
Montmorillonite clays, usually divided into two main groups based on presence or lack of marked swelling in water, have a long history of industrial usage, particularly in the petroleum industry. Swelling montmorillonite or sodium bentonite has no bleaching properties. No large quantities of sodium bentonite are known in Kansas; the main sources of supply are Wyoming and South Dakota.
Nonswelling montmorillonite is used widely as a bleaching agent and cracking catalyst in the petroleum industry (Bechtner, 1949, p. 125; Klinefelter and Hamlin, 1957, p. 10) and as filler in cosmetics, insecticides, foundry facings, and floor sweeps. Clay-bonded sand molds for casting metals have a long history of use, and nonswelling montmorillonite has become increasingly important as a bonding agent. Both swelling and treated nonswelling montmorillonite have potential use as a sealer to prevent excessive seepage loss in ponds and irrigation ditches. Nonswelling montmorillonite is effective in removal of sediment and bacteria in water-purification processes (Weir, 1939). Studies show that these clays have desirable bleaching properties in either natural or activated form in that they remove coloring matter, dyes, and suspended solid impurities from both mineral and vegetable oils.Numerous workers have reported exposures of "bentonite" in Wallace and Phillips Counties (Elias, 1931; Landes, 1937; Landes and Keroher, 1942; Schoewe, 1942). Byrne, Coombs, and Matthews (1951, p. 7) report bentonitic clay in the upper part of the Pierre Shale in Graham County. Frye and Leonard (1949, p. 39) comment on bentonitic clay in the Ogallala Formation of Norton and Phillips Counties.
Some testing of the deposits in Phillips County was done by the Works Project Administration in 1938 under the direction of Norman Plummer and J. F. Romary of the State Geological Survey of Kansas. Logs and field notes from this investigation are available for examination and were utilized in the preparation of this report.
In addition, many ground-water studies published by the State Geological Survey contain references to "bentonite" penetrated in test holes. In general, however, the thinness or inaccessibility of these beds makes them economically unimportant.
The only report stressing possible industrial utilization of Kansas montmorillonitic clay was that by Kinney (1942) in which locations of known deposits were cited and results of bleaching and bonding tests were given. Kinney's work indicated that these clays may have value especially as bleaching agents and as bonding agents in foundry sand.
Known clay exposures were examined and adjacent areas explored during the summers of 1955 and 1956. Sections were measured and samples collected for preliminary laboratory study. Areas having sufficient thickness of relatively uncontaminated clay were explored by auger and rotary drill to determine the extent and thickness of clay and overburden. Channel samples from outcrops and continuous composite samples from test holes were taken for laboratory investigation of bleaching properties.
Mineralogy of the samples was studied by x-ray diffraction and differential thermal analysis. X-ray diffraction data were obtained with a General Electric XRD-3 proportional counting diffractometer. Patterns were run at scanning rates of 2° and 0.2°2θ per minute using a 10 beam slit, 0.2° detector slit, and nickel-filtered copper radiation. The x-ray unit was operated at 50 kilovolts and 15 milliamperes. By settling the clay through water onto glass slides, oriented slides of clay particles having equivalent spherical diameters of 2 microns or less were prepared for x-ray examination of some of the samples. For determination of the non-clay mineral content (e.g., quartz and feldspar), the clay samples were prepared by grinding them to pass a 200-mesh screen and then pressure-orienting them in plastic sample holders. In order to verify the presence of some clay minerals, the slides and packed samples were treated with glycerol, heated to 450° or 575° C, and reexamined on the diffractometer.
The differential thermal analysis apparatus used consists of a program controller, recorder, and preamplifiers. The unit is similar to that described by Kerr and Kulp (1948) and was obtained from Leeds and Northrup Company. Furnace temperatures are recorded on a Micromax, and differential temperatures on a Speedomax. The furnace is a platinum-wound tube enclosed in suitable insulation. The sample holder is made of sintered alumina. Both furnace and sample holder were fabricated in the Ceramic Laboratory of the State Geological Survey. Alumina was used as the inert reference, and the furnace thermocouple was placed between the sample and the inert reference.
Chemical analyses of samples tested in the laboratory were made to provide data on changes induced by treatment of the clay samples in preparing activated bleaching agents. The chemical analyses were made in the Geochemistry Laboratory of the Kansas Geological Survey using procedures described by R. T. Runnels (Plummer and others, 1954).
Details of laboratory tests of bleaching qualities of the clay samples are discussed in the last part of the report. Recent techniques and equipment were used in the tests, and many methods once regarded as standard were reviewed, tried, and discarded for various reasons (principal ones being erroneous results and complexity of technique). The more complex methods seemingly are best suited to a pilot-plant scale of operations. Tests were made of both untreated and beneficiated clay samples.
Field assistance by J. L. Kendall and R. S. Grinnell is appreciated. Landowners in all areas investigated were most cooperative; D. E. Williams, of Long Island, and Merrill Gauss, of Sharon Springs, were especially helpful. Roy McDowell, of Phillipsburg, greatly assisted the start of Phillips County studies.
The Cooperative Refinery Association, Coffeyville; SoconyMobil Oil Company; Standard Oil Company; and Mrs. Tucker's Products, a division of Anderson, Clayton and Co., donated oils for the bleaching tests. The Minerals and Chemicals Corporation of America provided attapulgite clay and the Filtrol Corporation provided Filtrol Grade 13 for use as test standards.
Contributions by State Geological Survey personnel include: chemical analyses by Wanda Waugh and O. K. Galle, determination of properties of oil standards by Floyd Preston, x-ray diffraction analyses by Ada Swineford and P. C. Franks, and suggestions on procedure by Norman Plummer. R. T. Runnels initiated the clay study and, in addition, ran the differential thermal analyses used.
The deposits of clay examined for this report occur as (1) lenses within the Neogene Ogallala Formation, (2) lenses at the base of the Ogallala Formation where the Ogallala rests on Cretaceous rocks, and (3) local beds in the Cretaceous Kiowa and Pierre Shales (Table 1). The beds of clay within the Kiowa and Pierre Shales may have formed as alteration products of volcanic ash that fell into the Cretaceous seas. The deposits associated with the Ogallala Formation, which seemingly hold the greatest reserves of bleaching clay, may have more than one mode of origin .. Elias (1931, p. 157) postulated that the Wallace County clays may "… represent an intimate mixture of altered volcanic ash of the Ogallala with the clayey products of disintegration of the Pierre … ". Frye and Leonard (1949, p. 39) commented that "occurrence of this clay at the base of the Ogallala overlying Pierre shale in some places and upper Niobrara at other places suggests it may be related to the erosional surface below the Ogallala formation". The presence of bentonitic clay in the Ogallala Formation is discussed by Frye, Leonard, and Swineford (1956) who stated (p. 23) that "bentonite lentils are seemingly restricted to the Valentine member … ; the alteration of the ash to montmorillonite may be related to high ground-water levels … during deposition of the Valentine and to the availability of magnesium ion from nearby Cretaceous marine shales".
Table 1—Generalized section of outcropping rock units of western Kansas. (From Jewett, 1959)
| System | Series | Formation |
|---|---|---|
| Neogene | Pleistocene | undifferentiated |
| Pliocene | Ogallala Formation | |
| unconformity | ||
| Cretaceous | Upper | Pierre Shale |
| Niobrara Chalk | ||
| Carlile Shale | ||
| Greenhorn Limestone | ||
| Graneros Shale | ||
| Lower (?) | Dakota Formation | |
| Lower | Kiowa Shale | |
| Cheyenne Sandstone | ||
The clays are generally pale yellowish white or pale green. When saturated with water, the clay feels like soap that has been left standing in water and, when dry, it feels like dry soap. Where naturally moist, these clays are plastic. Outcrops show a distinctive "crackle" pattern of shrinkage cracks and are loose and "fluffy" when dry. Commonly, unweathered clay immersed in water disperses to produce a cloudy fluid and loose sediment.
X-ray diffraction and differential thermal analyses of clay samples indicate that the principal constituent is calcium montmorillonite. Most samples contain some illite and all contain some quartz. The relative amounts of the minerals found in the samples are shown in Table 2.
Table 2—Location, description, and mineralogy of the clay samples tested for bleaching properties.
| Lab. no. | Sample type | Thickness | Location |
|---|---|---|---|
| 55230 | Channel(1) | 7.5 | Phillips Co., cen. NW NW sec. 31, T. 1 S., R. 19 W. |
| 55231 | Channel | 8.0 | Phillips Co., cen. W2 NW sec. 11, T. 1 S., R. 18 W. |
| 55232 | Channel | 5.5 | Phillips Co., cen. N2 NE NE sec. 35, T. 1 S., R. 20 W. |
| 55234 | Channel | 8.0 | Clark Co., cen. S2 NE SW sec. 34, T. 31 S., R. 23 W. |
| 55235 | Channel | 3.5 | Clark Co., cen. S2 SW NW sec. 18, T. 32 S., R. 22 W. |
| 56119 | Channel | 5.5 | Wallace Co., cen. SW SW sec. 19, T. 12 S., R. 41 W. |
| 56120 | Channel | 8.0 | Wallace Co., cen. N2 SW SW sec. 29, T. 12 S., R. 41 W. |
| 56121 | Channel | 4.0 | Wallace Co., cen. N line NE NE sec. 12, T. 12 S., R. 42 W. |
| 56122 | Channel | 1.5 | Wallace Co., cen. SE NE SE NE sec. 2, T. 12 S., R. 42 W. |
| 56147 | Composite(2) | 17.9 | Phillips Co., cen. NE SE sec. 10, T. 1 S., R. 18 W. |
| 56206 | Composite | 8.8 | Phillips Co., cen. N2 NE NE sec. 35, T. 1 S., R. 20 W. |
| 56207 | Channel | 7.0 | Phillips Co., cen. S line SW SE NW sec. 25, T. 1 S., R. 20 W. |
| 56208 | Composite | 16.0 | Phillips Co., cen. NW SW NW sec. 11, T. 1 S., R. 18 W. |
| (1) All channel samples are from surface exposures. (2) All composite samples are from bore holes. |
|||
| Mineral | Sample no. | ||||||||||||
|---|---|---|---|---|---|---|---|---|---|---|---|---|---|
| 55230 | 55231 | 55232 | 55234 | 55235 | 56119 | 56120 | 56121 | 56122 | 56147 | 56206 | 56207 | 56208 | |
| Montmorillonite | M | M | M | M | M | S | M | C | M | M | M | M | M |
| Illite | C | C | M | C | S | M | C | M | M | S | T | S | T |
| Kaolinite | S | M | S | M | C | S | |||||||
| Mixed-layer clay | S | S | |||||||||||
| Quartz | C | C | C | C | S | C | S | C | S | S | S | S | M |
| Feldspar | S | C | S | S | T | C | T | T | |||||
| Chlorite | S | ||||||||||||
| Calcite | C | S | |||||||||||
| M indicates main constituent, C is common, S is sparse, and T is trace. | |||||||||||||
Reserves are estimated for each deposit where sufficient control data are available. Three categories of reserves are commonly differentiated (Blondel and Lasky, 1956):
Proven reserves—A volume of mineral material blocked out in three dimensions by actual mining operations or by drilling, where the geological factors that limit the deposit are definitely known and where the chance of failure of the material to reach these limits is remote.
Probable reserves—Data indicate that the conditions are such that the mineral material will probably be found, but the extent and limiting conditions cannot be precisely defined. The term is also used to mean a body of material cut by scattered drill holes too widely spaced, however, to assure continuity.
Possible reserves—The relations of the land to adjacent known bodies and to geologic structures warrant some presumption that the material is present but lack of exploration and development data precludes anything like certainty of its actual location or extent. Generally, it is not desirable to assign tonnage figures to such reserves.
The data available were inadequate to regard the reserves as proven, thus the estimated tonnages of clay are presented as probable reserves. For the purpose of estimating probable reserves, some arbitrary decisions, based on observations in the field, were made. A radius of 600 feet was selected as the maximum reliable extent of clay about a drill hole or outcrop. Individual outcrops or drill holes that seemed, from field observations, not representative of any appreciable quantity of clay were excluded when reserves were estimated. Inasmuch as observed deposits were lenticular, the minimum thickness of clay in each area was the figure used in reserve computations. The fresh clay was assigned a specific gravity of 2.0 (Lange, 1956, p. 180), yielding a density of 125 pounds per cubic foot. Weights were converted to short tons for the final estimated reserve.
Deposits of montmorillonitic clay were examined in sec. 7 and 18, T. 32 S., R. 22 W., and sec. 34, T. 31 S., R. 23 W. These deposits hold probable reserves of clay estimated at 500,000 and 1,200,000 short tons respectively.
The area, which is located on the rim of the Ashland Basin (Smith, 1940, p. 23), is 4.5 miles north along a county road from its intersection with U. S. Highway 160 on the east edge of Ashland. The Ogallala Formation, which consists of a succession of lenticular sandstone, siltstone, and conglomerate layers showing various degrees of induration, is the "rimrock" of the basin and rests unconformably on Kiowa Shale. The Kiowa, a dark-gray clay shale, is underlain by a few feet of white Cheyenne (?) sandstone, which in turn overlies red siltstones and shales of the Permian System.
The best exposure of clay is in a gully southeast of the road, where the following section was measured.
| Section down east wall of gully in cen. S2 SW NW sec. 18, T. 32 S., R. 22 W., Clark County. (Measured by William Ives and Jack L. Kendall.) | Thickness, feet |
||
|---|---|---|---|
| Cretaceous—Lower | |||
| Kiowa Shale | |||
| 6. Shale, dark gray, black, and brownish gray; weathers into blocky fragments; grades into soil above | 2.0 | ||
| 5. Clay, brown at top, light gray to white below; slick soapy feel; uneven top; weathers to blocky fragments (sample 55235) | 3.5 | ||
| 4. Shale, dark gray to black, weathers light to dark gray; has laminae and thin beds of fine sandstone and randomly oriented seams of powdery to hard reddish-brown ironstone; scattered randomly oriented gypsum plates, locally abundant; weathering emphasizes gypsiferous portion slightly and produces blocky fragments; lower contact uneven | 18.6 | ||
| 3. Clay, light gray to creamy white, flecked with orange; soapy; breaks into blocky fragments; sour taste | 0.25 | ||
| 2. Shales, like unit 4 above | 14.1 | ||
| Cheyenne Sandstone (?) | |||
| 1. Sandstone, white, brownish surface stains; fine; friable | 2.0 | ||
Three other exposures of clay were found in sec. 18. On the side of a low hill about 600 feet SSE of the measured section site, 2.2 feet of clay was exposed in the Kiowa Shale. The other two exposures were northwest of the county road and on the side of a low hill. Two feet of clay, which is white in the lower 0.6 foot and light brownish gray above, was exposed in the cen. SE NW SW NW of the section. The westernmost exposure, about 350 feet SW of the preceding, showed only 0.65 foot of pinkish-white clay. In both exposures, the clay is clearly in the Kiowa Shale.
Two test holes were put down with a rotary drill about 0.7 mile north of the measured section site to determine continuity of the clay. The test hole locations are on the upland surface that terminates in the rim of the Ashland Basin.
| Sample log of test hole in the cen. N2 SW SE SW sec. 7, T. 32 S., R. 22 W., Clark: County; drilled June 1957 | Thickness, feet |
Depth, feet |
||
|---|---|---|---|---|
| Soil, dark brown, clayey to silty; sandy near base | 9 | 9 | ||
| Neogene—Pliocene | ||||
| Ogallala Formation | ||||
| Sand, tan, fine, silty | 11 | 20 | ||
| Sand, tan, medium, some chunks partly cemented by caliche; sparse fine gravel | 37 | 57 | ||
| Gravel, fine to medium, and medium to coarse sand; sparse fragments of siltstone and iron-cemented sand | 31 | 88 | ||
| Clay, orange brown, blocky, probably sandy | 2 | 90 | ||
| Sand, tan, medium, mostly quartz | 5 | 95 | ||
| Clay, mostly white, some gray, bentonitic | 7 | 102 | ||
| Cretaceous—Lower | ||||
| Kiowa Shale | ||||
| Shale, black, plastic | 8 | 110 | ||
| Sample log of test hole in the cen. E2 SW sec. 7, T. 32 S., R. 22 W., Clark County, Kansas; drilled June 1957. | Thickness, feet |
Depth, feet |
||
|---|---|---|---|---|
| Soil, dark brown, clayey to sandy | 4 | 4 | ||
| Neogene—Pliocene | ||||
| Ogallala Formation | ||||
| Sandstone, light tan, hard, white caliche cement, which decreases downward | 56 | 60 | ||
| Sandstone, tan to light brown, medium- to coarse-grained; fine pebbles common, poorly cemented with caliche | 35 | 95 | ||
| Conglomerate, fine pebbles, loosely cemented, very sandy | 8 | 103 | ||
| Clay, white and light gray, some tan streaks; bentonitic | 5 | 108 | ||
| Cretaceous—Lower Kiowa Shale | ||||
| Shale, black, tough, contains a thin bentonitic clay | 30 | 138 | ||
| Cheyenne Sandstone (?) | ||||
| Sandstone, white, very hard, very fine to fine grained, very calcareous | 7 | 145 | ||
| Permian—Guadalupian | ||||
| Whitehorse Formation | ||||
| Siltstone, red, some green; sandy | 5 | 150 | ||
The outcrop area was not included in calculating probable reserves, because the clay is either too thin or too near the hilltop to add any appreciable amount. Only about 72 percent of the area projected around the test holes can contain clay, because part of the ground surface within the 600-foot radius is topographically lower than the clay. The estimated probable reserve is 500,000 short tons.
The area is 8.5 miles north along a county road from its intersection with U.S. Highway 160 at the west city limits of Ashland. The outcropping rock units are the same and of similar lithology as those described for sec. 7 and 18 above. A shallow roadcut exposes about 8 feet of clay (sample 55234) where the county road crosses the upper rim of a flattopped spur inside the rim of the Ashland Basin. No other exposures were found in the vicinity. A rotary test hole, the log of which is given below, was drilled about 75 feet east of the roadcut exposure.
| Sample log of test hole in the cen. S2 NE SW sec. 34, T. 31 S., R. 23 W., Clark County; drilled June 1957. | Thickness, feet |
Depth, feet |
||
|---|---|---|---|---|
| Soil | 1 | 1 | ||
| Cretaceous—Lower Kiowa Shale | ||||
| * Clay, whitish yellow to brownish yellow, bentonitic, silty, blocky; intercalated laminae of orange siltstone | 24 | 25 | ||
| Shale, black, tough, plastic, sparse thin beds of sandstone; thin gypsum bed at 60 ft.; lower two-thirds has sparse pyrite crystals and intercalated thin beds of dark-gray sandstone | 119 | 144 | ||
| Cheyenne Sandstone (?) | ||||
| Sandstone, white, hard, medium grained | 4 | 148 | ||
| Permian—Guadalupian | ||||
| Whitehorse Formation | ||||
| Siltstone, red, clayey | 2 | 150 | ||
| *The age of this bentonitic clay is uncertain. It may be a bed in the Kiowa Shale, a product of weathering of the pre-Ogallala surface, an alteration product of volcanic ash that fell during the Late Cretaceous or Paleogene, or even a basal Ogallala deposit | ||||
Two other test holes were drilled on the upland surface to the north to investigate continuity, thickness, and overburden of the clay layer.
| Sample log of test hole in the cen. W2 SE NW sec. 34, T. 31 S., R. 23 W., Clark County; drilled June 1957. | Thickness, feet |
Depth, feet |
||
|---|---|---|---|---|
| Neogene—Pliocene | ||||
| Ogallala Formation | ||||
| Sandstone, white, fine grained, caliche cemented, hard; fragments of iron-cemented dark-brown sandstone common | 12 | 12 | ||
| Siltstone, gray green and brown, clayey; intercalated White fine sandstone | 20 | 32 | ||
| Cretaceous—Lower | ||||
| Kiowa Shale | ||||
| *Clay, yellow brown and gray, bentonitic, somewhat silty; intercalated thin layers of blue-gray calcite-cemented fine-grained sandstone | 12 | 44 | ||
| Shale, black, plastic | 6 | 50 | ||
| *The age of this bentonitic clay is uncertain. It may be a bed in the Kiowa Shale, a product of weathering of the pre-Ogallala surface, an alteration product of volcanic ash that fell during the Late Cretaceous or Paleogene, or even a basal Ogallala deposit | ||||
| Sample log of test hole in the cen. N line NE SE NW sec. 34, T. 31 S., R. 23 W., Clark County; drilled June 1957. | Thickness, feet |
Depth, feet |
||
|---|---|---|---|---|
| Soil, dark gray, clayey to sandy | 4 | 4 | ||
| Neogene—Pliocene | ||||
| Ogallala Formation | ||||
| Sandstone, light tan, hard, medium grained, caliche cemented; sparse fragments of iron-cemented sandstone | 59 | 63 | ||
| Cretaceous—Lower Kiowa Shale | ||||
| *Clay, brownish gray to greenish gray, bentonitic, silty; intercalated thin layers of yellow sandstone | 20 | 83 | ||
| Shale, black, tough, lowermost 10 feet contains thin yellow sandstone layers | 82 | 165 | ||
| *The age of this bentonite clay is uncertain. It may be a bed in the Kiowa Shale, a product of weathering of the pre-Ogallala surface, an alteration product of volcanic ash that fell during the Late Cretaceous or Paleogene, or even a basal Ogallala deposit. | ||||
The topography around the exposure and the adjacent test hole shows that they represent only an insignificant amount of clay, and thus they were excluded when probable reserves were estimated. The clay has been eroded from part of the projected area around the two northern test holes also; thus, only 55 percent of one area and 92 percent of the other can contain clay reserves. The estimated probable reserve of clay for this deposit is 1,200,000 short tons.
Byrne, Coombs, and Matthews (1951, p. 7) reported about 6 feet of "bentonitic clay" in the SE SW sec. 18, T. 9 S., R. 23 W., and they assigned this clay to "the upper part of the Pierre shale formation". Investigation revealed an exposure of 5 feet of clay on the east side of a small stream at about the cen. S2 SE SW of the section. The clay is yellowish brown in the upper foot and orange brown below. The underlying stratum was covered, but the clay is overlain by about 8 feet of gravelly sand (Ogallala or Pleistocene presumably). A sample of this clay was calcareous and only partly montmorillonitic (R. T. Runnels, 1956, oral communication).
The clay deposits investigated in Phillips County are in two separate areas, the western called the Long Island area for the adjacent community and the eastern called the Heth-Adee area for the names of owners of two large parcels of land. The Long Island area includes part or all of sec. 24, 25, 35, and 36, T. 1 S., R. 20 W., sec. 31, T. 1 S., R. 19 W., and sec. 3, T. 2 S., R. 20 W. The Heth-Adee area includes part or all of sec. 9, 10, and 11, T. 1 S., R. 18 W.; it is situated 15.5 miles directly north along U. S. Highway 183 from the courthouse square in Phillipsburg.
The oldest rocks exposed in northern Phillips County are beds of the Niobrara Chalk (Cretaceous). The chalk is commonly thin to medium bedded, light tan to yellowish white on the outcrop, and contains several very thin white bentonite seams (Byrne, Beck, and Houston, 1948, p. 6). Overlying the Niobrara is the Pierre Shale (Cretaceous), which is a dark-gray, noncalcareous clay shale. Unconformably overlying the Cretaceous formations is the Pliocene Ogallala Formation (Frye and Leonard, 1949, p. 36), which exhibits many lithologies (gravelly sand, silty sand, sandy silt, silt, clay, and the prominent caliche-cemented sandy conglomerate known as "mortar beds"). Blanketing the area and generally covering the older formations are undifferentiated Pleistocene silt, sand, and gravel.
During the summer of 1955, one of the authors (Ives) guided a representative of the Bennett-Clark Company, Inc., producers of bleaching and industrial clay, on a field inspection of the Long Island area. In the fall of 1955, the Bennett-Clark Company obtained long-term leases on most of the Long Island area. The Survey made no further investigation, and the information on hand concerning the Long Island area does not warrant estimation of reserves. The Heth-Adee area, however, was extensively tested by drill holes, and two deposits were located that contain probable reserves of clay estimated at 2,200,000 and 3,700,000 short tons respectively.
A deep ravine in the cen. NW SW NW NW sec. 3, T. 2 S., R. 20 W., showed several good exposures of clay. Here the clay seems to be a part of the Pierre Shale, because variations in its thickness (observed to range from 1 foot to 11 feet) relate to local changes in dip in the underlying black shale. Unconsolidated, generally crossbedded sand rests unconformably on the clay. Hand augering at the base of an outcrop in the west wall of a shallow gully at the cen. N2 NE NE sec. 35, T. 1 S., R. 20 W., indicated 11.3 feet of clay, of which sample 55232 represents the upper 5.5 feet and sample 56206 the lower 8.8 feet, thus overlapping somewhat. At this location, the clay, which is underlain by black shale, contains sparse fine quartz pebbles, probably an indication of Neogene age. As shown in the following section, one exposure seemingly indicated that there are two clays, of different ages.
| Section down bank of road ditch in cen. E side NE sec. 35, T. 1 S., R. 20 W., Phillips County. (Measured by William Ives and Jack L. Kendall) | Thickness, feet |
||
|---|---|---|---|
| 7. Soil, dark brown, clayey | 2.0 | ||
| Neogene—Pliocene | |||
| Ogallala Formation | |||
| 6. Caliche or soft limestone, white, sandy, clayey | 1.5 | ||
| 5. Clay, upper 0.5 foot greenish and pinkish white, lower more brownish, some gray streaks; bentonitic; breaks into blocky fragments | 0.9 | ||
| Cretaceous—Upper Pierre Shale | |||
| 4. Shale, brown, white, and gray in fine laminae; breaks into blocky fragments | 0.4 | ||
| 3. Shale, black to dark gray; breaks into blocky fragments; contains yellow splotches and small gypsum crystals | 1.1 | ||
| 2. Clay, light brown, some white, bentonitic, soapy | 0.35 | ||
| 1. Shale, identical to unit 3 | 6.0 | ||
Several test holes were hand augered in the NE NE sec. 35 by WPA workers in 1938 under supervision of N. Plummer and J. F. Romary of the State Geological Survey. These holes indicated the presence of bentonitic clay layers, ranging in thickness from 0.5 foot to 12 feet, overlain by soil and unconsolidated overburden 0.5 foot to 13 feet thick. Underlying the clay is either light-gray chalk (Niobrara?) or black shale (Pierre). A deep ravine at the cen. S line SW SE NW sec. 25, T. 1 S., R. 20 W., shows bentonitic clay (sample 56'207) over black shale, the contact being irregular but seemingly gradational. The extreme unevenness of the upper clay surface suggests erosion of the clay before the overlying sand and silt were deposited. Northward down the ravine the clay pinches out. In the cen. NE NE SW sec. 25, about 8 feet of clay is exposed in a gully bank. The base of the clay is covered; the contact with the overlying sandy silt is uneven.
About 15 feet of clay is poorly exposed at the cen. SE SE SE sec. 25 on the northeast side of a hill capped by Ogallala conglomeratic sandstone. A hand-augered test hole verified the presence of bentonitic clay, some layers of which are sandy. Sample 55230 represents 15 feet of bentonitic clay exposed at a bend in a small stream (cen. NW NW sec. 31, T. 1 S., R. 19 W.) A hand-augered test hole at the base of this exposure penetrated 3.4 feet of clay before water flooded the hole, preventing the taking of samples. About 450 feet directly east and upstream from this exposure is another, showing only 5 feet of clay. Here the extreme irregularity of the upper contact suggests vigorous erosion prior to deposition of the overlying sand.
Several other exposures examined in this area did not indicate any economic quantity of clay but did show relationships relevant to the age and nature of the deposits. In the cen. N2 NE NE SE sec. 25, T. 1 S., R. 20 W., pale-green clay is exposed in the side of a small gully. The clay, ranging in thickness from about 2.0 to 5.5 feet, is unconformably overlain by poorly consolidated sand containing abundant caliche nodules and is underlain by black clay shale. In a short gully in the high bank southeast of Prairie Dog Creek (cen. S2 SW NE NE sec. 25), one can view a pinch-out of the clay on chalk. The high bank on the east side of Prairie Dog Creek at the cen. NE SE sec. 24, T. 1 S., R. 20 W., shows a clean exposure of about 40 feet of Pierre Shale containing about 7.5 feet of bentonitic clay in the middle. At the north end of this exposure, a normal fault puts Pierre Shale against Niobrara Chalk.
Some of the bentonitic clay in the Long Island area obviously is part of the Pierre Shale, but the occurrence of clay on Niobrara Chalk could indicate either reworking of clay from the Pierre and redeposition on an eroded surface, or alteration of post-Cretaceous volcanic ash that fell in the area, or both.
Presence of bentonitic clay in this area was known from samples taken from a test trench dug in 1938 by WPA workers on a slope at a spot just south of the cen. SE NE sec. 10, T. 1 S., R. 18 W. A log of this trench (N. Plummer; 1955, written communication) recorded the presence of about 23 feet of clay. A reconnaissance of the adjacent terrain resulted in the discovery of exposures of bentonitic clay in the creek bank at cen. W2 NW sec. 11 and in a bank on the east side of a stock pond at cen. NE SE sec. 9. Another exposure of 13 feet of clay was found at cen. W2 SW NE sec. 9. Continuance of the bentonitic clay under cover in the vicinity of each exposure was tested by use of a hand auger, which had a maximum operating depth of 24 feet. Several hand-auger test holes along the base of the slopes of a valley in the center of sec. 9 encountered bentonitic clay lying under a few feet of cover. The valley slopes, however, are steep and high; thus, testing for continuation of the clay under the hills was not possible because of the limited operating depth of the hand auger. This area in sec. 9 should be examined in the course of any commercial exploration for clay.
Figure 2—Topographic map of part of sec. 10, T. 1 S., R. 18 W., showing location of exposure, auger holes, and drill holes.
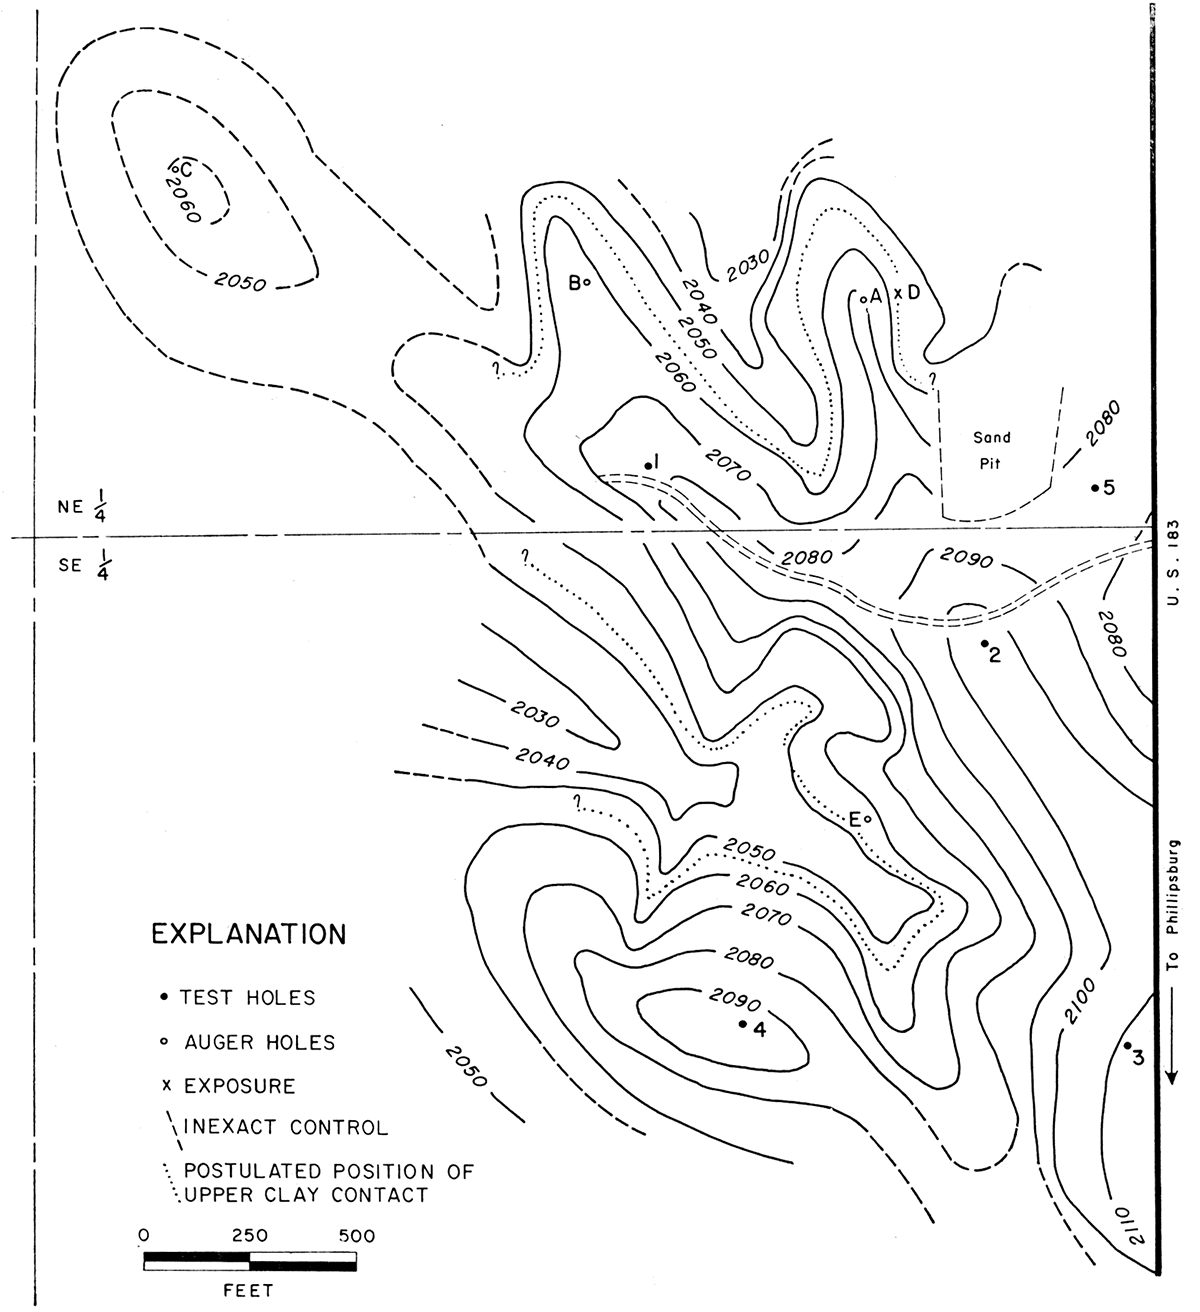
Some continuity of the bentonitic clay was established by hand augering in the vicinity of the exposures in sec. 10 and 11, too. A hand-auger test hole (E in Fig. 2) at the cen. NE SE sec. 10 penetrated 3 feet of overburden and 19 feet of clay (sample 56147) underlain by black clay shale. A trailer-mounted gasoline-powered auger was brought in for deeper testing, but soon proved unsuited to the task. Three power-auger holes were completed in sec. 10 (A, B, and C in Fig. 2) and they provided some data on thickness of overburden and clay (Table 3). In order to determine the extent of the clay, investigation of sec. 10 and 11 was continued by use of a rotary drill for test holes. Five test holes were drilled in sec. 10 and the information derived is shown in Table 3. Although thickness was different in each hole, the sequence of materials constituting the overburden was fairly uniform. The log following is typical.
Table 3—Elevation of upper clay contact, thickness of clay, and thickness of overburden for drill holes, auger holes, and outcrop in sec. 10, T. 1 S., R. 18 W.
| Designation in fig. |
Clay top elevation |
Clay thickness, feet |
Overburden thickness, feet |
|---|---|---|---|
| 1 | 2043.8 | 19 | 35 |
| 2 | 2047.6 | 27 | 56 |
| 3 | 2055.6 | 17 | 57 |
| 4 | 2053.8 | 24 | 41 |
| 5 | 2046.4 | 20 | 41 |
| A | 2054.0 | 26 | 16 |
| B | 2059.5 | 42 | 10 |
| C | 2048.1 | 18 | 12 |
| D | 2057.6 | 23 1/2 | 10 |
| E | 2052.4 | 19 | 3 |
| Sample log of test hole 3 in the SE cor. NE SE sec. 10, T. 1 S., R. 18 W., Phillips County; drilled May 1957. | Thickness, feet |
Depth, feet |
||
|---|---|---|---|---|
| Soil, brown, silty | 5 | 5 | ||
| Neogene—Pliocene | ||||
| Ogallala Formation | ||||
| Silt, brown, sandy | 16 | 21 | ||
| Silt, light brown, very sandy, clayey, cemented. | 9 | 30 | ||
| Clay, brown, very sandy | 12 | 42 | ||
| Sand, medium to coarse, some fine to medium gravel, slightly cemented | 8 | 50 | ||
| Sand, medium to coarse, and fine gravel, loose | 7 | 57 | ||
| Clay, yellowish brown, bentonitic | 17 | 74 | ||
| Cretaceous—Upper | ||||
| Pierre Shale | ||||
| Shale, black | 6 | 80 | ||
The elevation of the test holes, exposure in WPA trench, and numerous other points in sec. 10 was determined by use of a plane table and alidade, and this information was used to prepare the reconnaissance topographic map (Fig. 2).
In estimating the probable reserves of bentonitic clay in the deposit in sec. 10, the data from test hole C were not used. Hole C is outside the general area outlined by the other exploratory test holes, and supplementary hand-auger test holes nearby did not encounter any clay. Areas lying outside the projected line of outcrop (Fig. 2) also were not used. The estimated probable reserve of bentonitic clay in sec. 10 is 2,200,000 short tons.
The only exposure of clay in sec. 11 is in the creek bank (sample 55231) at cen. W2 NW (A in Fig. 3). A hand-augered test hole just east of the exposure penetrated 16 feet of bentonitic clay (sample 56208). Eight rotary test holes (1 to 8 in Fig. 3) were drilled through the clay into the underlying stratum. Descriptions of the materials penetrated as given in the following log are typical of the area.
| Sample log of test hole 5 at the cen. Eline SE NW NW sec. 11, T. 1 S., R. 18 W., Phillips County; drilled May 1957. | Thickness, feet |
Depth, feet |
||
|---|---|---|---|---|
| Soil | 5 | 5 | ||
| Neogene—Pliocene | ||||
| Ogallala Formation | ||||
| Silt, brown, sandy | 13 | 18 | ||
| Sand, medium | 7 | 25 | ||
| Silt, brown, very sandy | 15 | 40 | ||
| Sand, medium to coarse, some medium gravel | 13 | 53 | ||
| Clay, light gray, some yellow streaks, bentonitic | 24 | 77 | ||
| Cretaceous—Upper | ||||
| Pierre Shale | ||||
| Shale, black | 3 | 80 | ||
Figure 3—Topographic map of part of sec. 11, T. 1 S., R. 18 W., showing location of exposure and drill holes.
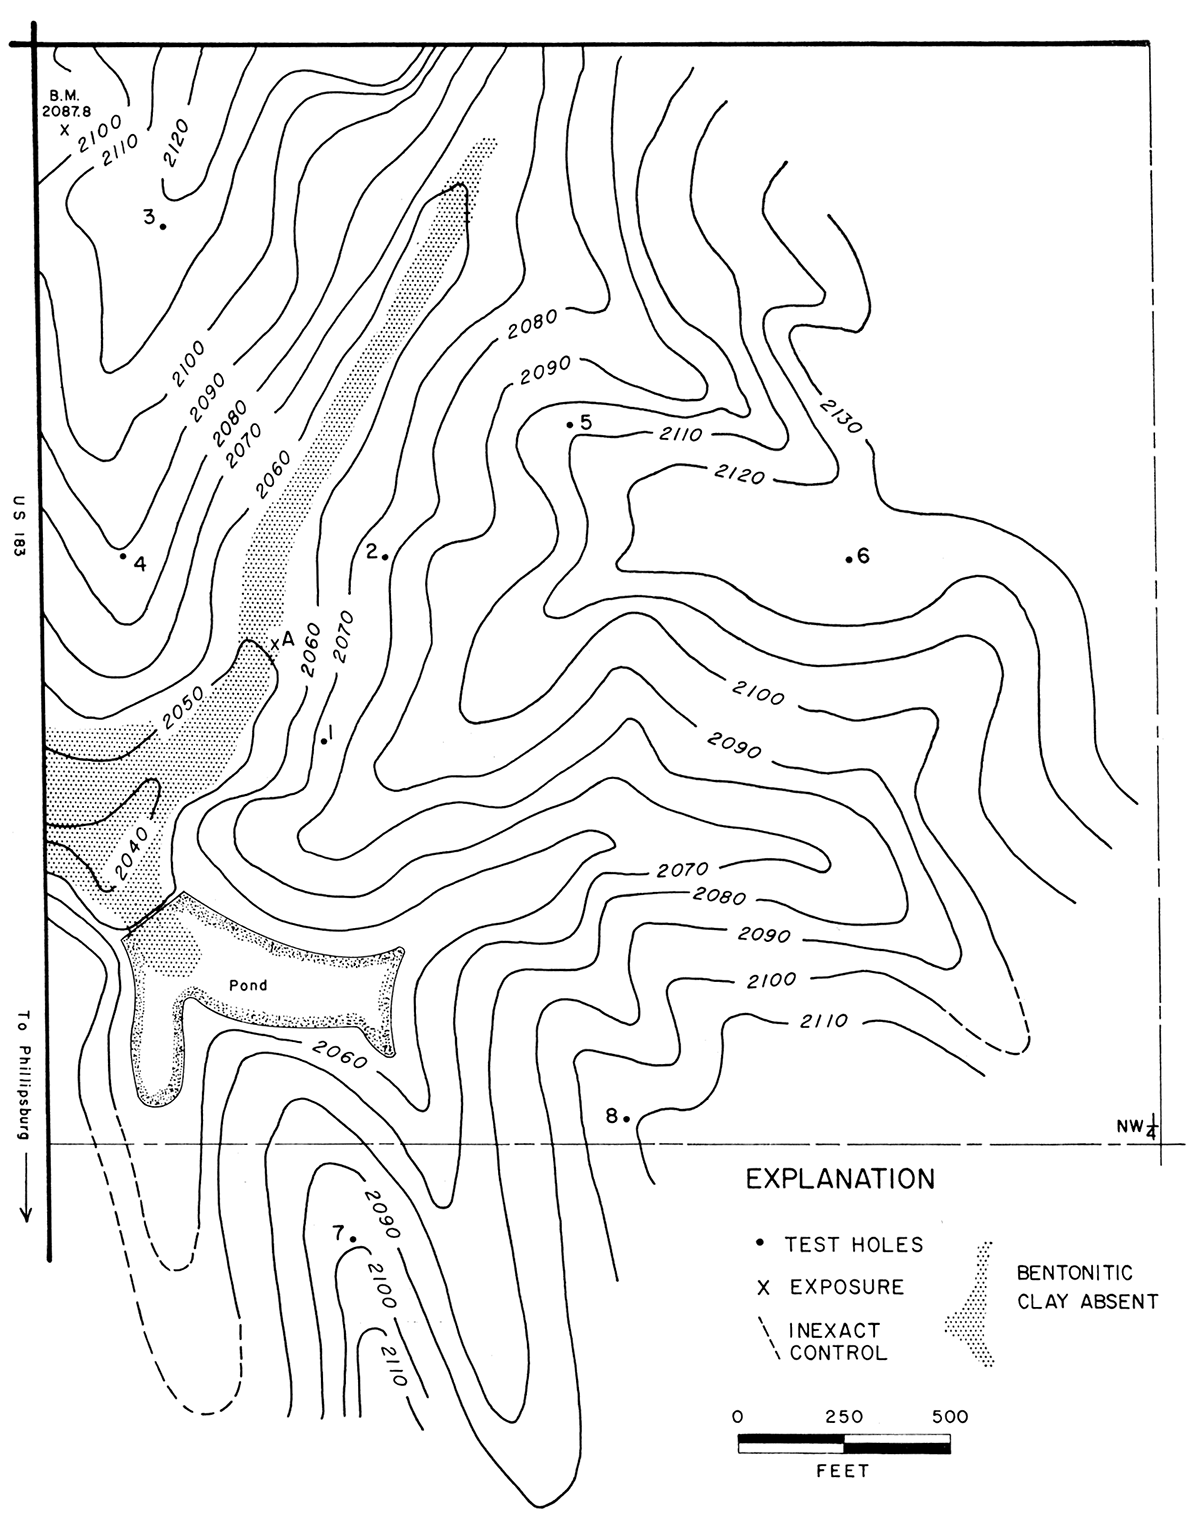
During the field investigation, a reconnaissance topographic map (Fig. 3) of a portion of sec. 11 was prepared by plane table methods. Data obtained from the drilled test holes are given in Table 4.
Table 4—Elevation of upper clay contact, thickness of clay, and thickness of overburden for drill holes in sec. 11, T. 1 S., R. 18 W.
| Designation in fig. |
Clay top elevation |
Clay thickness, feet |
Overburden thickness, feet |
|---|---|---|---|
| 1 | 2045.2 | 18 | 29 |
| 2 | 2053.7 | 19 | 26 |
| 3 | 2057.1 | 18 | 58 |
| 4 | 2053.2 | 12 | 36 |
| 5 | 2056.7 | 24 | 53 |
| 6 | 2058.6 | 15 | 70 |
| 7 | 2061.5 | 19 | 38 |
| 8 | 2057.5 | 18 | 49 |
The valley floor in the E2 NW sec. 11 is lower in elevation than the upper surface of the clay. The cut banks along the stream show alluvium, and thus it seems that the clay has been eroded from this valley (stippled in Fig. 3). The area from which clay probably has been removed by erosion was not included in computation of reserves. A probable reserve of 3,700,000 short tons of bentonitic clay is estimated for this part of sec. 11.
The area studied in Wallace County during the field investigation included part or all of sec. 7,8, 19, 29, and 30, T. 12 S., R. 41 W., and sec. 1, 2, 3, 12, and 14, T. 12 S., R. 42 W. The following stratigraphic data were drawn from Elias (1931). The oldest exposed formation in the area of study is the Pierre Shale, generally exposed only where stream erosion has removed covering sediments. The Pierre is a thick succession of dark-gray to black clay shale beds containing zones of septarian concretions. Overlying the Pierre Shale in this area is the Ogallala Formation, which shows its characteristic variable lithology (gravel, sand, silt, and clay, mostly intermixed and having some degree of consolidation). Blanketing both the Pierre and Ogallala are undifferentiated Pleistocene sediments.
During the investigation, most of the exposures mentioned by Elias (1931) and Kinney (1942) were located. In general, however, the clay in Wallace County is more poorly exposed than in other areas of study. Approximately 8 feet of greenish-gray and light-orangish-brown clay is poorly exposed in the east valley wall at the cen. S2 SE NW sec. 3, T. 12 S., R. 42 W., and is overlain by about 15 feet of Ogallala conglomeratic sandstone. About 300 feet east of a ranch house at the cen. NE SE NE sec. 2, T. 12 S., R. 42 W., a small outcrop of clay was cleaned off with a bulldozer and sampled (sample 56122). Bulldozer operations by the landowner to enlarge a spring exposed some clay at the cen. W2 NW NE sec. 12, T. 12 S., R. 42 W. At the cen. N line NE NE of the same section, an exposure of 4 feet of brown clay was bladed off by bulldozer to permit sampling of fresh material (sample 56121). Physical appearance of patches of ground in the vicinity of these two exposures in sec. 12 indicates that bentonitic clay is a major constituent of the soil.
At the cen. W line NW sec. 8, T. 12 S., R. 41 W., light-green bentonitic clay lies between two ledges of light-gray conglomeratic sandstone. A small area of clay is exposed on the south slope of a large valley at the cen. E2 sec. 14, T. 12 S., R. 42 W. Several low mounds of light-green calcareous clay are exposed on the floor of a gully at the cen. SW SW sec. 19, T. 12 S., R. 41 W. A bulldozer cut through one mound exposed clay (sample 56119) , which was itself only slightly calcareous but contained "pockets" of caliche. Small outcrops of clay were found at the cen. E2 NW NE and cen. NE NE sec. 30, and cen. N line sec. 29, T. 12 S., R. 41 W. A bank on the north side of a small stream was cleaned by bulldozing at the cen. N2 SW SW sec. 29, T. 12 S., R. 41 W., and the 8 feet of greenish-brown clay thus exposed was sampled (sample 56120).
The exposures of clay scattered over an 8-square-mile area suggest the possibility of large deposits, but exploration would require an extensive drilling program.
The clay deposits occur (1) within the Ogallala Formation, (2) along the Pliocene-Cretaceous unconformity, and (3) within Cretaceous shales. The clays examined in the study were selected because they showed certain physical characteristics. If available data provided adequate control, probable reserves of an area were estimated. Multiplying the minimum observed thickness of clay by the area within a 600-foot radius of the test hole gave a volume assumed to contain 125 pounds of clay per cubic foot. This weight, converted to short tons, constitutes the probable reserve.
Two clay deposits were located in Clark County. The deposit in sec. 18, T. 32 S., R. 22 W., was exposed at four places and was penetrated in two test holes. Maximum outcrop thickness observed was 3.5 feet, whereas thicknesses of 5 and 7 feet were penetrated in test holes. Outcrops are situated below the rim of a topographic basin but the test holes were located on an upland surface to the north. Probable reserves are estimated at 500,000 short tons of clay, covered by approximately 100 feet of overburden. The deposit in sec. 34, T. 31 S., R. 23 W., was exposed at only one place but was penetrated in three test holes. Clay encountered in this area was silty, sandy, and calcareous. Probable reserves are estimated at 1,200,000 short tons.
In sec. 18, T. 9 S., R. 23 W., Graham County, 5 feet of clay is exposed but is calcareous and only slightly montmorillonitic.
Around Long Island, Phillips County, 11 exposures of bentonitic clay include several more than 10 feet thick. Persistence of the clay from place to place was not established, however, and stream erosion has isolated some areas. After a field examination of these clay exposures, the Bennett-Clark Co., Inc., obtained long-term leases throughout the Long Island area.
Two outcrops, each exposing about 13 feet of bentonitic clay, were found in sec. 9, T. 1 S., R. 18 W., Phillips County. Hand-augered test holes found clay under a few feet of cover in the near vicinity. This area is worthy of commercial exploration. Sec. 10, T. 1 S., R. 18 W., is the site of a clay deposit that was penetrated in five test holes. This deposit, having a minimum observed thickness of 17 feet, contains probable reserves estimated at 2,200,000 short tons of bentonitic clay. Only one clay exposure was found in sec. 11, T. 1 S., R. 18 W., but a nearby hand-augered test hole penetrated 16 feet of bentonitic clay, and subsequent rotary drilling of eight test holes disclosed two deposits having a total estimated probable reserve of 3,700,000 short tons.
Bentonitic clay outcrops were found in an area of 8 square miles in Wallace County, but in general the exposures were poor. Test drilling was not done in this area; however, sizable deposits could be present.
The bleaching power of a clay is undeterminable by any form or combination of forms of analysis short of physical testing. Clays containing montmorillonite may be sorted out by petrographic, differential thermal, or x-ray analysis and can be experimentally tested for bleaching properties. Prediction of bleaching power from these varied analyses has been unsuccessful to date.
Recently, however, a method has been developed using a modified differential thermal analysis to gage the catalytic potential of activated-clay cracking catalyst (Stone and Rase, 1957); in this method, the heat increase produced by poisoning the ion-exchange capacity of the catalyst with ammonia, steam, or organo-nitrogen compounds is recorded and gives a quantitative analysis of ion-exchange capacity of the sample. It is possible that such a method could effectively replace most physical bleaching tests run today.
Because of the extremely small crystal size of the clay minerals, and the fact that other ions can and do substitute into the crystal lattice without structural change or destruction of the lattice, the exact mechanism of bleaching has not been definitely established. A combination of ion exchange and lattice structure, together with surface area and the amount of porosity, are thought to contribute the bleaching power of the montmorillonite group. By ion exchange, the organic dyestuffs in the oil are complexed and bonded to the clay; thus the oil is clarified by their removal. The amount of surface area and pore space regulates the amount of oil brought into direct contact with the unsaturated bonds of the clay lattice, and is directly proportional to the amount of bleaching possible with any given clay. About 5 percent moisture is optimum in most montmorillonite bleaching clays; the clay lattice expansion caused by this moisture facilitates the contact of oil to clay by increasing the surface area of the unit particle or crystal.
Montmorillonite clays that bleach with no treatment other than drying and grinding are referred to as "naturally active clays". These clays are also known as "Fuller's earth" or "soap" clays, and have been used for centuries in bleaching and other capacities. The above-mentioned names have been used in recent years to differentiate the raw product from chemically and thermally treated clays, which fall within the scope of "activated clays".
Naturally active clays are very selective in removal of impurities from an oil; thus their usefulness is limited. One clay works well with one oil, yet not with another; therefore, the ideal technique would be to bleach oils separately and then blend them together. This technique is impractical and virtually impossible with current methods of processing and refining oils. The best alternative, if naturally active clays are used, is a mixture of several bleaching clays. Naturally active clays have the added advantage that no processing plant other than one for drying and grinding is needed. The bleaching properties of some but not all naturally active clays can be enhanced by activation.
Naturally active clays already possess porosity and exchangeable ions to varying degrees, and their bleaching powers are not greatly enhanced by acid activation. The selectivity of natural bleaching clays probably is due to the reactivity of the exchangeable ions and the type of impurity in the oil. Such reactivity results from the amount of unsaturated ionic charge remaining after the ion becomes attached to the clay lattice, and in turn is governed by the size of the ion and its valence or charge. In general, the ion is more tightly bound to the lattice as the ionic size increases or as the valence increases.
Processed clays are classified into two groups according to the mode of activation used, either chemical or heat treatment. The activated clays generally do not show great promise as a naturally active clay, yet when processed will bleach several times as much oil to a given color as will the same weight of naturally active clay. Such clays are not as selective and will bleach a much wider range of oils without special conditions.
Chemical activation of a clay is accomplished by heating the clay in dilute mineral acid. Porosity is increased by removing carbonates and other bases from the clay. Hydrogen ions of the acid substitute for a fraction of the aluminum and iron in the lattice. The H+ ions are attached to the oxygen atoms held by the silica and form the more reactive OH- radical. The same acid leach tends to lower the stability of the lattice and increase the number of unsaturated ionic charges available for complexing the dyestuffs in the oil, greatly increasing the bleaching power. Sulfuric acid was used in the activation of clays for bleaching tests because of its economy when applied to industrial methods (for comparison, various acids and combinations of acids were tested on samples of one clay and the results are shown in Table 10). The pore space cleared results in additional bleaching power. When the pores of the clay become plugged or filled with complexed coloring matter, the bleaching action stops because the oil is unable to reach the active unsaturated positions.
Heat activation consists of raising the temperature of a clay in an oven, furnace, or kiln to an experimentally determined optimum temperature for that clay. The optimum temperature of activation, although variable, is normally below 500°C, and for all clays lies below the temperature at which the clay lattice is destroyed.
The various clays may be used in any of the bleaching methods. Both natural and activated clays can be granulated, pelletized, or extruded for use in various processes. Change in the mode of activation seldom necessitates process or equipment changes in using the clays as bleaching agents. A processing plant of a more complex nature is needed to produce activated clays than to produce naturally active clays, but the higher price commanded by these clays will probably offset the initial plant cost, in time. Per unit of bleaching power, activated clays are much more economical for shipping long distances. Added economy results from the use of naturally active clays in the bleaching of gasoline and other light petroleum products, as the clays may be burnt and reused. When used on the heavier petroleum oils, the clay is not reusable, because burning forms carbon and tars as combustion products.
Detrimental factors in the oil that can reduce the apparent bleaching power are large organic molecules, which blanket several exchange positions, and sulfur, which reacts with the clay to neutralize its bleaching properties.
Two basic methods are used for determining the bleaching properties of clays. The contact method consists of moving the clay through the oil whereas the percolation method moves the oil through a bed of clay. These methods were developed primarily for bleaching petroleum products and were later adapted to such vegetable oils as cooking and salad oils, oleomargarine, and vegetable shortening, as they gradually replaced lard, butter, and other animal products. Laboratories and industrial plants have adapted both methods to prepare specific products. Very few of these industrial procedures can be applied directly to clay testing, because of their specialization. Therefore, testing methods must be used in evaluating new clay samples.
In the contact process, a measured amount of oil is heated to a predetermined temperature in a container capable of being stoppered, and weighed amounts of clay are added with agitation. The clay is finely ground (150-200 mesh) and for best results is introduced in small increments. The temperature for optimum bleaching was found to be within the range of 105°C to 130°C. Temperature must be carefully controlled to prevent oxidation and polymerization, which may discolor the oil and give erroneous results. After the clay has been in contact with the oil for a predetermined length of time (usually 10 to 20 minutes, seldom more than 30 minutes), the container is stoppered, removed from the heat source, and cooled to room temperature. Upon reaching room temperature, the flask is opened and a sample taken for color comparison.
The percolation process consists of forcing heated oil through a column of 30-40 mesh clay held on a screen and observing the color and volume of the resultant product. This, also, is a contact process but differs in that percolation is the equivalent of adding an infinite number of increments of clay to give a greater clay-oil surface contact. To illustrate percolation in an idealized system, assume that the oil is moved through the clay column in small unit volumes compared to the capacity of the system. The first unit volume of oil comes in contact with the top of the clay column and coloring matter is removed as oil passes down through the clay. As the second unit passes down through the column, it first passes through clay whose action was expended in bleaching the first unit of oiL Consequently, the first unit of oil is bleached to the greatest degree, and succeeding units will be bleached less and less as the amount of expended clay increases, until all the clay is expended and no further bleaching occurs. The method gives gradational results; both color and volume-per-color relationships vary throughout the run. Results are harder to integrate and evaluate than those of the contact method. Therefore, the contact method is better adapted to laboratory testing, although percolation testing best simulates pilot plants or large scale operations.
Both contact and percolation methods are adapted industrially by (1) varying the type and quantity of the clay used, (2) varying the temperature of the oil, (3) altering the rate of flow or contact time, and (4) predetermining the amount of clay used to bleach a given volume of oil. In the contact process, the practical temperature range for bleaching reflects the properties of the oil. The lower temperature limit is governed by the viscosity of the oil and the upper limit by its flash point. These restrictions are overcome in pressure percolation systems, which permit the use of higher temperatures.
Selection of oil standards for laboratory testing of the bleaching power of clays was governed by the following criteria:
Many earlier tests for bleaching clays used crude petroleum oils as standards, but from a laboratory viewpoint they have several disadvantages. First, their color and clarity are such that no color-transmission tests can be run on them without great dilution. Second, they contain a great many "poisons" such as sulfur and sulfo-organic compounds, which seriously affect the clay's operating potential. Third, very few if any crude oils are bleached commercially; there is some refining to separate various fractions.
The use of a "dirty" crank-case oil as a bleaching standard also is misleading. The filtration of suspended carbon from these oils clarifies the oil to a great extent. In the past, such action has been called bleaching, but actually it is only the removal of solid particles. Even more important in laboratory comparison is the fact that the various additives and contaminants in used oil affect the bleaching process differently. The effect of these additives may vary widely in random samples.
Another source of error results from the use of solvents such as clear benzene to dilute a dark oil to a color that can be determined by colorimeter. Solvents are frequently used to mobilize viscous oils for testing and bleaching. If an oil-solvent mix is bleached, the clay will preferentially absorb the heavier hydrocarbon (in this case oil) and allow the solvent to pass through. The resultant solution, richer in solvent and poorer in oil, is of a much lighter color, owing to preferential absorption and not to bleaching. Heat, rather than a solvent, should be used wherever possible to lower the viscosity of the oil for bleaching. If a solvent must be used to dilute the oil to a readable color, it should be added only after bleaching, and the product must be compared to the crude diluted by the same ratio of solvent to oil. If heated oil is left exposed to the air, oxidation products may darken the oil. When using a clay activated with HCl, the clay-oil slurry should not be left standing too long, because AlCl3 extracted from the clay will darken the oil. Problems found in conjunction with petroleum oils are rarely encountered in the more nearly uniform vegetable raw materials.
The oil samples used in the tests were three grades of Kettleman Hills crude oil, a dark lube oil, a cylinder oil, and a cottonseed oil. These samples were obtained from the companies listed in the acknowledgments.
The Kettleman crude oils (oils 3, 4, and 5, Table 5) were tested because similar oils have been used in other bleaching tests by various authors. These oils were extremely dark and contained much sulfur. It was impossible to bleach them to an ASTM color with either the clays to be tested or commercial bleaching clays. Dilution with benzene to bring them to an ASTM color was also prohibitive, owing to the extreme dilution necessary. No valid results were obtained with these oils, and it was decided to omit them from further testing.
The lube oil and cylinder stock differ both in gravity and viscosity. The cylinder stock at room temperature is a grease-like solid, but liquefies at higher temperatures. These two oils were chosen as representative of the heavier petroleum oils, and should give a comprehensive bleaching result when tested against Kansas clay samples.
The sixth oil tested was a cottonseed oil, which was regarded as a representative vegetable oil. The A.P.I. gravities and viscosities of these oils and the dilution factors necessary to reduce the oil color to an ASTM color are shown in Table 5.
Table 5—Oil samples used in the tests.
| Oil no. |
Specific gravity(1) |
API- 60° 108° |
Viscosity(2) | ASTM color |
Dilution, oil:benzene (3) |
Type oil |
Notes | |
|---|---|---|---|---|---|---|---|---|
| Saybolt seconds |
Centi- stokes |
|||||||
| 1 | .893 | 22.0 | 275.6 | 55.6 | 2 1/2 | Cottonseed oil | (Donated by Mrs. Tucker's Products.) | |
| 2 | .892 | 24.8 | 6057 | 1313 | 7 1/2 | 1:1 | Lube stock | (Donated by Socony-Mobil.) |
| 3 | Solid at room temperature | 8 | 1:5 | Cylinder stock | (Donated by Co-op Refinery, Coffeyville, Kansas.) | |||
| 4 | .844 | 35.1 | 45.3 | 5.9 | 8+ | 1:100 | Kettleman crude* #58-22Q |
(Donated by Standard of California.) |
| 5 | .822 | 30.7 | 71.08 | 13.4 | 7+ | 1:80 | Kettleman crude* #344-20-J |
(Donated by Standard of California.) |
| 6 | .841 | 35.6 | 43.65 | 5.4 | 8 | 1:20 | Kettleman crude* #643-7Q |
(Donated by Standard of California.) |
| * The extreme dilution needed to reduce the color of these oils to the range of the glass color standards made it necessary to delete them. These oils contain much sulfur and no significant results were obtained from any test run upon them. (1) The specific gravities were measured with a Westphal balance and checked with hydrometers. (2) The viscosity tests were run at room temperature in a Saybolt Viscosimeter and corrected to 100°F. (3) The dilution factor needed with oils 2, 3, 4, 5, and 6 is a ratio of one part of oil to the number of parts of clear benzene needed to place the oil within the range of color covered by the glass color standards. |
||||||||
The samples tested in the laboratory were channel samples from the outcrops and cuttings from auger holes. Chemical analyses of the clay and standards are shown in Table 6. After air drying, the preliminary grinding and mixing were accomplished by crushing in a pan-mill for a minimum of 2 hours. A 2-quart sample was extracted, dried at 105°C for 2 hours, and further ground to pass 150-mesh screen by ball-milling for 24 hours; the -150-mesh samples were packed in labelled quart cartons and stored at room temperature for subsequent testing.
Erlenmeyer flasks (250 cc) were used for heating the oil and mixing it with clay. These vessels permit more vigorous agitation by shaking than do beakers. Also, when removed from the heat source they can be stoppered to prevent oxidation. The heat source used was a 220-volt Lindberg hot plate.
Table 6—Chemical analyses of Kansas montmorillonite clays and commercial test standards.
| Sample no. |
SiO2 | Al2O3 | Fe2O3 | TiO2 | CaO | MgO | P2O5 | SO3 | K2O | Na2O | S | LOI | Total | ||
|---|---|---|---|---|---|---|---|---|---|---|---|---|---|---|---|
| air- 140° |
140- 600° |
600- 1000° |
|||||||||||||
| 55235 | 55.03 | 17.93 | 3.84 | 0.42 | 2.08 | 2.55 | 0.02 | 0.09 | 0.65 | 0.11 | ND | 11.54 | 2.89 | 2.28 | 99.43 |
| 55234 | 63.36 | 16.54 | 4.00 | 0.92 | 1.13 | 1.72 | 0.14 | t | 2.52 | 0.23 | ND | 5.46 | 2.27 | 1.23 | 99.52 |
| 55232 | 59.99 | 16.16 | 5.10 | 0.58 | 1.28 | 1.88 | 0.16 | 0.25 | 2.27 | 0.33 | ND | 6.92 | 3.17 | 1.68 | 99.77 |
| 56206 | 55.47 | 16.85 | 5.12 | 0.79 | 1.52 | 2.99 | 0.15 | 0.11 | 1.25 | 0.31 | t | 8.77 | 3.92 | 2.22 | 99.47 |
| 56207 | 57.93 | 17.53 | 3.81 | 0.61 | 1.52 | 2.20 | 0.11 | t | 1.09 | 0.31 | 0.01 | 8.94 | 3.70 | 1.93 | 99.68 |
| 55230 | 60.40 | 16.02 | 4.88 | 0.65 | 1.58 | 1.67 | 0.16 | 0.26 | 2.40 | 0.24 | ND | 6.66 | 2.71 | 1.93 | 99.56 |
| 55231 | 58.96 | 16.96 | 5.39 | 1.66 | 1.47 | 1.27 | 0.35 | 0.69 | 2.84 | 0.31 | ND | 4.83 | 3.76 | 1.57 | 100.06 |
| 56208 | 59.93 | 16.69 | 6.43 | 0.83 | 0.97 | 1.22 | 0.32 | 0.42 | 2.87 | 0.32 | 0.04 | 3.46 | 4.39 | 1.23 | 99.08 |
| 56147 | 56.06 | 14.83 | 6.39 | 0.86 | 5.09 | 1.45 | 0.39 | 0.06 | 2.36 | 0.41 | nil | 3.71 | 4.47 | 3.11 | 99.14 |
| 56122 | 57.30 | 15.23 | 7.09 | 0.64 | 1.95 | 2.31 | 0.38 | 0.21 | 2.43 | 0.56 | ND | 4.27 | 4.74 | 2.23 | 99.36 |
| 56121 | 61.93 | 12.90 | 4.19 | 0.57 | 3.24 | 1.96 | 0.13 | 0.09 | 2.67 | 1.07 | nil | 4.86' | 3.09 | 2.46 | 99.16 |
| 56119 | 48.59 | 13.26 | 4.93 | 0.57 | 9.83 | 1.79 | 0.38 | 0.21 | 3.70 | 0.60 | ND | 3.93 | 3.66 | 7.76 | 100.11 |
| 56120 | 58.76 | 16.05 | 6.08 | 0.64 | 1.58 | 2.15 | 0.33 | 0.32 | 2.74 | 0.71 | ND | 4.37 | 4.00 | 1.94 | 99.67 |
| Filtrol | 52.31 | 12.77 | 1.03 | 0.25 | 2.00 | 3.30 | t | 3.27 | 0.14 | 0.01 | 0.03 | 19.67 | 4.51 | 1.59 | 100.71 |
| Attapulgite | 56.98 | 9.36 | 2.99 | 0.35 | 1.85 | 7.82 | 0.91 | 0.17 | 0.82 | 0.04 | 0.02 | 10.35 | 7.19 | 1.98 | 100.78 |
| Kaolin | 49.58 | 35.36 | 0.37 | 0.31 | 0.06 | 0.24 | 0.12 | 0.07 | 0.39 | 0.01 | t | 0.88 | 10.54 | 1.61 | 100.54 |
| Analysts: Wanda Waugh and Karmie Galle N.D. = not determined t. = trace (.01 % or less) |
|||||||||||||||
A Hellige color comparator was used to detect and record changes of oil color. It consists of 12 ASTM glass color standards ranging from very pale yellow #1 through darker yellow and amber to a deep red brown #8. The lower range is graduated in 1/2 units. Both oil sample and color slide are viewed side by side. The light source, a 100-watt lightbulb, was held at a constant distance (1 foot) behind the comparator in order to provide uniform light intensity. The comparator contains a frosted glass plate behind both sample and ASTM color slide, providing uniform light diffusion through both samples. Early tests with the comparator ruled out both sunlight and fluorescent tubes as light sources because of their variability.
To obtain clear samples for the comparator, the day was allowed to settle out of the oil; however, the first attempts demonstrated that enough fine particles remained in suspension, especially in the more viscous oils, to give an erroneous reading on the comparator. Centrifuging the decanted oil samples for one-half hour in an International Centrifuge, size #1, type C, at 2000 rpm, was sufficient to completely settle the suspended clay in most samples. It was necessary to warm a few of the samples in the oven and centrifuge them a second time. The warming helped mobilize the heavy oils and allowed more rapid settling.
Fifty cc of an oil standard was placed in a 250 cc Erlenmeyer flask and heated on the hot plate to 120° to 130°C. When this temperature was attained, a 5 gm sample of the clay to be tested was added. Shaking the flask at least once every 5 minutes for 30 minutes was necessary with dark petroleum oils. Because of the lighter color of cottonseed oil, much less shaking and a contact time of only 5 minutes gave a good comparative bleaching test. The flasks were then removed from the heat and, in the case of heavy viscous oils, a 5 cc sample was removed and centifuged. The flasks were tightly corked and allowed to cool. The less viscous oils were sampled after cooling and settling of most of the clay, then centrifuged to remove suspended clay. After the suspended clay had settled, the vials were placed in the colorimeter and sample color was recorded.
The clay standards used were (1) inert kaolin, which was taken from the clay library of the Ceramics Division of the State Geological Survey; (2) Filtrol, a commercial chemically activated bleaching clay; and (3) Attapulgite, a commercial heat-activated bleaching clay.
The bleaching potential of natural, heat-activated, and chemically activated Kansas bentonites was evaluated by comparison of the results of bleaching tests using three different oils.
The natural clay results are shown in Table 7. The two dark oils were bleached very little by the natural clays, and the degree of bleaching was variable, but these clays show results comparable to the heat-activated standard Attapulgite when tested against cottonseed oil. Consequently, they should work well for vegetable products and the lighter petroleum fractions such as gasoline and light oils. It should be pointed out again that the natural activity of clay is selective and should be tested against the specific product before use.
Table 7—Oils bleached with naturally active clay.
| Sample no. |
Color after bleaching | ||
|---|---|---|---|
| Cottonseed oil(1) | Lube stock(2) (1:1)a |
Cylinder stock(3) (1:5)a |
|
| 55235 | 1-1 1/2 | 7 | 8 |
| 55234 | 1-1 1/2 | 7 | 7 |
| 55232 | 1 1/2 | 7 | 8 |
| 56206 | 1 1/2 | 7 | 6 1/2 |
| 56207 | 1 1/2 | 7 | 4 1/2 |
| 55230 | 1-1 1/2 | 7 | 8 |
| 55231 | 1 1/2 | 7 | 8 |
| 56208 | 1 1/2 | 7 | 5 |
| 56147 | 1 1/2 | 6 1/2 | 8 |
| 56122 | 1 1/2 | 6 1/2 | 8 |
| 56121 | 1 1/2 | 6 | 8 |
| 56119 | 1 1/2 | 8 | 8 |
| 56120 | 1 1/2 | 8 | 6 |
| Filtrol | 1 | 5 | 2 |
| Attapulgite | 1-1 1/2 | 5 | 3 |
| *Kaolin | 1-1 1/2 | 6 1/2 | 5 |
| *Kaolin Was used as an inert clay standard. but owing to the extremely small particle size it seemed to have bleaching power. (a) Dilution ratios, oil to benzene. (1) ASTM original color 2 1/2 (2) ASTM original color 8 (3) ASTM original color 8 |
|||
The results of thermal activation are shown in Table 8. Separate samples of each of the clays were activated to 250°C, 350°C, and 450°C to determine the effect of temperature of activation in bleaching results. In general, the two mineral oils responded best to clays activated at 450°C, indicating an increase in bleaching potential for clays activated to higher temperatures. The data from the clays tested upon cottonseed oil samples showed the same general trend. Clays heated to 450°C bleached better than those activated at 250°C and 350°C. Heat-activated clays show more bleaching power than naturally active clays and because the selective bleaching of natural clays disappears with heating, the results are predictable.
Table 8—Results of bleaching with heat-activated clays.
| Sample no. |
Cottonseed oil, natural color 2 1/2 ASTM Bleached with clays heat treated to |
Lube stock (*1:1 = 8 ASTM) Bleached with clays heat treated to |
Cylinder stock (*1:5 = 8 ASTM) Bleached with clays heat treated to |
||||||
|---|---|---|---|---|---|---|---|---|---|
| 250°C | 350°C | 450°C | 250°C | 350°C | 450°C | 250°C | 350°C | 450°C | |
| 55235 | 1 1/2 | 1 1/2 | 1 | 7 | 7 | 7 | 6 | 5 | 5 |
| 55234 | 1 1/2 | 1 1/2 | 1 | 7 | 7 | 7 | 6 1/2 | 5 | 5 1/2 |
| 55232 | 1 1/2 | 1 1/2 | 1-1 1/2 | 7 | 7 | 7 | 5 | 4 | 4 1/2 |
| 56206 | 1 1/2 | 1 1/2 | 1 | 8 | 8 | 7 | 5 1/2 | 4 1/2 | 4 1/2 |
| 56207 | 1-1 1/2 | 1 1/2 | 1 | 8 | 8 | 7 | 5 1/2 | 5 | 4 1/2 |
| 55230 | 1 1/2 | 1 1/2-2 | 1 | 7 | 7 | 8 | 6 | 4 1/2 | 5 |
| 55231 | 1 1/2 | 1-1 1/2 | 1 | 7 | 7 | 7 | 6 | 4 | 5 |
| 56208 | 1-1 1/2 | 1 1/2 | 1 | 8 | 8 | 7 | 5 | 4 1/2 | 4 1/2 |
| 56147 | 1 1/2 | 1-1 1/2 | 1 | 8 | 8 | 7 | 4 1/2 | 4 | 5 |
| 56122 | 1 1/2 | 1 1/2 | 1 | 8 | 8 | 7 | 5+ | 4+ | 5 |
| 56121 | 1 1/2 | 1 1/2 | 1 | 8 | 8 | 6 | 8 | 5 | 4 1/2 |
| 56119 | 1 1/2 | 1 1/2 | 1 | 7 | 7 | 6+ | 5 1/2 | 2 1/2 | 4 |
| 56120 | 1 1/2 | 1 1/2 | 1-1 1/2 | 8+ | 8 | 7 | 4 1/2 | 5 | 5 |
| Filtrol | 1 | 1 | 1 | 5 | 5 | 5 | 2 | 2 | 2 |
| Attapulgite | 1-1 1/2 | 1-1 1/2 | 1-1 1/2 | 5 | 5 | 5 | 3 | 3 | 3 |
| Kaolin | 1-1 1/2 | 1-1 1/2 | 1-1 1/2 | 6 1/2 | 6 1/2 | 6 1/2 | 5 | 5 | 5 |
| *Dilution ratios, oil to benzene. | |||||||||
Table 9—Results of bleaching with chemically activated clays
| Sample no. |
Color after bleaching | Bleaching factor of clay |
||
|---|---|---|---|---|
| Cottonseed oil, color 2 1/2 |
Lube stock 1:1,* color 8 |
Cylinder stock 1:5,* color 8 |
||
| 55235 | 1 1/2 | 5+ | 1 1/2 | 8 |
| 55234 | 1 | 6 | 3% | 10 1/2 |
| 55232 | 1 | 6 | 1 1/2 | 8% |
| 56206 | 1 | 5 | 2 | 8 |
| 56207 | 1 | 5 1/2 | 2 | 8 1/2 |
| 55230 | 1 | 6 | 2 | 9 |
| 55231 | 1 1/2 | 6 | 2 | 9 1/2 |
| 56208 | 1 | 6 | 4 1/2 | 11 1/2 |
| 56147 | 1 | 6+ | 4 | 11 |
| 56122 | 1 | 6+ | 3% | 10 1/2 |
| 56121 | 1 1/2 | 5+ | 2 | 8 1/2 |
| 56119 | 1 | 6 | 2 | 9 |
| 56120 | 1 1/2 | 6+ | 3 | 10 1/2 |
| Filtrol | 1 | 5 | 2 | 8 |
| Attapulgite | 1-1 1/2 | 5 | 3 | 9 1/2 |
| Kaolin | 1-1 1/2 | 6 1/2 | 5 | 13 |
| * Dilution ratios, oil to benzene | ||||
Neither naturally active nor heat-activated clays bleached all three sets of oil samples with either the degree or regularity of the chemically activated clays (Table 9). This type of activation shows the greatest promise for use on Kansas montmorillonite. For a rapid comparison of the bleaching power of clays tested and shown in Table 9, an arbitrary scale was formulated. The scale or bleaching factor is based on the sum of the numerical values (ASTM color designations) of the colors of the three resultant bleached oils, which gives a scale from 3 (colorless) to 18% (total of unbleached oil colors), 3 being the optimum figure. Kansas bleaching clays compare very favorably with Filtrol, and equal it in the examples of clays 55235 and 56206, one from Clark County and one from Phillips County. The results of testing neither naturally active nor heat-activated clays approach the results derived from clays subjected to chemical activation, but it must be realized that the cost of plants to produce the first two would be much less. It is reasonable to assume also that uses exist or may be developed for which naturally or thermally active clays are ideally suited. But for most present uses, Kansas montmorillonites in chemically activated form could best compete with existing commercial products.
Clark County sample 55234 was chosen at random for alteration by various chemical treatments that have been used in the past to adapt clays for special purposes. The treated clays were analyzed by the chemical procedures outlined by Runnels (Plummer and others, 1954) to determine which elements, if any, affect the physical properties of the clay. The chemical analyses of the treated clay are shown in Table 10. For example, chemical activation of clay with almost any dilute mineral acid has been recommended for bleaching purposes. The effects of a few recommended treatments on the chemical composition are shown by comparison of the acid leach samples (2, 3, 5, 6, Table 10). The various acids, as would be expected, attack different elements of the clay and remove them. The tests indicate that the bleaching power is dependent upon the number of active OH- groups, but is independent of the location of the OH- groups within the clay lattice. Chemically activated clays have metallic atoms removed to leave the silicon atoms of the lattice charged with OH- groups. Bauxitic clays, on the other hand, in which the silica has been leached out, also are good bleaching clays but differ in that the active OH- groups are attached to the aluminum atoms of the clay lattice.
Table 10—Chemical analyses of samples of clay 55234 showing effects of selected chemical treatments.
| Sample no. |
Treatment | Percent | |||||||||||
|---|---|---|---|---|---|---|---|---|---|---|---|---|---|
| SiO2 | Al2O3 | Fe2O3 | TiO2 | CaO | MgO | P2O5 | SO3 | K2O | Na2O | L.O.I., total |
Total | ||
| 1 | Natural clay | 63.36 | 16.54 | 4.00 | 0.92 | 1.13 | 1.72 | 0.14 | tr | 2.52 | 0.23 | 8.96 | 99.52 |
| 2 | 20% H2SO4 leach 4 hours at boiling |
79.84 | 9.56 | 0.98 | 0.96 | 0.39 | 0.24 | ND | 1.51 | 2.64 | 0.23 | 5.14 | 100.62 |
| 3 | 20% HCl 4 hours at boiling |
69.75 | 17.72 | 3.08 | 0.82 | 0.04 | 0.39 | ND | nil | 3.32 | 0.16 | 5.40 | 100.68 |
| 4 | 20% NH4OH 4 hours at boiling |
65.45 | 18.81 | 4.36 | 0.74 | 1.32 | 0.42 | ND | tr | .2.80 | 0.16 | 6.09 | 100.15 |
| 5 | 10% H2SO4 and 10% HaPO4 four hours at boiling |
82.33 | 9.03 | 0.99 | 0.80 | 0.05 | 0.51 | ND | 0.15 | 2.10 | 0.24 | 4.38 | 100.58 |
| 6 | 20% H2SO4 four hours. Boil, wash 20% NH4OH one hour. Boil |
79.73 | 10.67 | 1.22 | 0.87 | 0.15 | 0.67 | ND | nil | 1.92 | 0.25 | 4.23 | 99.71 |
| 7 | 0.5% AmAc four hours at boiling |
66.24 | 17.35 | 4.57 | 0.66 | 0.65 | 1.81 | ND | tr | 2.25 | 0.13 | 6.16 | 99.82 |
| 8 | 2 1/2 Ca(OH)2 24 hours room temp. |
64.74 | 16.88 | 4.29 | 0.79 | 2.41 | 1.81 | ND | tr | 2.60 | 0.25 | 6.18 | 99.95 |
| 9 | 0.3% Na2CO3 24 hours room temp. |
65.34 | 17.13 | 4.64 | 0.40 | 1.34 | 1.81 | ND | tr | 2.70 | 0.56 | 5.83 | 99.75 |
| 10 | 0.3% NaOH 24 hours room temp. |
65.04 | 16.98 | 4.57 | 0.66' | 1.24 | 1.83 | ND | tr | 2.73 | 1.10 | 5.76 | 99.91 |
| 11 | NaCl + Na2CO3 30 days room temp. |
64.78 | 15.32 | 4.90 | 0.34 | 1.30 | 1.92 | ND | tr | 2.50 | 1.94 | 7.13 | 100.13 |
| 12 | NaCl 10-minute boil | 68.31 | 14.93 | 4.32 | 0.91 | 0.91 | 1.60 | ND | 0.09 | 2.63 | 0.92 | 5.44 | 100.06 |
| N.D. = not determined tr. = trace |
|||||||||||||
Table 11—Effect of bleaching cottonseed oil (ASTM color 2 1/2) with chemically activated clays.
| Sample no. |
ASTM color | |
|---|---|---|
| Activated with 20% H2SO4 at boiling for 4 1/2 hours. Washed and dried. |
Activated with 20% HCl at boiling for 4 1/2 hours. Washed and dried. |
|
| 55235 | 1 | 1 |
| 55234 | 1 1/2 | 1 1/2 |
| 55232 | 1 | 1 |
| 56206 | 1 1/2 | 1 1/2 |
| 56207 | 1 1/2 | 1 1/2 |
| 55230 | 1 | 1 |
| 55231 | 1 | 1 |
| 56208 | 1 1/2 | 1 1/2 |
| 56147 | 1 1/2 | 1 1/2 |
| 56122 | 1 | 1 |
| 56121 | 1 | 1 |
| 56119 | 1 | 1 |
| 56120 | 1+ | 1 1/2 |
The two basic chemical activation methods examined are based on hydrochloric and sulfuric acid, which are the least expensive of the mineral acids as well as strong leaching agents. Table 11 shows the results obtained from thirteen test clays activated by sulfuric acid and by hydrochloric acid; the clays were tested with cottonseed oil and, though differing in composition, the two clays paralleled each other very closely in bleaching action.
By comparison of the chemical analyses of Table 10, the elements most affected in clay 55234 by acid treatment can easily be determined. The chemical analysis of the untreated clay is shown at the top of the table. Elements such as silicon in the first column show an increase in percentage because they have been increased relatively by the removal of other parts of the clay lattice, such as aluminum, iron, calcium, and magnesium.
Attempts to ion-exchange the calcium montmorillonite (9, 10, 11, and 12, Table 10) to the nonbleaching sodium form were successful. The application of heat to a saturated sodium chloride solution to which calcium montmorillonite has been added results in an end product comparable to naturally occurring montmorillonite. Similar products have been used as drilling muds for years in Germany and other European countries, which have no deposits of sodium or swelling bentonite. This artificial drill mud swells to several times its own volume in water and performs well as a sealer to prevent water loss. Although it does not swell or gel to the extent that natural sodium bentonite does, it can replace sodium bentonite in many uses.
To increase the sodium content of the clay, various water-soluble sodium salts were tested with sample 55234 and the results are shown in the sodium column of Table 10. Of the sodium salt treatments, a leach at room temperature for 30 days in a solution of 3% sodium chloride and 0.5% sodium carbonate increased the sodium by a factor of 8. A 24-hour leach with 0.3% sodium hydroxide or a 10-minute boiling in saturated sodium chloride solution increased the sodium content of the clay by a factor of 4 over the untreated clay. It was found to be impossible to filter clays treated with sodium salts, even under strong vacuum. Consequently, the clays were allowed to settle and the supernatant liquid was decanted. Samples were diluted with distilled water, stirred, settled and decanted a total of four times. They were then dried at room temperature. A small amount of residual sodium salt doubtless remained as impurity in each sample thus treated, but it should be only a very small part of the analytical totals for sodium. Comparison is made of the D.T.A. patterns of several sodium-treated clays, the natural or untreated clay, and a sample of sodium bentonite from Wyoming (Fig. 4).
Figure 4—D.T.A. patterns of altered and. unaltered clay. Sample 55234, unaltered, shows the D.T.A. graph of calcium montmorillonite. Sample 55234, after NaCl + Na2CO3 treatment, shows the beginning of alteration to sodium montmorillonite after a 24-hour leach at room temperature in 3% Na2CO3 and 0.3% NaCl. Sample 55234, after NaCI treatment, shows almost complete alteration to the sodium form after 30 minutes at boiling in a saturated NaCl solution. The sodium montmorillonite from Clay Spur, Wyoming, was chosen as a typical sodium form of the clay for comparative purposes.
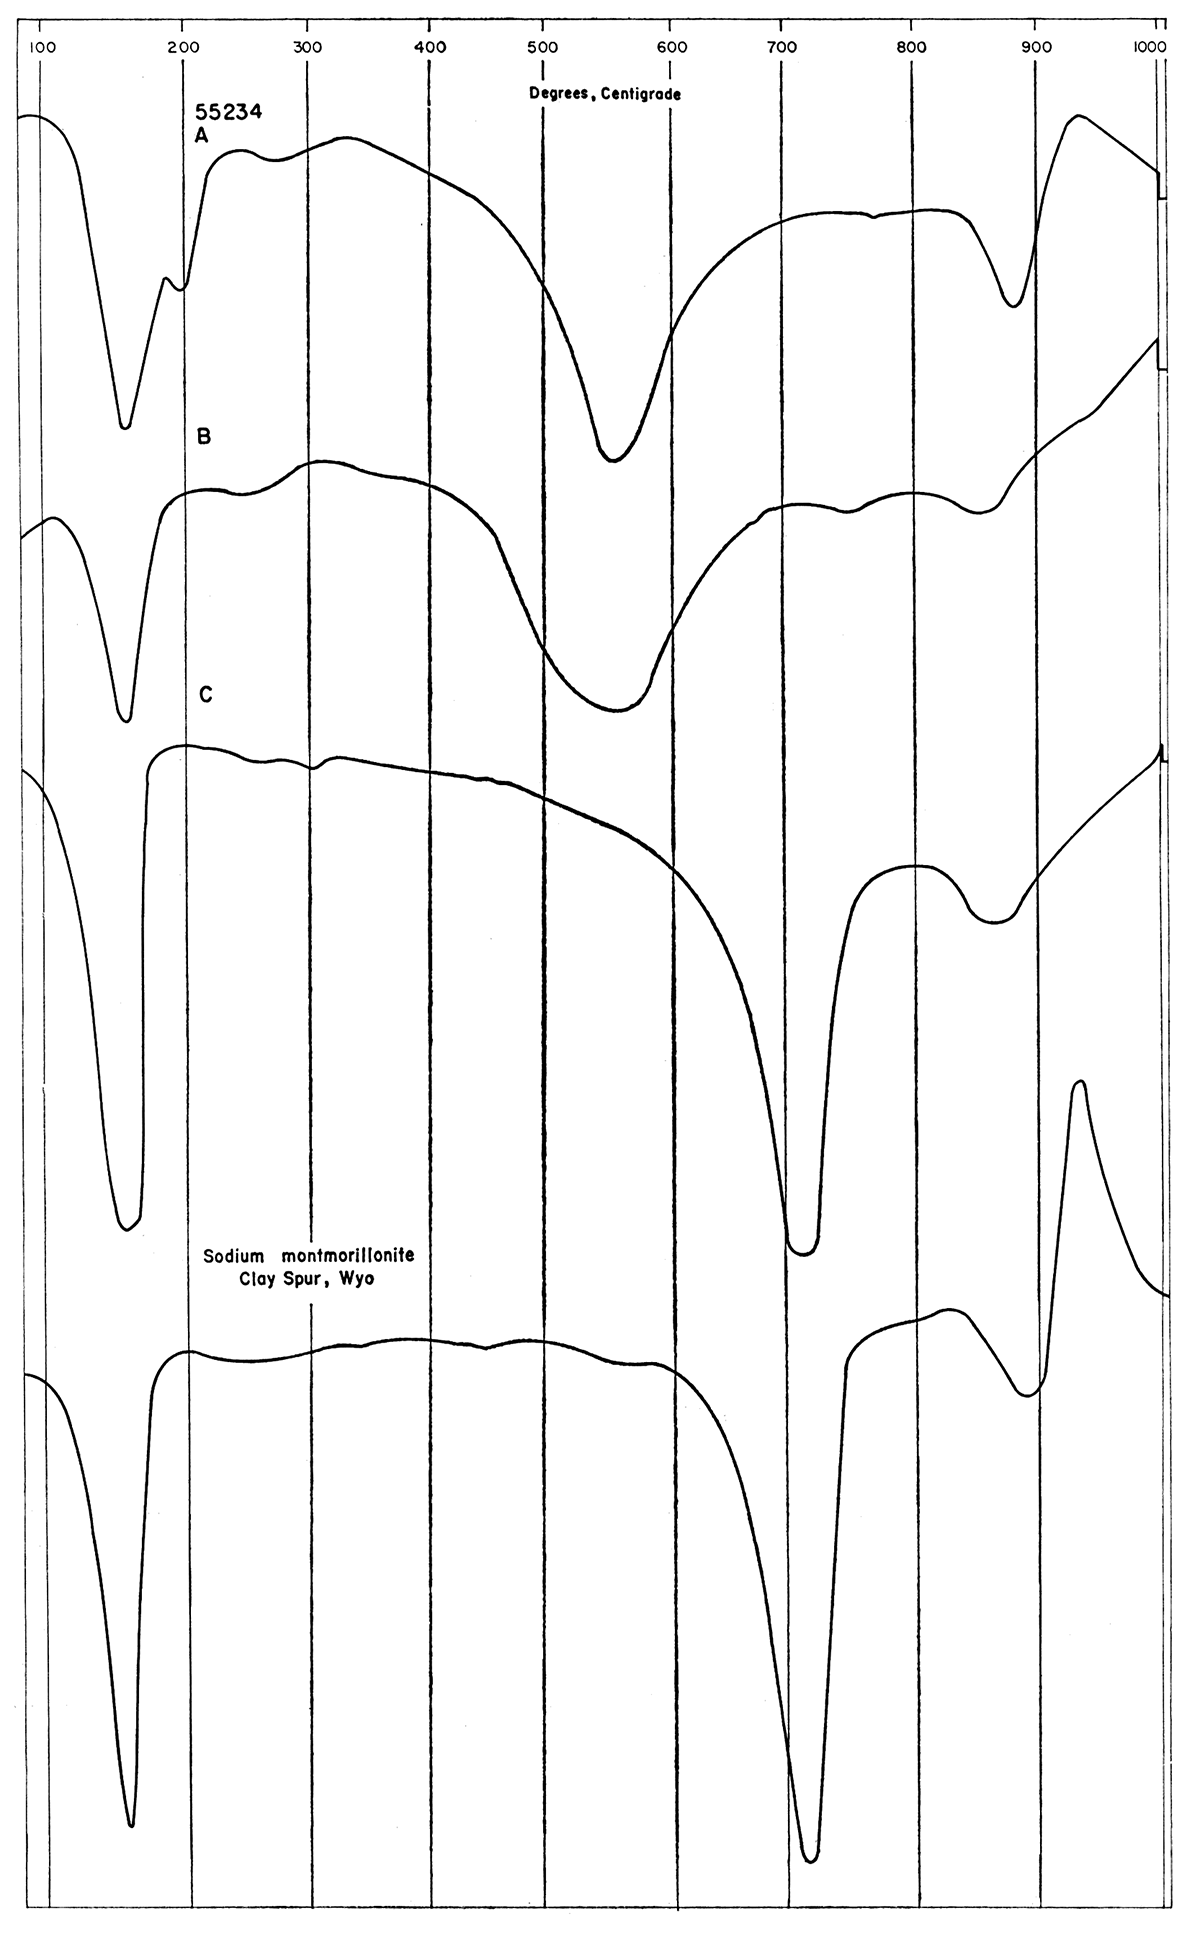
Kansas montmorillonite clays, both chemically treated and untreated, fulfill numerous conditions that must be met for industrial use as bleaching agents. The naturally active clay effectively bleached cottonseed oil and should work well in bleaching light petroleum oils and products such as gasoline and kerosene. Heat-activated clay showed more bleaching power than naturally active clay; samples bleached not only light oils, but dark lubricating and cylinder oil as well. Chemically activated clay proved superior in bleaching power to both naturally active and heat-activated clay. Results of experiments show that chemically activated montmorillonitic clay from Kansas compares favorably with commercial bleaching agents.
Bechtner, Paul (1949) Bentonite, in Industrial minerals and rocks: Amer. Inst. Min. Metal. Eng., p. 119-126.
Blondel, F., and Lasky, S. G. (1956) Mineral reserves and mineral resources: Econ. Geol., v. 51, p. 686-697.
Byrne, F. E., Beck, H. V., and Houston, M. S. (1948) Construction materials in Phillips County, Kansas: U. S. Geol. Survey Circ. 21, p. 1-12, table 1, pl. 1-5. [available online]
Byrne, F. E., Coombs, V. B., and Matthews, C. W. (1951) Construction materials in Graham County, Kansas: U. S. Geol. Survey Circ. 51, p. 1-15. [available online]
de Polo, Taber (1960) Clays (preprint): Mineral facts and problems, 1960 Ed., U. S. Bur. Mines Bull. 585, p. 1-14.
Elias, M. K. (1931) The geology of Wallace County, Kansas: Kansas Geol. Survey Bull. 18, p. 1-254, fig. 1-7, pl. 1-42. [available online]
Frye, J. C., and Leonard, A. R. (1949) Geology and ground-water resources of Norton County and northwestern Phillips County, Kansas: Kansas Geol. Survey Bull. 81, p. 1-144, fig. 1-11, pl. 1-10. [available online]
Frye, J. C., Leonard, A. B., and Swineford, Ada (1956) Stratigraphy of the Ogallala Formation (Neogene) of northern Kansas: Kansas Geol. Survey Bull. 118, p. 1-92. [available online]
Grim, R. E. (1953) Clay mineralogy: McGraw-Hill Book Co., Inc., New York, p.I-384.
Gunsallus, B. L., and Breit, B. A. (1958) Clays; in, 1957 Minerals Yearbook, v. 1, Metals and minerals, p. 363-387.
Kerr, P. F., and Kulp, J. L. (1948) Multiple differential thermal analysis: Am. Mineralogist, v. 33, no. 7, 8, p. 387-419.
Kinney, E. D. (1942) Kansas bentonite, its properties and utilization: Kansas Geol. Survey Bull. 41, pt. 10, p. 349-376. [available online]
Landes, K. K. (1937) Mineral resources of Kansas counties: Kansas Geol. Survey Min. Res. Circ. 6, p. 1-110. [available online]
Landes, K. K., and Keroher, R. P. (1942) Mineral resources of Phillips County: Kansas Geol. Survey Bull. 41, pt. 8, p. 277 -312. [available online]
Lange, N. A. (1956) Handbook of chemistry: 9th Ed.; Handbook Publishers, Inc., Sandusky, Ohio.
Plummer, Norman, Swineford, Ada, Runnels, R. T., and Schleicher, J. A. (1954) Chemical, petrographic, and ceramic properties of four clays from the Dakota Formation in Kansas: Kansas Geol. Survey Bull. 109, pt. 10, p. 153-216. [available online]
Schoewe, W. H. (1942) Bentonite; in, Kansas mineral resources for wartime industry, J. M. Jewett and W. H. Schoewe: Kansas Geol. Survey Bull. 41, pt. 3, p. 60-180. [available online]
Smith, H. T. U. (1940) Geologic studies in Southwestern Kansas: Kansas Geol. Survey Bull. 34, p. 1-212, fig. 1-22, pl. 1-34. [available online]
Stone, R. L., and Rase, H. F. (1957) Differential thermal analysis; new technique for testing silica-alumina catalysts: Analytical Chemistry, v. 29. Sept., p. 1273-1277.
Kansas Geological Survey
Placed on web Dec. 17, 2018; originally published Sept. 15, 1960.
Comments to webadmin@kgs.ku.edu
The URL for this page is http://www.kgs.ku.edu/Publications/Bulletins/142_4/index.html