Kansas Geological Survey, Bulletin 142, pt. 3, originally published in 1960
Originally published in 1960 as Kansas Geological Survey Bulletin 142, pt. 3. This is, in general, the original text as published. The information has not been updated. An Acrobat PDF version (2.3 MB) is also available.
Chemical analyses of channel samples from members of the Wyandotte Limestone indicate three areas of high-purity limestone (96 to 98 percent carbonate) within 30 miles of the industrial districts of Kansas City. These areas are worthy of commercial exploration as potential sources of raw material for manufacture of quick or hydrated lime. Known geologic, chemical, and economic factors affecting development are presented for each area. Basic lime manufacturing processes and the magnitude of the lime industry are summarized briefly.
Although many limestones crop out in eastern Kansas and chalk crops out in a broad belt in western Kansas, their commercial utilization is limited to making Portland cement, natural cement, limestone aggregate, building stone, and limestone fertilizer. These products constitute a large portion of the total value (excluding mineral fuels) of Kansas mineral production each year. Lime, however, has never been manufactured commercially, and other industrial use of Kansas limestone has been limited to emergency periods when normal imports were cut off. For a brief time during World War I, Kansas limestone was used for the manufacture of soda ash. Similarly, during World War II, a few carloads of Kansas chalk were sold to substitute for English chalk as "whiting" in calcamine paints. The pioneer kilns that produced lime for local consumption had generally been abandoned by 1900. Very minor tonnages of limestone continue to be used from time to time as flux by local foundries.
Detailed study of limestones, begun in 1946 by the State Geological Survey, has demonstrated that high-purity limestones are more common than previously suspected. These high-purity limestones are an important mineral resource and should serve as raw materials for chemical plants and industries new to the state of Kansas.
Systematic collection and analysis of samples of Kansas limestone and chalk was begun in 1946. A geochemical study of the Cretaceous chalks (Runnels and Dubins, 1949) revealed that they contained more carbonate than had been suspected; the average for all samples was 93.4% calcium carbonate. Samples from two localities in Smith County had a maximum of 98% calcium carbonate.
Later, systematic sampling was begun of the Permian and Pennsylvanian limestones. Runnels (1951) reported 18 samples, representing 14 different limestone formations, having a calcium carbonate content above 90%; in 5 of these samples, representing 4 different limestone formations, it exceeded 95%. Runnels and Schleicher (1956) reported on chemical analyses of 325 samples of Kansas limestones. Samples from many locations showed a calcium carbonate content of 95 to 98 percent. The weighted average of these 325 limestone samples is 87.89% CaCO3, 3.39% MgCO3, 6.09% SiO2, 1.16% Al2O3, and 1.14% Fe2O3.
The carbonate content of a limestone must exceed 95% before it can qualify as a raw material for lime manufacture. Of those limestones containing more than 95% calcium carbonate, a part of the Wyandotte Limestone was selected for this study because it is near Kansas City industrial districts. During field work, samples were collected from many fresh exposures, such as quarry faces, road cuts, and excavations at dam sites and for pipelines. Additional data were obtained through analysis of cores donated by Natural Storage, Inc., of Bonner Springs, and Reno Construction Company of Overland Park. All the samples but one were channel samples, either chip channel or strip channel. The chip channel samples were taken by chipping off small fragments along a continuous vertical line from top to bottom of the ledge or core, whereas strip channei samples were taken by sawing off a strip from one side of a core. The compound sample was obtained by selecting pieces from a large quantity of freshly blasted rock.
Samples were chemically analyzed for: calcium oxide (CaO), magnesium oxide (MgO), silica (SiO2), titania (TiO2), alumina (Al2O3), total iron as (Fe2O3), sulfate sulfur (SO3) , sulfide sulfur (S), phosphorus pentoxide (P2O5), alkalies (K2O and Na2O) , and loss on ignition. The analyses were made in the Survey geochemistry laboratory.
The region in which the Wyandotte Limestone was studied (Plate 1) includes parts of Leavenworth, Miami, and Wyandotte Counties and most of Johnson County, Kansas.
Topography, drainage, and culture of the region studied are shown at a scale of 1: 24000 on these U.S. Geological Survey quadrangles: Belton, Bonner Springs, Bucyrus, DeSoto, Edwardsville, Gardner, Grandview, Kansas City, Lenexa, Ocheltree, Olathe, Shawnee, and Stilwell.
Through the years as geologic investigations have been made in the vicinity of Kansas City, numerous residents and businessmen have given Survey staff members much valuable assistance. This aid is gratefully acknowledged. For their contribution to this study, the authors especially thank G. M. Reno, Reno Construction Company, Overland Park; Pat Conlan, Natural Storage, Inc., Bonner Springs; and J. H. Griffith, Lone Star Cement Company, Bonner Springs. Several members of the Survey staff made geologic contributions, which are acknowledged individually in the text. W. E. Hill, Jr., Wanda Waugh, and O. K. Galle made several of the chemical analyses.
Lime is produced from limestone by calcining, a process in which carbon dioxide is driven off by heating the limestone to temperatures of 2000° to 2500°F. During calcining, limestone loses about 43% of its original weight through the departure of the carbon dioxide; thus, noncarbonate constituents of the limestone make up an increased portion of the resulting lime. The direct product of calcining is calcium oxide (CaO), which is known commercially as quicklime. The measured addition of water to quicklime produces calcium hydroxide (Ca(OH)2), known commercially as hydrated lime, which is easy to handle and store. For many industrial uses, either hydrated lime or quicklime can be used; therefore, much lime is marketed as hydrated lime. Quicklime generally presents storage problems because it has a natural affinity for water. Contact with moisture starts the reaction to calcium hydroxide and an accompanying evolution of heat. Therefore, quicklime storage must be water- and air-tight to eliminate a potential fire hazard.
Fundamentally, the process for lime production has changed very little since Biblical days. To meet modern industrial needs, however, lime producers have developed many refinements and adaptations. A modern user commonly specifies a general chemical purity, specific limitations on amounts of constituents other than CaO, certain size limits, and a certain time period for slaking or activity to occur. Rotary kilns, fluid-solids furnaces, and vertical kilns fired by gas, coal, or oil are used to meet the demand by different consumers for specific properties.
Lime usage may be discussed under five categories: construction, agriculture, chemical and industrial processes, metallurgy, and manufacture of refractories. The U.S. Bureau of Mines commonly includes metallurgical with chemical and industrial uses. The variety of uses of limestone is shown in Figure 1. Many industries use both lime and limestone. To summarize briefly the tremendous quantities involved in lime production and the diverse industries making up the market for lime, tables from the U.S. Bureau of Mines 1957 Minerals Yearbook are included. Table 1 lists tonnage of lime by major categories and by uses, prices, number of producing plants, imports, and exports in recent years. Table 2 shows by type and by major uses the total tonnages utilized during 1956 and 1957, whereas Table 3 gives the specific use for the same two-year period.
Figure 1—Uses of limestone.
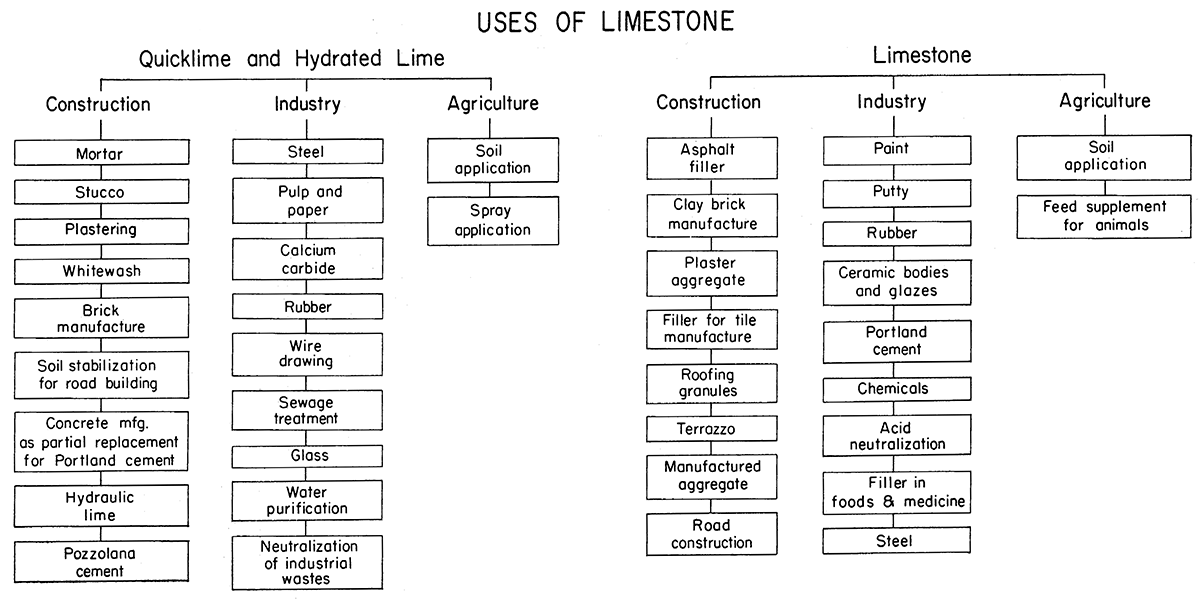
Table 1—Salient statistics of lime sold or used in the United States, 1948-52 (average) and 1953-57 (From Patterson and Foley, 1958, table 1.) All quantities are stated in short tons.
| 1948-52 (average) |
1953 | 1954 | 1955 | 1956 | 1957 | ||||
|---|---|---|---|---|---|---|---|---|---|
| Active plants | 169 | 156 | 154 | 150 | 153 | 146 | |||
| Sold or used by producers: | |||||||||
| By types: | |||||||||
| Quicklime | 3,933,515 | 5,337,268 | 5,128,370 | 6,113,215 | 5,967,140 | 5,942,360 | |||
| Hydrated lime | 1,840,864 | 2,042,100 | 1,979,895 | 2,237,753 | 2,186,247 | 2,080,718 | |||
| Dead-burned dolomite | 1,703,478 | 2,294,815 | 1,520,854 | 2,128,960 | 2,423,909 | 2,251,428 | |||
| Total lime: | |||||||||
| Quantity | 7,477,857 | 9,674,183 | 8,629,119 | 10,479,928 | 10,577,296 | 10,274,506 | |||
| Value1 | $83,979,215 | $112,158,060 | $101,723,102 | $127,144,035 | $135,727,133 | $135,322,835 | |||
| Per ton | $11.20 | $11.59 | $11.79 | $12.13 | $12.83 | $13.17 | |||
| Total open-market lime | 7,038,909 | 8,114,396 | 7,180,159 | 8,929,803 | 9,004,139 | 8,516,132 | |||
| Total captive tonnage lime | 438,9482 | 1,559,787 | 1,448,960 | 1,550,125 | 1,573,157 | 1,758,374 | |||
| By uses: | |||||||||
| Agricultural | 344,103 | 329,455 | 323,557 | 305,417 | 252,035 | 208,600 | |||
| Building | 1,173,401 | 1,166,240 | 1,130,032 | 1,309,774 | 1,203,005 | 1,101,310 | |||
| Chemical and Industrial | 4,256,875 | 5,883,673 | 5,654,676 | 6,735,777 | 6,698,347 | 6,713,168 | |||
| Refractory (dead-burned dolomite) | 1,703,478 | 2,294,815 | 1,520,854 | 2,128,960 | 2,423,909 | 2,251,428 | |||
| Imports for consumption | 32,455 | 37,202 | 36,298 | 39,616 | 41,691 | 49,666 | |||
| Exports | 60,351 | 79,934 | 73,246 | 82,461 | 82,737 | 65,195 | |||
| (1) Selling value, f.o.b. plant, excluding cost of containers. (2) Incomplete figures; before 1953 the coverage of captive plants was incomplete. |
|||||||||
Table 2—Lime sold or used by producers in the United States(1), 1956-57, by types and major uses, in short tons. (From Patterson and Foley, 1958, table 3.)
| 1956 | 1957 | Change from 1956, percent |
|||||||||
|---|---|---|---|---|---|---|---|---|---|---|---|
| Sold | Used | Total | Percent of total |
Sold | Used | Total | Percent of total |
||||
| By type: | |||||||||||
| Quicklime | 7,047,079 | 1,343,970 | 8,391,049 | 79 | 6,650,584 | 1,543,204 | 8,193,788 | 80 | -2 | ||
| Hydrated lime | 1,957,060 | 229,187 | 2,186,247 | 21 | 1,865,548 | 215,170 | 2,080,718 | 20 | -5 | ||
| Total lime | 9,004,139 | 1,573,157 | 10,577,296 | 100 | 8,516,132 | 1,758,374 | 10,274,506 | 100 | -3 | ||
| By use: | |||||||||||
| Agricultural: | |||||||||||
| Quicklime | 96,049 | 80 | 96,129 | 1 | 69,382 | 69,382 | 1 | -28 | |||
| Hydrated lime | 155,857 | 49 | 155,906 | 1 | 139,218 | 139,218 | 1 | -11 | |||
| Total | 251,906 | 129 | 252,035 | 2 | 208,600 | 208,600 | 2 | -17 | |||
| Building: | |||||||||||
| Quicklime | 123,918 | 54,890 | 178,808 | 2 | 98,529 | 43,545 | 142,074 | 1 | -21 | ||
| Hydrated lime | 1,009,465 | 14,732 | 1,024,197 | 10 | 939,160 | 20,076 | 959,236 | 10 | -6 | ||
| Total | 1,133,383 | 69,622 | 1,203,005 | 12 | 1,037,689 | 63,621 | 1,101,310 | 11 | -8 | ||
| Chemical and other industrial: | |||||||||||
| Quicklime | 4,425,146 | 1,267,057 | 5,692,203 | 54 | 4,250,964 | 1,479,940 | 5,730,904 | 56 | +1 | ||
| Hydrated lime | 791,738 | 214,406 | 1,006,144 | 9 | 787,170 | 195,094 | 982,264 | 9 | -2 | ||
| Total | 5,216,884 | 1,481,463 | 6,698,347 | 63 | 5,038,134 | 1,675,034 | 6,713,168 | 65 | (2) | ||
| (1) Includes Hawaii and Puerto Rico. (2) Less than 1 percent. |
|||||||||||
Table 3—Lime (quick and hydrated) sold or used by producers in the United States, 1956-57, by uses (short tons). (Adapted from Patterson and Foley, 1958, table 7)
| 1956 | 1957 | |||||||
|---|---|---|---|---|---|---|---|---|
| Open-market | Captive | Total | Open-market | Captive | Total | |||
| Agriculture. | 251,906 | 129 | 252,035 | 208,600 | 208,600 | |||
| Building: | ||||||||
| Finishing lime. | 660,422 | 5,285 | 665,707 | 503,108 | 4,400 | 507,508 | ||
| Mason's lime. | 441,224 | 5,980 | 447,204 | 437,824 | 6,529 | 444,353 | ||
| Other (includes masonry mortar) | 31,737 | 58,357 | 90,094 | 96,757 | 52,692 | 149,449 | ||
| Total | 1,133,383 | 69,622 | 1,203,005 | 1,037,689 | 63,621 | 1,101,310 | ||
| Industrial | ||||||||
| Alkalies (NH3, K, and Na compounds) |
3,151 | 894,228 | 897,379 | 13,490 | 843,932 | 857,422 | ||
| Brick, sand-lime, and slag. | 16,789 | 100 | 16,889 | 14,525 | 14,525 | |||
| Brick, silica (refractory). | 22,548 | 22,548 | 25,158 | 50 | 25,208 | |||
| Calcium carbide and cyanamide. | 781,626 | 781,626 | 739,877 | 739,877 | ||||
| Calcium carbonate (precipitated) . |
32,763 | 32,763 | 36,738 | 36,738 | ||||
| Coke and gas (gas purification and plant byproducts). |
31,500 | 31,500 | 18,922 | 18,922 | ||||
| Explosives. | 5,314 | 5,314 | 4,563 | 4,563 | ||||
| Food and food byproducts. | 28,231 | 28,231 | 5,230 | 5,230 | ||||
| Glassworks. | 287,924 | 287,924 | 259,300 | 259,300 | ||||
| Glue. | 2,808 | 2,808 | 3,668 | 3,668 | ||||
| Grease, lubricating. | 11,071 | 11,071 | 13,222 | 13,222 | ||||
| Insecticides, fungicides, and disinfectants. |
70,069 | 70,069 | 62,998 | 62,998 | ||||
| Metallurgy: | ||||||||
| Steel (open-hearth and electric furnace flux). |
1,349,521 | 147,346 | 1,496,867 | 1,319,166 | 143,451 | 1,462,617 | ||
| Ore concentration. (1) | 200,715 | 342,178 | 542,893 | 202,491 | 366,890 | 569,381 | ||
| Wire drawing. | 12,820(2) | 12,820 | 12,818 | 12,818 | ||||
| Other (3) | 130,504 | 130,504 | 125,202 | 125,202 | ||||
| Oil drilling. | 18,248 | 18,248 | 16,317 | 16,317 | ||||
| Paints. | (4) | (4) | 22,555 | (4) | (4) | 15,249 | ||
| Paper mills. | (4) | (4) | 857,254 | (4) | (4) | 817,466 | ||
| Petrochemicals (glycol). | 110,945 | 110,945 | (4) | (4) | ||||
| Petroleum refining. | 35,841 | 35,841 | 35,834 | 35,834 | ||||
| Rubber manufacture. | 2,487 | 2,487 | 2,799 | 2,799 | ||||
| Sewage and trade-waste treatment. |
106,164 | 2,524 | 108,688 | 123,048 | 55 | 123,103 | ||
| Sugar refining | (4) | (4) | 36,433 | 30,033 | 7,067 | 37,100 | ||
| Tanneries. | 74,905 | 74,905 | 70,397 | 70,397 | ||||
| Water purification. | 638,456 | 23,904 | 662,360 | 640,504 | 23,850 | 664,354 | ||
| Undistributed. (5) | 1,050,637(2) | 70,804 | 205,199(2) | 1,097,001 | 119,839 | 384,125 | ||
| Unspecified. | 191,847 | 379 | 192,226 | 164,833 | 169,900 | 334,733 | ||
| Total | 5,216,884 | 1,481,463 | 6,698,347 | 5,038,134 | 1,675,034 | 6,713,168 | ||
| (1) Includes flotation, cyanidation, bauxite purification, and magnesium manufacture. (2) Revised figure. (3) Includes barium and vanadium processinp:, cupola, gold recovery, and unspecified metallurgical uses. (4) Included with "undistributed" and "total' columns to avoid disclosing individual company confidential data. (5) Includes alcohol, asphalt, medicine and drugs, magnesium products, paints, paper mills, polishing compounds, retarder, salt, soap and fat, sugar, sulfur, varnish, and miscellaneous industrial uses. |
||||||||
Specifications for chemical use of lime are perhaps the most detailed. As mentioned before, calcining removes about 43% of the original weight of the limestone (pure calcium carbonate contains 43.97% carbon dioxide) and increases the noncarbonate constituents by a factor of 1.75 in the lime produced. Thus, to obtain lime containing 90% CaO (assumed as the minimum commercial grade), the noncarbonates in a limestone cannot exceed 5.7% before calcining. In order to meet specifications for all grades of chemical lime and fiuxstone, a limestone must be about 98% calcium (and magnesium) carbonate. Minimum specifications for many chemical uses of lime have been established by the American Society for Testing Materials. ASTM specifications for several uses for which the Wyandotte seems suitable are summarized in Tables 4-14.
Table 4—Quicklime and hydrated lime for water treatment (ASTM C53:52T).
| Type A | for water softening. |
| Type B |
for removing silica from boilers, color removal and clarification of water for municipal and industrial supplies.
|
Table 5—Quicklime for calcium carbide manufacture (ASTM C258:52).
| Total calcium oxide, min. % | 92.0 |
| Magnesium oxide, max. % | 1.75 |
| Silica (SiO2), max. % | 2.0 |
| Combined iron and aluminum oxides (Fe2O3 and Al2O3), max. % | 1.0 (0.5%Fe2O3) |
| Sulfur (S), max. % | 0.2 |
| Phosphorus (P), max. % | 0.02 |
| Loss on ignition, place of manufacture, max. % | 4.0 |
Table 6—Hydrated lime for masonry purposes (ASTM C207:49)
| Type N | Type S | |
|---|---|---|
| CaO and MgO (N.V. basis), min. % | 95 | 95 |
| Carbon dioxide (as received basis), max. %, place of manufacture |
5 | 5 |
| Carbon dioxide (as received basis), max. %, any other place |
7 | 7 |
| Unhydrated oxides (as received), max. % | 8 |
Table 7—Quicklime for structural purposes (ASTM C5:26).
| Calcium lime | Magnesium lime | |
|---|---|---|
| Calcium oxide, min. % | 75 | |
| Magnesium oxide, min. % | 20 | |
| Calcium and magnesium oxide, min. % | 95 | 95 |
| Silica, alumina, and oxide of iron, max. % | 5 | 5 |
| Carbon dioxide, max. %, place of manufacture | 3 | 3 |
| Carbon dioxide, max. %, any other place | 10 | 10 |
Table 8—Normal finishing hydrated lime, Type N (ASTM C6:49).
| Calcium and magnesium oxides (non-volatile basis), min. % | 95 |
| Carbon dioxide, at place of manufacture, max. % | 5 |
| Carbon dioxide, at any other place, max. % | 7 |
Table 9—Special finishing hydrated lime, Type S (ASTM C206:49)
| Calcium and magnesium oxides (non-volatile basis), min. % | 95 |
| Carbon dioxide, at place of manufacture, max. % | 5 |
| Carbon dioxide, at any other place, max. % | 7 |
| Unhydrated oxides, max. % | 8 |
Table 10—Quicklime and hydrated lime for sand-lime products (ASTM C415:58T).
| CaO (non-volatile basis), min. % | 90.0 |
| MgO (non-volatile basis), max. % | 2.5 |
| Combined iron and aluminum oxides, max. % | 1.5 |
| Silica and insoluble matter, max. % | 3.0 |
| Carbon dioxide, at place of manufacture, max. % | 2.5 |
Table 11—Quicklime and hydrated lime for silica brick manufacture, non-volatile basis (ASTM C49:57).
| CaO, min. % | 90.0 |
| MgO, max. % | 2.5 |
| Combined iron and aluminum oxides, max. % | 1.5 |
| Silica and insoluble matter, max. % | 3.0 |
| Carbon dioxide, place of manufacture, max. % | 2.5 |
Table 12—Quicklime and hydrated lime for cooking of rags in paper manufacture (ASTM C45:25).
| Quicklime | Hydrated lime | |
|---|---|---|
| Available lime, percent: | 90.0 | 64.3 (85% calcium hydroxide) |
Table 13—Quicklime for sulfite pulp manufacture, volatile basis (ASTM C46:27).
| Calcium lime | Magnesium lime | |
|---|---|---|
| CaO, min. % | 92.5 | 55.4 |
| MgO, % | 2.5 max. | 39.6 min. |
| Oxides of silicon, iron, and aluminum, max. % | 3.0 | 3.0 |
Table 14—Hydrated lime for grease manufacture (ASTM C259:52).
| Available calcium hydroxide Ca(OH)2, min. % | 90.0 |
| Magnesium oxide, max. % | 1.5 |
| Silica (SiO2), max. % | 1.0 |
| Iron oxide (Fe2O3), max. % | 0.5 |
Reports by Newell (1935) and Jewett and Newell (1935) were used as guides during the field work, and the following brief geologic discussion is based partly on these publications.
The Wyandotte Limestone takes its name from Wyandotte County. It is divided into five members, from top to bottom, the Farley Limestone, Island Creek Shale, Argentine Limestone, Quindaro Shale, and Frisbie Limestone. The stratigraphic position and succession of beds in the Wyandotte Limestone and several adjacent units are shown in Table 15. Naturally, for lime production, we are interested only in limestones. Of these, only two limestone members in the Wyandotte, the Farley and the Argentine, are thick enough to permit economical production.
Table 15—Classification of the Wyandotte Limestone and adjacent formations. From Jewett (1959).
| Group | Sub-group | Formation | Member | ||
|---|---|---|---|---|---|
| Pennsylvanian System |
Missourian Stage |
Lansing (in part) |
Plattsburg Limestone | Spring Hill Limestone | |
| Hickory Creek Shale | |||||
| Merriam Limestone | |||||
| Kansas City (in part) |
Zarah | Bonner Springs Shale | |||
| Wyandotte Limestone |
Farley Limestone | ||||
| Island Creek Shale | |||||
| Argentine Limestone | |||||
| Quindaro Shale | |||||
| Frisbie Limestone | |||||
| Lane Shale | |||||
| Linn | Iola Limestone | Raytown Limestone | |||
| Muncie Creek Shale | |||||
| Paola Limestone | |||||
The Argentine Limestone is the most persistent division of the formation, in lithology, in areal extent, and thickness. It is generally the thickest limestone seen in the Kansas City area. Observed thickness of the Argentine Limestone ranges from approximately 15 to 55 feet but generally is between 20 and 30 feet. Individual beds range from 0.1 to 1.0 foot in thickness; bedding surfaces are wavy. Quarries in this limestone are numerous in the Kansas City area.
In contrast to the Argentine, the Farley Limestone is extremely variable in its lithology and thickness. The sequence of beds between the Argentine Limestone below and the readily recognizable Merriam Limestone above is formally divided into the Island Creek Shale and Farley Limestone members of the Wyandotte Limestone, and the Bonner Springs Shale (Table 15). To make this classification workable in the field, geologists customarily regard the shale directly below the Merriam as the Bonner Springs and the shale directly above the Argentine as the Island Creek and assign all limestone beds and any intervening shale and sandstone beds to the Farley. Thus, depending upon the locality visited, one may see the Farley as a thick limestone, two limestones separated by shale, or even three limestones with intervening shales. If any sequence is "typical" (that is, most commonly observed) for the Farley, it would consist of a limestone below, a shale or at least a shaly unit in the middle, and a limestone, generally thicker than the lower one, above. At a few exposures, the shale unit in the middle is insignificant or absent, resulting in a limestone of considerable thickness. The discovery that these thick sections of Farley limestone at several locations have an extremely low noncarbonate content suggested its suitability for lime manufacture.
Discussion of stratigraphic details of the Wyandotte Limestone is beyond the scope of this report. Currently, H. G. O'Connor is preparing a report on geology and ground-water resources of Johnson County, and J. M. Jewett, S. M. Ball, and W. Ives are preparing a comprehensive report on the stratigraphy of the Wyandotte Limestone in its area of exposure in Kansas. Jewett and Ball have contributed to our understanding of the Wyandotte through cooperative field work and free exchange of deductions and interpretations concerning its stratigraphy.
The Farley and Argentine Limestones were studied by examination of outcrops and many well logs (supplied by H. G. O'Connor) throughout the region shown in Plate 1. On the assumption that either mining or quarrying of a suitable limestone would require a thickness of at least 12 feet and the absence of shale layers within this thickness, certain portions of the study region were eliminated from further consideration because these requirements were not met. As an example, the Farley exposed in a railroad cut in the center of the NE sec. 1, T. 13 S., R. 23 E., Johnson County, includes an upper limestone unit 6.7 feet thick and a lower unit 8.4 feet thick containing much interbedded shale. Excessive amounts of interbedded shale disqualified much of the Farley member for two reasons: (1) in our experience interbedded shale generally indicates that the Fe2O3 and Al2O3 content will exceed maximum values allowable for lime, and (2) shale layers may present many difficulties for a mining operation. A great thickness of overburden was an eliminating factor because the cost of getting at the limestone would put the area at a competitive disadvantage with areas of high-quality limestone having little or no overburden. Maximum content of noncarbonate constituents of the limestone permissible for lime manufacture were set at 3 percent for silica, 1 percent for iron oxide, and 1 percent for alumina. Much of the study region was eliminated from further consideration because the quality of the rock did not fall within these limitations. Chemical analysis showed that thick nonshaly limestone at several locations contained too much of one or more of these constituents. Finally, those parts of the study region occupied by residential housing and within corporate limits of cities were automatically excluded because mining operations are prohibited by statute in some of these zones, and it was assumed that persons objecting to mining operations would probably be successful in preventing development in others of these zones. In summary, the factors used to eliminate areas of Wyandotte Limestone from further consideration for this study were: 1. a limestone thickness less than 12 feet, 2. an excess of interbedded shale, 3. a thickness of overburden judged too great for economic operation, 4. an excess of noncarbonate constituents, and 5. a zone of heavy population.
After elimination of portions of the study region where any of the above factors were found, there remained three areas where geologic and chemical data indicate limestone qualified as potential raw material for lime manufacture. Analysis of samples of Argentine Limestone showed that in a few localities it would make lime suitable for some uses. For this reason some analyses of the Argentine are included in Tables 14 and 16.
The authors use the terms "possible reserves" and "probable reserves" in the following discussion. "Possible reserves" infers the assumption that, because of present knowledge of geologic and chemical character of the Wyandotte, high-purity limestone is present in considerable volume but actual extent and location are unknown. "Probable reserves" is applied to areas for which data from drilling are sufficient to imply, but not prove, continuity of the high-purity limestone.
[Note: While the report was in preparation, Mid-Continent Quarries, Inc., announced plans to manufacture lime at Loring. (Kansas City Star, January 3, 1960, p. 9-A).]
In the general vicinity of the town of Bonner Springs, considerable use is made of the Wyandotte Limestone; the Argentine and Farley members are quarried as raw materials for making cement by the Lone Star Cement Company, and the mine of Loring Quarries, Inc., is in the Argentine member. Analyses of samples from locations outside the Loring area are included in Table 16 for comparison.
The probable reserves area (24 on Plate 1) is essentially that blocked out by ten cores taken in September 1956, by Loring Quarries, and made available for study. Prior to acquisition of the cores, several chip channel samples of the quarry face were analyzed chemically. A strip channel sample was sawed from a core and analyzed. Results of analyses are shown in Table 16.
Table 16—Description and chemical analysis of samples from in and near Loring Area (A on Plate 1).
| No. on Pl. 1 |
Member, bed, and feet sampled (1) |
Sample type (2) |
Location | KSGS lab no. |
Chemical constituents | |||||||||||||||
|---|---|---|---|---|---|---|---|---|---|---|---|---|---|---|---|---|---|---|---|---|
| Calcium oxide (CaO) |
Magnesium oxide (MgO) |
Silica(SiO2) | Titania (TiO2)(3) |
Alumina (Al2O3) |
Total iron (Fe2O3) |
Sulfate sulfur (SO4) |
Sulfide sulfur (S)(7) |
Phosphorus pentoxide (P2O5) |
Potassium oxide (K2O) |
Sodium oxide (Na2O) |
Loss on ignition | Total | Calculated CaCO3 |
Calculated MgCO3 |
||||||
| Carbonate | Non-(8) carbonate |
|||||||||||||||||||
| 24 | Far, up 22 | Cp Ch | Face, Loring Quarry, NW SW 13-12-22E |
49276 | 54.04 | 0.98 | 1.30 | ND(4) 0.30 | 0.39 | 0.10 | ND | tr(5) | ND | ND | 42.87 | ND | 99.98 | 96.36 | 2.05 | |
| 24 | Far, low 5 | Cp Ch | Face, Loring Quarry, NW SW 13-12-22E |
49224 | 52.58 | 1.56 | 2.13 | ND | 0.38 | 0.47 | tr | ND | 0.11 | ND | ND | 42.54 | ND | 99.77 | 93.36 | 3.26 |
| 24 | Far, up 22 | Cp Ch | Face, Loring Quarry, NW SW 13-12-22E |
50351 | 54.41 | 0.75 | 0.93 | ND | 0.45 | 0.53 | 0.04 | ND | 0.04 | ND | ND | 41.92 | ND | 99.22 | 96.79 | 1.57 |
| 24 | Far, up 24 | St Ch | Core, Loring Quarry | 599 | 52.23 | 1.92 | 1.58 | 0.02 | 0.38 | 0.57 | 0.02 | 0.16 | 0.05 | 0.04 | 0.02 | 42.84 | 0.23 | 100.22 | 93.04 | 3.74 |
| 24 | Far, low 9.5 | St Ch | Core, Loring Quarry | 5927 | 43.56 | 3.35 | 9.63 | 0.15 | 2.64 | 1.27 | 0.04 | 0.26 | 0.05 | 0.45 | 0.21 | 37.47 | 0.68 | 99.99 | 77.57 | 6.44 |
| 24 | Arg, up 6 | St Ch | Core, Loring Quarry | 5928 | 50.68 | 1.03 | 4.51 | 0.09 | 1.53 | 0.49 | 0.08 | 0.16 | 0.11 | 0.20 | 0.06 | 40.49 | 0.43 | 99.75 | 90.09 | 1.69 |
| 24 | Arg, next 10 | St Ch | Core, Loring Quarry | 5929 | 52.71 | 0.81 | 2.67 | 0.05 | 0.73 | 0.51 | 0.09 | 0.10 | 0.09 | 0.07 | 0.04 | 41.83 | 0.30 | 99.96 | 93.75 | 1.17 |
| 24 | Arg, low 22 | St Ch | Core, Loring Quarry | 5930 | 45.43 | 2.04 | 11.47 | 0.08 | 1.32 | 1.03 | 0.06 | 0.13 | 0.06 | 0.21 | 0.13 | 37.60 | 0.43 | 99.94 | 80.87 | 3.91 |
| 20 | Far, up 9.5 | Cp Ch | Face, Thedon Quarry NE cor SE 29-11-23E |
57245 | 53.31 | 0.88 | 0.93 | ND | 0.26 | 1.17 | tr | tr | 0.05 | tr | 0.02 | 42.69 | 0.35 | 99.66 | 95.02 | 1.74 |
| 22 | Far, up 11 | Cp Ch | Face, Bennett Quarry cen S line 13-11-22E |
5966 | 53.46 | 0.53 | 1.76 | nil(6) | 0.46 | 1.07 | tr | 0.02 | 0.07 | tr | 0.01 | 42.22 | 0.44 | 100.02 | 95.25 | 0.65 |
| 23 | Far, up 18 | St Ch | Core, Lone Star Cement quarry, NW 28-11-23E |
47.17 | 2.66 | 5.28 | ND | 1.47 | 1.75 | ND | ND | ND | ND | ND | 41.31 | ND | 99.64 | 84.18 | 8.24 | |
| 1. Abbreviations are Far = Farley, Arg = Argentine, up = upper, and low = lower. 2. Abbreviations are Cp Ch = chip channel and St Ch = strip channel. 3. Where TiO2 is not determined, the value is included with Al2O3. 4. ND = not determined. 5. tr = trace, i.e., presence of less than 0.01 percent. 6. nil indicates presence was not detectable by routine chemical procedures. 7. Sulfide sulfur value is not to be added to obtain numerical total. 8. Where noncarbonate loss is not determined, the total loss on ignition is shown as carbonate. |
||||||||||||||||||||
Table 17—Description and chemical analysis of samples from in and near New Olathe Lake Area (B on Plate 1).
| No. on Pl. 1 |
Member, bed, and feet sampled (1) |
Sample type (2) |
Location | KSGS lab no. |
Chemical constituents | |||||||||||||||
|---|---|---|---|---|---|---|---|---|---|---|---|---|---|---|---|---|---|---|---|---|
| Calcium oxide (CaO) |
Magnesium oxide (MgO) |
Silica(SiO2) | Titania (TiO2)(3) |
Alumina (Al2O3) |
Total iron (Fe2O3) |
Sulfate sulfur (SO4) |
Sulfide sulfur (S)(7) |
Phosphorus pentoxide (P2O5) |
Potassium oxide (K2O) |
Sodium oxide (Na2O) |
Loss on ignition | Total | Calculated CaCO3 |
Calculated MgCO3 |
||||||
| Carbonate | Non-(8) carbonate |
|||||||||||||||||||
| 1. | Far, low, and Arg, up, total of 35 |
Cp Ch | Spillway, New Olathe Lake, NW NE 32-13-23E |
54230 | 52.86 | 1.50 | 133 | ND(4) | 0.40 | 0.64 | nil(6) | ND | 0.03 | ND | ND | 43.09 | ND | 99.85 | 94.27 | 3.14 |
| 2 | Far, up 24 | Cp Ch | Spillway, New Olathe Lake, NW NE 32-13-23E |
54231 | 53.33 | 1.10 | 1.33 | ND | 0.42 | 0.51 | tr(5) | ND | 0.02 | ND | ND | 43.04 | ND | 99.75 | 95.13 | 2.30 |
| 3 | Far, up 6 | Cp Ch | Pipeline trench, N line NE NE NE 32-13-23E |
54232 | 53.80 | 0.57 | 1.30 | ND | 0.42 | 0.57 | nil | ND | 0.04 | ND | ND | 42.80 | ND | 99.51 | 95.93 | 1.19 |
| 4 | Far, next 17 | Cp Ch | Pipeline trench, N line NE NE NE 32-13-23E |
54233 | 54.45 | 0.56 | 1.28 | ND | 0.36 | 0.32 | nil | ND | tr | ND | ND | 43.34 | ND | 100.31 | 97.18 | 1.17 |
| 5 | Far, low, or Arg, up, total of 6 |
Cp Ch | Pipeline trench, N line NE NE NE 32-13-23E |
54234 | 53.79 | 0.58 | 1.46 | ND | 0.15 | 0.34 | nil | ND | 0.04 | ND | ND | 42.81 | ND | 99.14 | 95.86 | 1.21 |
| 17 | Far, low 15 | Cp Ch | Quarry face, SE SW SW 29-13-23E |
5530 | 53.90 | 1.04 | 1.03 | ND | 0.39 | 0.32 | 0.01 | ND | 0.01 | ND | ND | 43.04 | 0.21 | 99.94 | 96.18 | 2.18 |
| 18 | Far, up 12 | Cp Ch | Face, Sunflower Quarry NW 9-13-22E |
51135 | 53.18 | 1.26 | 1.11 | ND | 0.28 | 1.46 | tr | 0.04 | 0.07 | ND | ND | 42.50 | ND | 99.86 | 94.74 | 2.12 |
| 19 | Far, low 10 | Cp Ch | Face, Sunflower Quarry NW 9-13-22E |
51136 | 53.33 | 1.18 | 1.69 | ND | 0.55 | 0.72 | 0.06 | 0.04 | 0.06 | ND | ND | 42.44 | ND | 100.03 | 95.00 | 1.22 |
| 1. Abbreviations are Far = Farley, Arg = Argentine, up = upper, and low = lower. 2. Abbreviations are Cp Ch = chip channel and St Ch = strip channel. 3. Where TiO2 is not determined, the value is included with Al2O3. 4. ND=not determined. 5. tr = trace, i.e., presence of less than 0.01 percent. 6. nil indicates presence was not detectable by routine chemical procedures. 7. Sulfide sulfur value is not to be added to obtain numerical total. 8. Where noncarbonate loss is not determined, the total loss on ignition is shown as carbonate. |
||||||||||||||||||||
Commercial development of the high-purity portion of the Farley (approximately the upper two-thirds) depends upon several factors. Foremost is a great thickness of overburden. As revealed in the cores, the overburden includes surficial silt of variable thickness and bedrock of Pennsylvanian limestone and shale. If open quarrying is contemplated, one must dispose of the Bonner Springs Shale (1 to 2 ft. thick), the Plattsburg Limestone (25 to 30 feet thick), and Vilas Shale (17 to 20 feet thick), probably portions of the Stanton Limestone (thickness extremely variable), and silt (known thickness ranges from 3 to 49 feet). Although the limestone beds in the overburden are not of sufficient purity to make lime, they have potential use (crushed aggregate, agricultural fertilizer, etc.). The shales and limestones could be blended as raw feed for a cement kiln, as is being done by the Lone Star Cement Company east of Bonner Springs.
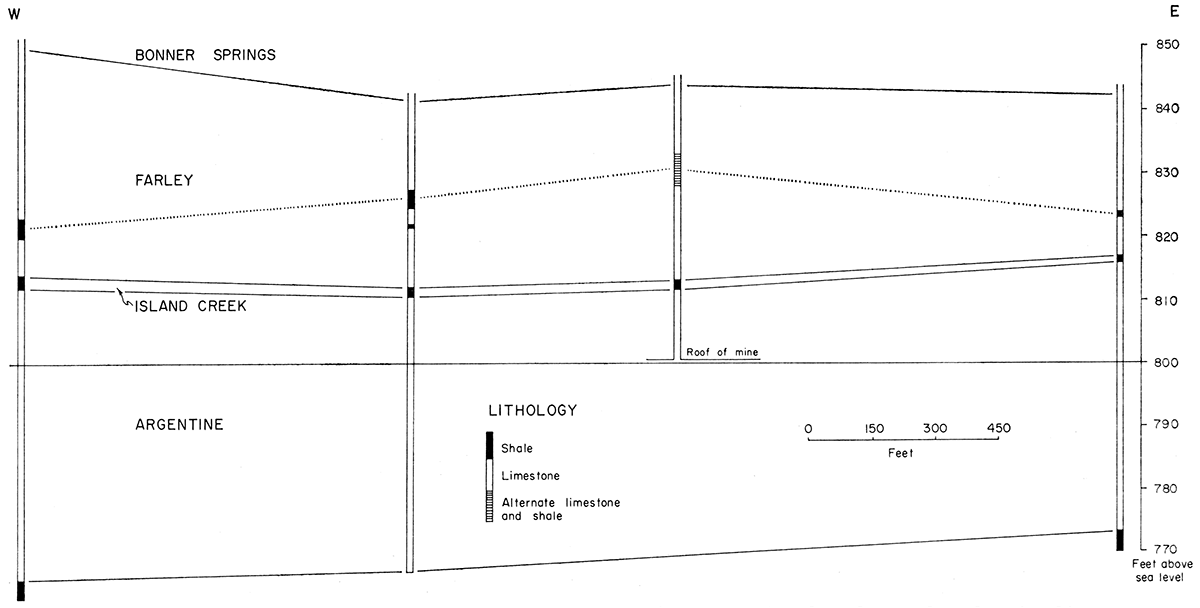
Underground mining of the high-purity limestone is an alternative to open quarrying. The cores from Loring Quarry indicate the presence of shale (units 0.5 foot to 3 feet thick) either as a continuous layer showing considerable change in elevation from test hole to test hole or as several lenticular bodies within the limestone. It seems inevitable that at some time during mining (it is presumed that the room-and-pillar method would be used), one will encounter shale. Among the possible problems caused by encountering shale are: introduction of excess noncarbonate material in the kiln feed, influx of water into the mine, roof spalling, dust, and floor buckling. Figure 2 shows the Wyandotte Limestone section in four of the Loring cores related by true elevation. The dotted line emphasizes the abrupt change in elevation of the shale within the Farley. Shale can be removed from the limestone by common methods (washing, screening, etc.). The possibility of shale contamination should definitely be considered in calculating plant and preparation costs.
Figure 2—Change in elevation of shale (s) in Farley member as seen in selected cores from location 24.
In the well shown in area A (Plate 1), the 63 feet of Wyandotte penetrated was logged by the driller as 5 feet of limestone, 3 feet of shale, and 55 feet of limestone. Probably the 55-foot limestone represents both lower Farley and Argentine Limestones and an Island Creek member too thin to be detected during drilling. Nevertheless, the shale reported is higher within the Farley here than in any of the cores, further illustrating the "flexibility of stratigraphic position" of the shale.
Comparison of analyses of the face samples and core sample reveals a tendency for increase in magnesium content to the northwest. Prior to development, the degree of persistence of this tendency outside the area of probable reserves should be determined. Should the increase in magnesium be persistent, the MgO content of any lime produced could become too great for some uses (see tables 5, 10, 11, 13, and 14).
The Loring area is accessible by paved road from Bonner Springs and is crossed by several all-weather gravel roads. The main line of the Union Pacific Railroad passes along the southeast edge. By rail, it is approximately 20 miles to the Central Industrial District, 24 miles to the Fairfax Industrial District, 25 miles to the Northeast Industrial District, 27 miles to the Blue Valley Industrial District, and 30 miles to the Leeds Industrial District, all in the Kansas City Metropolitan Area. Mileage to the various industrial districts is similar for truck transportation.
Control for the New Olathe Lake area (B on Plate 1) is afforded by samples from a quarry in the SE SW SW sec. 29 and from the spillway of New Olathe Lake in the center N2 N2 and from a pipeline trench in the center of N line of NE NE NE sec. 32, T. 13 S., R. 23 E. Analyses of these samples are given in Table 17. Table 17 also gives analyses of samples taken from the Sunflower Ordnance Works quarry for comparison. No cores of the Wyandotte were available for area B. Because essentially only two locations were sampled, there is no basis for defining an area of probable reserves. Thus, area B is one of potential reserves for lime manufacture.
The quarry in sec. 29 exposes the following lithologic sequence.
| Thickness, feet |
|||
|---|---|---|---|
| Bonner Springs Shale (part) | |||
| 1. Sandstone | 11.0 | ||
| Wyandotte Limestone | |||
| Farley member | |||
| 2. Limestone | 5.8 | ||
| 3. Shale | 0.5 | ||
| 4. Limestone | 20.5 | ||
| Island Creek member | |||
| 5. Shale | 1.5 | ||
| Argentine member | |||
| 6. Limestone | to floor 15.0 | ||
Lithologies exposed in the New Olathe Lake spillway are as follows.
| Thickness, feet |
|||
|---|---|---|---|
| Wyandotte Limestone | |||
| Farley member | |||
| 1. Limestone | 23.0 | ||
| Island Creek member | |||
| 2. Shale | 0.9 | ||
| Argentine member | |||
| 3. Limestone | 31.1 | ||
| Quindaro member | |||
| 4. Shale | 0.3 | ||
| Frisbie member | |||
| 5. Limestone | 1.9 | ||
Sample 17 (Table 17) represents the lower 15 feet of unit 4 of the quarry section. Sample 1 represents all of unit 1 and approximately the upper half of unit 3 of the spillway section, whereas sample 2 represents only unit 1.
The probability of a large quantity of limestone in area B is indicated by logs of three wells south of the sample sites. These wells (Plate 1) logged 70, 70, and 73 feet respectively of limestone without shale breaks. Although thin shales could be missed during drilling, it is reasonable to expect that they are comparable in thickness to the shales exposed in the quarry and spillway. A shale in the Wyandotte is noted in eight other well logs in area B, but the maximum thickness reported is 4 feet.
The potential for high-purity limestone in area B is based on the assumption that chemical composition of the thick Wyandotte limestones penetrated in wells is similar to that at the two exposures sampled. Prior to any development, additional samples must be obtained, preferably by coring, to determine whether purity is consistent throughout the limestone. The Wyandotte Limestone is poorly exposed in the valley sides along the principal streams of area B and much of the boundary of area B coincides approximately with the basal contact. The extensive outcrop along the valleys favors open quarrying. A blacktop road connects area B with Olathe, 3 miles east, where railroad facilities are available. From Olathe, distances to Kansas City industrial districts are similar to those for area A.
The Stilwell area is designated C on Plate 1. The first indication of high-purity limestone here came from chemical analysis of samples taken in 1952 from the quarry of the Reno Construction Company located in the SW SE sec. 31, T. 14 S., R. 25 E. As quarrying continued, additional samples were taken from time to time and analyzed to test the continuity of the high-purity portion. Upon establishing the fact that the high-purity limestone was consistent in the quarry face, a determination of its lateral extent was needed. In early 1959, Reno Construction Company drilled 15 core holes in areas adjacent to the quarry and gave samples from the cores to the Survey. Table 18 summarizes the chemical analyses of quarry face samples, core samples, and samples taken from other nearby localities for comparison. The control afforded by the cores indicates that the quarry premises (25 on Plate 1) is an area of probable reserves of high-purity limestone.
Area C is the largest, by far, of the three under discussion. Logs of wells within the area reveal an extraordinary thickness for the Wyandotte. The Farley is assumed to retain the same thickness throughout area C as seen in the cores. The thickness of the "lower" Farley in the cores deviated very little from the average of 23 feet. Factors influencing placement of the boundary of area C are (1) location and representative thickness of samples, (2) thicknesses of Wyandotte shown in well logs, and (3) topography of the area (from Stilwell and Bucyrus quadrangles). Probably other deposits of similar high-quality limestone exist outside of the area of probable reserves. Extensive exploration and sampling, preferably by core drill, in area C is necessary before the presence of other thick deposits of high-calcium limestone can be verified.
Table 18—Description and chemical analysis of samples from in and near Stilwell Area (C on Plate 1).
| No. on Pl. 1 |
Member, bed, and feet sampled (1) |
Sample type (2) |
Location | KSGS lab no. |
Chemical constituents | |||||||||||||||
|---|---|---|---|---|---|---|---|---|---|---|---|---|---|---|---|---|---|---|---|---|
| Calcium oxide (CaO) |
Magnesium oxide (MgO) |
Silica(SiO2) | Titania (TiO2)(3) |
Alumina (Al2O3) |
Total iron (Fe2O3) |
Sulfate sulfur (SO4) |
Sulfide sulfur (S)(7) |
Phosphorus pentoxide (P2O5) |
Potassium oxide (K2O) |
Sodium oxide (Na2O) |
Loss on ignition | Total | Calculated CaCO3 |
Calculated MgCO3 |
||||||
| Carbonate | Non-(8) carbonate |
|||||||||||||||||||
| 25 | Far, low 20 | Cp Ch | Face, Reno Quarry, SE 31-14-25E |
(9) | 54.94 | 0.37 | 0.62 | ND(4) | 0.20 | 0.36 | nil(4) | tr(5) | 0.01 | ND | ND | 43.39 | ND | 99.89 | 98.04 | 0.54 |
| 25 | Far, low 20 | (10) | Face, Reno Quarry, SE 31-14-25E |
55175 | 54.92 | 0.20 | 0.68 | ND | 0.17 | 0.31 | nil | ND | 0.05 | 0.06 | 0.02 | 43.11 | ND | 99.55 | 97.89 | 0.42 |
| 25 | Far, low 20 | (11) | Face, Reno Quarry, SE 31-14-25E |
55176 | 55.17 | 0.19 | 0.52 | ND | 0.12 | 0.20 | nil | ND | 0.02 | 0.06 | 0.02 | 43.25 | ND | 99.55 | 98.41 | 0.39 |
| 25 | Arg, low 18 | Cp Ch | Face, Reno Quarry, SE 31-14-25E |
52309 | 51.56 | 2.83 | 1.10 | ND | 0.46 | 0.95 | 0.30 | nil | 0.02 | 0.06 | 0.06 | 43.38 | ND | 100.72 | 91.59 | 5.72 |
| 25 | Arg, up 22 | Cp Ch | Face, Reno Quarry, SE 31-14-25E |
52324 | 52.49 | 0.92 | 3.37 | ND | 0.92 | 0.46 | 0.10 | nil | 0.05 | 0.08 | 0.06 | 41.90 | ND | 100.35 | 93.43 | 1.92 |
| 25 | Far, low, up 20 | Cp Ch | Core 6, Reno Quarry | 59119 | 54.57 | 0.67 | 0.64 | 0.05 | 0.14 | 0.42 | tr | nil | tr | tr | tr | 43.23 | 0.22 | 99.94 | 97.39 | 0.79 |
| 25 | Far, low, low 5 | Cp Ch | Core 6, Reno Quarry | 59120 | 51.53 | 0.52 | 5.21 | 0.01 | 0.59 | 0.33 | tr | 0.01 | tr | tr | tr | 40.93 | 0.31 | 99.44 | 91.97 | 0.94 |
| 25 | Far, low, up 20 | Cp Ch | Core 7, Reno Quarry | 59121 | 55.12 | 0.30 | 0.48 | 0.01 | 0.18 | 0.30 | tr | tr | tr | nil | tr | 43.07 | 0.15 | 99.61 | 98.38 | 0.00 |
| 25 | Far, low, up 20 | Cp Ch | Core 9, Reno Quarry | 59123 | 54.78 | 0.54 | 0.69 | ND | 0.20 | 0.26 | tr | tr | tr | nil | tr | 43.04 | 0.18 | 99.73 | 97.77 | 0.44 |
| 25 | Far, low, up 20 | Cp Ch | Core 1E, Reno Quarry | 59126 | 53.99 | 1.22 | 0.73 | nil | 0.15 | 0.49 | nil | tr | 0.02 | 0.01 | 0.02 | 43.15 | 0.24 | 100.02 | 96.31 | 1.53 |
| 25 | Far, low, up 20 | Cp Ch | Core 2E, Reno Quarry | 59127 | 54.28 | 0.86 | 0.61 | nil | 0.14 | 0.45 | nil | tr | 0.02 | tr | tr | 43.27 | 0.20 | 99.83 | 96.82 | 1.34 |
| 6 | Far, low, up 20 | Cp Ch | Outcrop, cen W line SW 4-14-25E |
54235 | 53.01 | 1.30 | 1.94 | ND | 0.70 | 0.52 | nil | ND | 0.05 | ND | ND | 42.97 | ND | 100.49 | 94.50 | 2.72 |
| 7 | Far, up 15 | Cp Ch | Outcrop, cen W line SW 4-14-25E |
54236 | 49.84 | 1.51 | 4.83 | ND | 1.49 | 0.89 | nil | ND | 0.03 | ND | ND | 40.73 | ND | 99.32 | 88.58 | 3.16 |
| 8 | Far, low, up 20 | Cp Ch | Outcrop, cen N line 16-14-25E |
54237 | 54.18 | 0.61 | 1.15 | ND | 0.32 | 0.43 | nil | ND | 0.03 | ND | ND | 43.16 | ND | 99.88 | 96.63 | 1.28 |
| 9 | Arg, up 20 | Cp Ch | Outcrop, cen E line SE NE 17-14-25E | 54238 | 53.59 | 0.97 | 1.51 | ND | 0.49 | 0.40 | nil | ND | 0.07 | ND | ND | 43.04 | ND | 100.07 | 95.48 | 2.03 |
| 10 | Far, low, low 15 | Cp Ch | Outcrop, cen S line 16-15-25E |
54239 | 52.21 | 0.85 | 3.49 | ND | 0.77 | 0.59 | nil | ND | 0.07 | ND | ND | 41.83 | ND | 99.81 | 93.02 | 1.78 |
| 11 | Far, low, up 10 | Cp Ch | Outcrop, cen S line 16-15-25E |
54240 | 54.77 | 0.30 | 0.85 | ND | 0.24 | 0.32 | nil | ND | 0.01 | ND | ND | 43.35 | ND | 99.83 | 97.75 | 0.63 |
| 12 | Far, up 10 | Cp Ch | Outcrop, cen S line 16-15-25E |
54241 | 54.74 | 0.20 | 0.91 | ND | 0.24 | 0.67 | nil | ND | 0.01 | ND | ND | 43.17 | ND | 99.93 | 96.89 | 0.42 |
| 13 | Far, low, up 15 | Cp Ch | Outcrop, SE cor 32-15-25E |
54242 | 53.89 | 0.74 | 1.28 | ND | 0.33 | 0.48 | nil | nil | 0.02 | ND | ND | 43.09 | ND | 99.66 | 94.72 | 1.55 |
| 14 | Far, low, low 15 | Cp Ch | Outcrop, SE cor 32-15-25E |
54243 | 55.06 | 0.20 | 0.64 | ND | 0.10 | 0.34 | nil | nil | 0.01 | ND | ND | 43.43 | ND | 99.77 | 97.72 | 0.42 |
| 15 | Far, low, up 18 | Cp Ch | Outcrop, cen E line 29-14-25E |
54244 | 54.85 | 0.16 | 1.09 | ND | 0.38 | 0.37 | nil | nil | 0.02 | ND | ND | 43.19 | ND | 99.96 | 97.14 | 0.33 |
| 16 | Arg,31 | Cp Ch | Face, Flynn Quarry, SE NE NE 34-14-24E |
54245 | 52.61 | 1.23 | 1.69 | ND | 0.47 | 0.98 | 0.09 | 0.10 | 0.01 | ND | ND | 42.62 | ND | 99.61 | 92.88 | 2.57 |
| 1. Abbreviations are Far = Farley, Arg = Argentine, up = upper, and low = lower. 2. Abbreviations are Cp Ch = chip channel and St Ch = Strip channel. 3. Where TiO2 is not determined, the value is included with Al2O3. 4. ND = not determined. 5. tr = trace, i.e., presence of less than 0.01 percent. 6. nil indicates presence was not detectable by routine chemical procedures. 7. Sulfide sulfur value is not to be added to obtain numerical total. 8. Where non-carbonate loss is not determined, the total loss on ignition is shown as carbonate. 9. Values represent average of analyses of five samples (KSGS nos. 52235, 53168, 54200, 54201, and 5531). 10. This is a compound sample taken from 1500 pounds of rock as blasted down. 11. This is a compound sample taken from same 1500 pounds of rock after fine crushing and washing. |
||||||||||||||||||||
Area C is cut by many valleys that provide advantageous sites for open quarrying. Because the Farley directly underlies the soil in much of the area, overburden thickness should be minor, but it is likely that "mud seams" will be encountered during quarrying. These "mud seams", as seen in the Farley in the Reno quarry, are vertical seams of red-brown earthy clay, which commonly contains soft limonitic masses. The "seams" are attributed to enlargement of joints by ground water and subsequent filling by the earthy clay. The "mud seams" can be expected to be numerous where the Farley is at or near the surface. If the earthy clay is quarried and processed with the crushed stone, a marked increase in iron and alumina content is noted upon analysis. Washing the admixed earthy clay from the crushed stone is necessary to insure the best quality raw feed for lime kilns.
The Missouri Pacific Railroad and U. S. Highway 69 cross area C. The area is also served by a network of good gravel roads. By rail, the distance is approximately 23 miles to the Leeds Industrial District, 26 miles to the Blue Valley Industrial District, 27 miles to the Northeast Industrial District, 32 miles to the Central Industrial District, and 35 miles to the Fairfax Industrial District. The distances by highway to the various industrial districts are comparable.
Geochemical studies begun in 1946 and still continuing prove the occurrence of many limestones of high purity. The Wyandotte Limestone seemed most worthy of additional study because its area of outcrop was adjacent to Kansas City industrial districts. Samples of unweathered limestone were obtained from members of the Wyandotte Limestone at several locations and were analyzed for calcium oxide, magnesium oxide, silica, titania, alumina, total iron, sulfate sulfur, sulfide sulfur, phosphorus pentoxide, alkalies, and loss on ignition.
Of the five members of the Wyandotte Limestone, only two limestone members are thick enough to be potential sources of raw material for lime manufacture. The Argentine Limestone is the middle limestone and is most persistent in thickness and lithology in the region studied. It averages between 20 and 30 feet thick but ranges from 15 to 55 feet in the area. The Farley Limestone member contrasts with the Argentine in being extremely variable in thickness and lithologic composition. Although in most places it consists of limestone and intervening shale beds, the Farley at some localities is predominantly limestone of high purity containing little or no shale.
Outcrops, cores, and logs of wells were examined. As potential sources of lime, portions of the outcrop area were eliminated for any of the following reasons: (1) the limestone is less than 12 feet thick, (2) the amount of interbedded shale is excessive, (3) the overburden is judged to be too thick to remove economically, (4) percentage of noncarbonate constituents is excessive, and (5) the area is too densely populated. Three areas remained in which geologic, economic, and chemical conditions rendered the limestone suitable for lime manufacture. The suitable limestone in each area is in the Farley member, but low-quality lime can be manufactured from the Argentine in places.
One area having potential for lime manufacture is near the town of Bonner Springs. Samples from the quarry face at Loring Quarries, Inc., and from a core near the quarry show that the upper two-thirds of the Farley Limestone consistently contains the highest carbonate content. Factors affecting production here are (1) a considerable thickness of overburden composed of silt and Pennsylvanian shales and limestones, (2) extreme variation in position of occurrence of thin shale (s) within the Farley, and (3) an increase in magnesium content to the northwest within the high-carbonate portion of the Farley. Construction of a lime plant at Loring was announced in January 1960.
A second potential area is located approximately 3 miles west of Olathe. Two fresh exposures and logs of three nearby wells showed about 70 feet of limestone without shale breaks. If the purity shown by the tested samples is consistent laterally, the area is potentially productive and especially suited to quarrying.
The third and largest area lies chiefly to the west of Stilwell. Samples from a quarry face, outcrops, and cores show that the "lower" Farley limestone in the Reno quarry, averaging approximately 23 feet thick, has a carbonate content of about 98 percent. Analysis of other samples on the margin of the potential reserve area suggests that this high carbonate content is persistent. Detailed exploration is necessary to "prove up" the area. Open pit quarrying would probably be the most economical form of development, but "mud seams" might contaminate the rock, necessitating washing prior to calcining.
American Society for Testing Materials (1958) Lime: Book of ASTM standards, v. 4 (Cement, concrete, mortars, road materials, waterproofing, soils), p. 203-210, 217-228.
Jewett, J. M., (1959) Graphic column and classification of rocks in Kansas: Kansas Geol. Survey Chart.
Jewett, J. M., and Newell, N. D. (1935) The geology of Wyandotte County, Kansas: Kansas Geol. Survey, Bull. 21, pt. 2, p. 151-205. [available online]
Newell, N. D. (1935) The geology of Johnson and Miami Counties, Kansas: Kansas Geol. Survey, Bull. 21, pt. 1, p. 1-150. [available online]
Patterson, C. M., and Foley, J. M. (1958) Lime: Minerals Yearbook 1957, v.l, Metals and minerals, U. S. Bureau of Mines, p. 743-763.
Runnels, R. T. (1951) Some high-calcium limestones in Kansas: Kansas Geol. Survey, Bull. 90, pt. 5, p. 77-104. [available online]
Runnels, R. T., and Dubins, I. M. (1949) Chemical and petrographic studies of the . Fort Hays Chalk in Kansas: Kansas Geol. Survey, Bull. 82, pt. 1, p. 1-36. [available online]
Runnels, R. T., and Schleicher, J. A. (1956) Chemical composition of eastern Kansas limestones: Kansas Geol. Survey, Bull. 119, pt. 3, p. 81-103. [available online]
Kansas Geological Survey
Placed on web Dec. 18, 2018; originally published Sept. 1, 1960.
Comments to webadmin@kgs.ku.edu
The URL for this page is http://www.kgs.ku.edu/Publications/Bulletins/142_3/index.html