| Original published in W.W. Hambleton, ed., 1959, Symposium on Geophysics in Kansas: Kansas Geological Survey, Bulletin 137, pp. 209-218 | ||
1Kansas Board of Health and 2Kansas State Geological Survey
The complete article is available as an Acrobat PDF file.
Electrical resistivity equipment was field tested to determine its feasibility as a reliable and rapid means of tracing subsurface brine concentrations in connection with pollution abatement studies of the Oil Field Section, Division of Sanitation, Kansas State Board of Health. A successful study was completed northeast of Chase in Rice County. A study at Iuka, in Pratt County was not successful because pipe lines, casing, and other unknown materials acted as shunts or otherwise disturbed the current pattern and caused anomalies that were not separable from anomalies due to brine concentrations. Resistivity surveys have been unusually reliable in determining the configuration of brine concentrations where control data are available to correct interpretations for extraneous anomalies. Absence of control data is the primary reason for the erroneous interpretation at Iuka.
During the summer of 1953 the Oil Field Section of the Division of Sanitation, Kansas State Board of Health, field tested electrical resistivity equipment to determine whether this type of equipment would provide a reliable, reasonably rapid method for tracing the movement of saline water in the subsurface. Investigations were made northeast of Chase in Rice County and near Iuka in Pratt County. These places are identified as the Cramm area and the Iuka area respectively in subsequent discussion.
The instrument is based on the Gish-Rooney circuit (Gish and Rooney, 1925) and operates on commutated direct current supplied from an external battery source. The Wenner (1916) electrode configuration, consisting of four equally spaced electrodes in a straight line, was used.
Computations are based on Ohm's law, R = V/I (where R = resistance, V = voltage, and I = current). A known current is applied to the outer electrodes and the voltage is measured across the inner electrodes. Assuming spherical distribution of potential about the inner electrodes in the Wenner configuration, a derivation of Ohm's law, p = 27π V/I, can be used to compute apparent resistivity (where p = resistivity in ohm-feet, a = the distance between electrodes in feet, V = voltage in volts, and I = current in amperes).
The effective depth of measurement, in many places, is approximately equal to the electrode spacing. Because the effective depth of measurement is governed by the resistivities of the materials through which the current passes, the effective penetration will change with change in material. In each locality, a "penetration factor" should be applied to the data for purposes of evaluation. Ordinary moist soil containing moderate amounts of clay or silt has a comparatively low resistance. In contrast sand, gravel, dry loose soil, and solid rock have relatively high resistivity values. Water-saturated sand and gravel ordinarily have lower resistivity values than sand and gravel that are nonsaturated or contain relatively large amounts of clay and silt. Also, the resistivity is a function of the dissolved mineral content of the contained fluid. Unconsolidated deposits usually are a heterogeneous mixture of materials ranging from clay particle to gravel size. Materials of nearly the same size and composition may occur as lenses in unconsolidated deposits, and each lens may have a different resistivity. It is necessary, therefore, to have control points in each area in order to establish a depth-of-penetration/electrode-spacing ratio or "penetration factor" before data can be evaluated.
Two types of traverses are made in resistivity investigations. The depth traverse is used to determine the depth to a resistivity interface and employs an electrode spacing that is increased by increments. The results of a depth traverse are shown in Figure 2. The constant depth or lateral traverse is used to locate places of lateral change in resistivity at some predetermined depth and employs a constant electrode spacing; the entire electrode configuration is moved along the line of traverse by increments. The results of a constant depth traverse are shown in Figure 4.
The Cramm area is located in the SE sec. 15, T. 19 S., R. 9 W., Rice County (Fig. 1). The area is bordered on the west by Cow Creek Valley. Quaternary alluvium was deposited in the valley. Rocks of the Dakota Group form the east wall of the valley, rising sharply from the valley floor, and are exposed for a distance of about 600 feet to the east. At this point, the surface of the Dakota dips eastward under Pleistocene eolian and terrace deposits. The Pleistocene deposits probably are no more than 30 feet thick.
Figure 1--Map of Cramm area showing fresh water well (A), contaminated water wells (B, C), brine pond (D), abandoned oil well (E), brine front (X-X'), Dakota group (Kd), Quaternary Pleistocene deposits (Qp), Quaternary alluvium (Qal), sec. 15, T. 19 S., R. 9 W., Rice County.
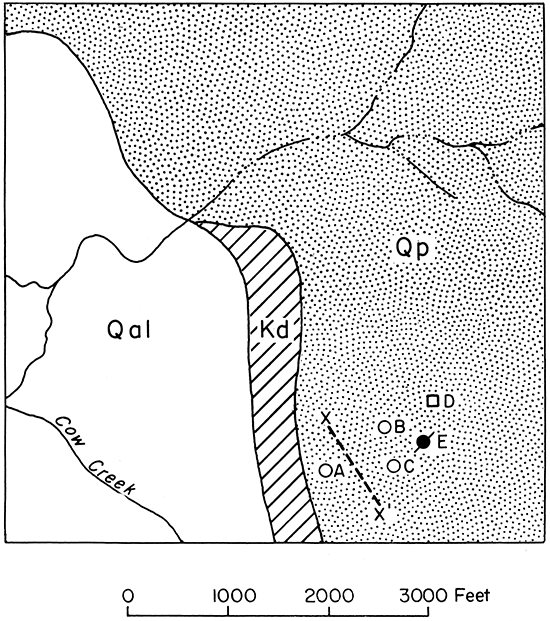
The Dakota probably is the principal aquifer in the area, although some water may be derived from Pleistocene deposits. Both Dakota and Pleistocene rocks are fine grained and have comparatively low permeabilities, hence movement of water though the deposits is slow. Water moves through the aquifer from northeast to southwest.
Within the area (Fig. 1) are three water wells, an abandoned pond for disposal of oil field brine, and an abandoned oil well. The pond (D) was constructed in the SW cor. NE SE sec. 15, T. 19 S., R. 9 W., about one-quarter mile east of the east edge of the outcrop of the Dakota Group. An uncontaminated water well (A) is located about 1,200 feet southwest of the brine pond and about 200 feet east of the outcrop of the Dakota. Two water wells (B and C) contaminated by sodium chloride are located midway between the uncontaminated water well and the brine pond. The depth of each well (A, B, and C) is 60 feet. The unplugged abandoned oil well (E) is east of the contaminated water wells and south of the brine pond. The purpose of the investigation was to determine the source of chloride contamination and establish location of the brine front.
Before the resistivity survey was begun, a set of water samples was taken from each of the three water wells after minimum pumpage, and a second set of samples was taken after the wells had been pumped for 1 1/2 hours. The samples were titrated for chloride content. The titration results are shown with depth to water for each well in Table 1. The chloride concentration shows contamination of wells Band C; well A seemingly was not affected by chloride intrusion.
Table 1--Depth to water and chloride content of water samples from wells in Cramm area. Chloride content is expressed in parts per million.
| Well | Chloride content | Depth to water, feet |
|
|---|---|---|---|
| after minimum pumpage |
after pumping 1 1/2 hours |
||
| A | 110 | 114 | 15.00 |
| B | 3,900 | 8,920 | 14.95 |
| C | 290 | 6,490 | 14.94 |
The probable sources of contamination included a brine pond (D, Fig. 1), which had been abandoned and backfilled approximately three years before chloride intrusion was detected in wells B or C, and an abandoned oil well (E, Fig. 1), which was open except for a surface cap. Because the fluid level in the abandoned well was more than 500 feet below ground level, it was eliminated as a source of contamination. The low permeability of the aquifer probably accounts for the delay in the appearance of contamination in wells Band C.
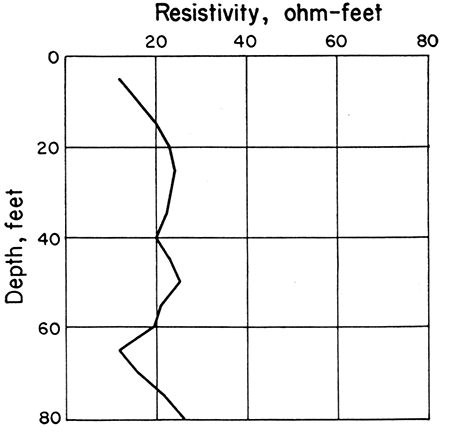
Depth traverses were run near the unpolluted water well (A) and over the abandoned pond site (D). The resulting depth-resistivity curves are shown in Figures 2 and 3 respectively. The water table was picked at depth of 17.5 feet (Fig. 2), whereas the measured depth was 15 feet. The curve shown in Figure 3 is devoid of detail, owing to the blanketing effect of the high-conductivity chloride (salt) concentration at the abandoned pond site.
Figure 2--Depth-resistivity curve, near unpolluted water well, SE sec. 15, T. 19 S., R. 9 W., Rice County.
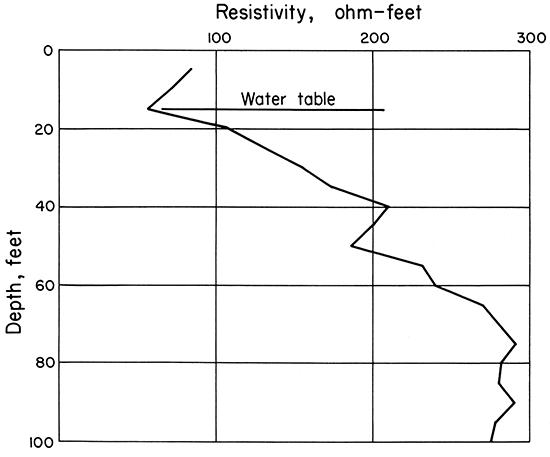
Figure 3--Depth-resistivity curve, near abandoned surface brine pond, SE sec. 15, T. 19 S., R. 9 W., Rice County.
A constant depth traverse, electrode spacing 65 feet, was run on a southwest-northeast traverse line parallel to the direction of ground-water movement, to determine .whether brine had moved from the former pond site and to determine the location of the brine front if movement had occurred. The traverse began with the lead current electrode located near the Dakota contact and ended 325 feet northeast of the pond site. Figure 4 shows the resistivity curve resulting from this traverse.
Figure 4--Constant depth traverse, showing location of brine front from curve inflection, normal to line X-X', Figure 1.
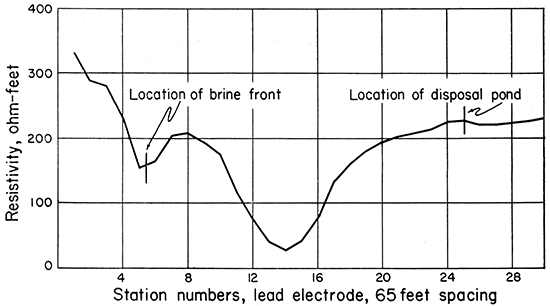
According to Jakosky (1950), as an electrode configuration approaches a zone of high conductivity, apparent resistivity is diminished with respect to the value expected in the absence of the conductor. As the lead potential electrode approaches the zone of high conductivity, the potential drop between the lead current electrode and the lead potential electrode is abnormally small because of the short-circuiting effect of the conductor. The potential between the potential electrodes is large, however, and the apparent resistivity has a greater value than would be true in the absence of the conductor. As both potential electrodes are placed within the area of high conductivity the potential difference measured across the conductor is small and the apparent resistivity is a minimum. A similar pattern of apparent resistivity values is obtained when the configuration moves out of the high conductivity area. Thus, the area of high conductivity can be located from the inflection points of the curve relative to the position of the lead electrode.
From the curve analysis, the position of the brine front was located approximately along the line X-X' (Fig. 1) between polluted and unpolluted wells. Seemingly the former pond site was the source area from which the chlorides moved as the salt was leached by groundwater.
The Iuka area study included parts of sec. 33, 34, and 35, T. 26 S., R. 13 W., and parts of sec. 3, 4, and 5, T. 27 S., R. 13 W., in Pratt County (Fig. 5). The study was made because several water wells in and near the town of Iuka were reported to have been polluted by brine intrusion; this condition was verified by chloride titration of water samples from the wells. The field party directed its studies toward establishment of a brine front or delineation of brine-contaminated areas.
Figure 5--Map showing Iuka area, brine ponds (solid dots), uncontaminated water well (A), contaminated water well (B), location of constant depth traverses (dashed lines), and direction of water movement, Pratt County.
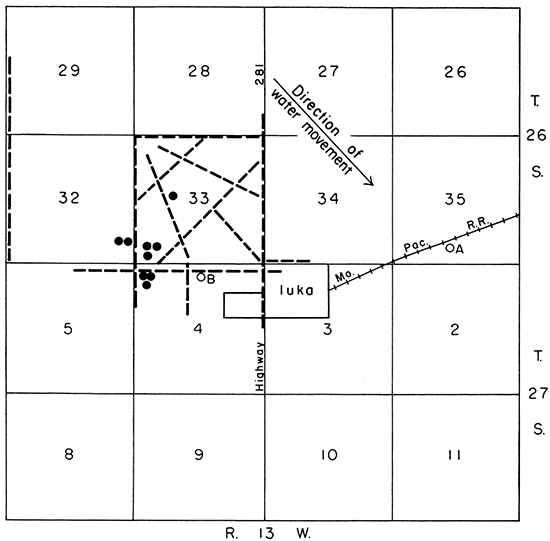
In this area Pleistocene silt, sand, and gravel more than 200 feet thick overlie rocks of Permian age. The upper part of the Pleistocene section is composed of silt-size particles or fine sand locally and represents deposits of late Pleistocene age. Coarse materials below the surface materials probably are early Pleistocene deposits of Nebraskan and Kansas age. The early Pleistocene deposits are very permeable, and wells that have large yields can be developed in them. In other areas in Pratt County the water in Nebraskan deposits contains excessive chlorides, probably derived from underlying Permian rocks. This high-chloride water is confined in Nebraskan deposits by a thick silt of Aftonian age. Kansan deposits generally are not high in chloride salts unless the confining silts are removed. Geologic conditions in the Iuka area are similar and it is probable that high-chloride water occurs in the lower part of the Pleistocene in this area. The water wells in the Iuka area do not penetrate Nebraskan deposits and are not affected by high-chloride water contained in these deposits. Water moves from northwest to southeast in this area.
Brine-disposal ponds have been used in the past in the Iuka area. These ponds are shown in Figure 5 as solid dots. The brine ponds are constructed in the fine-grained upper Pleistocene deposits and although seepage is somewhat retarded, salt water almost certainly enters the groundwater body through these ponds.
Depth traverses were made at a brine-polluted water well near the center of the north line of sec. 4, T. 27 S., R. 13 W., and near an unpolluted water well in the S2 sec. 35, T. 26 S., R. 13 W. (open circles, Fig. 5). The resulting curves are shown in Figures 6 and 7 respectively. The curve in Figure 6 lacks overall detail and the resistivity, beginning at 70 feet, decreases with depth until Nebraskan deposits are reached. The curve characteristics are attributed to the effects of chloride concentration in the well. The location of the depth traverse shown in Figure 6 is in line with the movement of water from disposal ponds. The contaminated well is about 2,700 feet east of the nearest pond and about 3,000 feet southeast of the nearest pond in the direction of movement of water, indicating that the ponds are probable sources of contamination. Figure 7 shows a typically normal curve from the unpolluted well; inflection points are sharp, and resistivity increases with depth until Nebraskan deposits are reached. The well is at least 2 miles from the nearest disposal pond and does not lie in the path of polluted water moving from the ponds.
Figure 6--Depth-resistivity curve, contaminated water well (B, Fig. 5), N2 sec. 4, T. 27 S., R. 13 W., Pratt County.
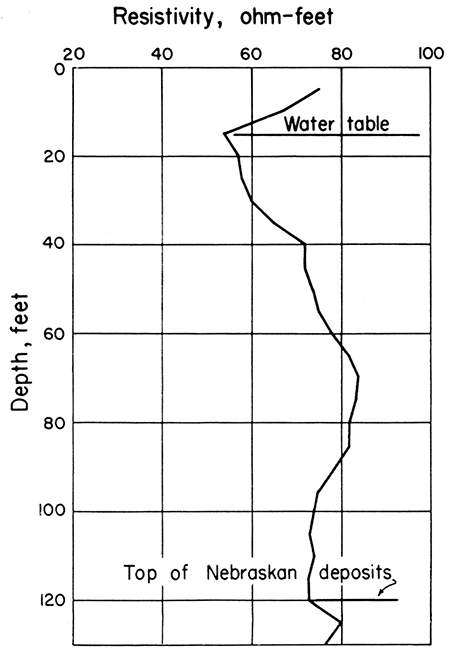
Figure 7--Depth-resistivity curve, uncontaminated water well (A, Fig. 5), S2 sec. 35, T. 26 S., R. 13 W., Pratt County.
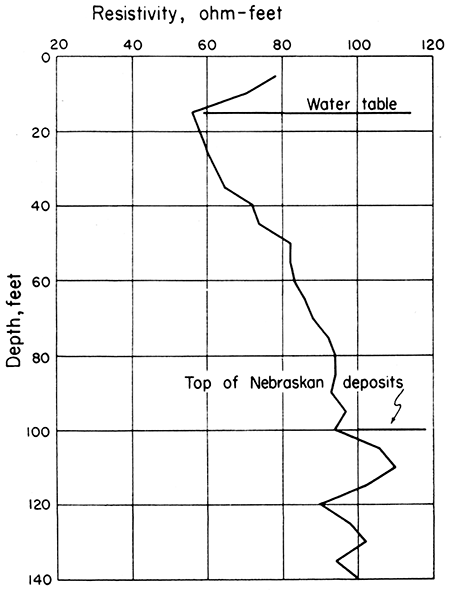
Figure 8--Constant depth traverse, line starting NW cor. sec. 33, T. 26 S., R. 3 W., and ending along east line NE sec. 5, T. 27 S., R. 13 W., Pratt County.
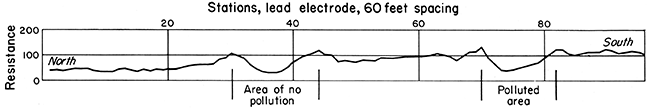
Constant depth traverses were run on 12 lines (Fig. 5) but results were unreliable because current losses through pipe lines, casing, and unknown materials caused anomalies that were indistinguishable from anomalies caused by concentrations of brine. Figure 8 is included to show an example of one of the constant depth traverses. The traverse was approximately 1 1/2 miles long, starting at the northwest corner of sec. 33 and ending along the east line of the NE of sec. 5 (Fig. 5). It was run on a 60-foot electrode spacing. The first significant break in the curve, between stations 30 and 44, is not evidence of brine contamination inasmuch as water samples from the area were fresh. The breaks between stations 72 and 82 are indicative of pollution as shown by water samples. The resistivity survey was unsuccessful in establishing a brine front or in predicting the configuration of local brine concentrations.
Gish, O. E., and Rooney, W. J. (1925) Measurement of Resistivity of Large Masses of Undisturbed Earth: Terrestrial Magnetism, v. 30, p. 161-188.
Jakosky, J. J. (1950) Exploration Geophysics, 2d ed., Trija Publishing Company, Los Angeles, p. 498-499.
Wenner, F. C. (1916) A Method of Measuring Resistivity in the Earth: U. S. Bur. Standards Bull. 12, p. 469-478.
Kansas Geological Survey
Comments to webadmin@kgs.ku.edu
Web version Dec. 3, 2013. Original publication date 1959.
URL=http://www.kgs.ku.edu/Publications/Bulletins/137/OConnor/index.html