| Original published in W.W. Hambleton, ed., 1959, Symposium on Geophysics in Kansas: Kansas Geological Survey, Bulletin 137, pp. 135-141 | ||
U.S. Geological Survey
The complete article is available as an Acrobat PDF file.
Two aeromagnetic profiles were flown, one westward from Salina and one across the southwest corner of Kansas, by the U.S: Geological Survey in 1950-1951. The magnetic pattern consists of a series of large anomalies modified by several minor features, superposed on a slight positive regional gradient to the east. Depth analyses of several broad anomalies indicate that they originate deep within the Precambrian complex, and several of the smaller features may be caused by variations in magnetic susceptibility extending downward from the top of the Precambrian rocks.
The two aeromagnetic profiles presented in this paper were made as part of a comprehensive program of cross-country aeromagnetic surveying by aircraft of the U.S. Geological Survey on flights between project areas. From such profiles it has been possible to study the magnetic pattern characteristic of the areas traversed and to make certain inferences concerning the regional geology as it is related to this pattern.
The primary purpose of this report is to present heretofore unpublished data on the variation in total intensity of the earth's magnetic field in Kansas. The accompanying interpretations are necessarily limited in scope because they are based on the analysis of individual unrelated profiles.
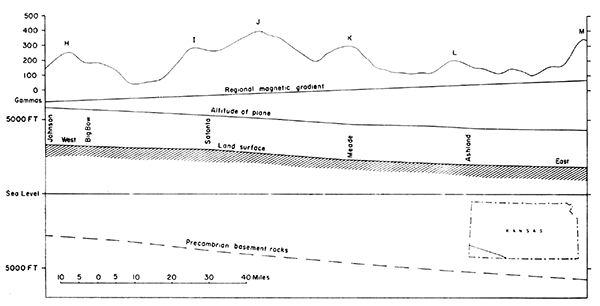
Both profiles were flown from east to west at approximately uniform height above ground. The northern profile (Fig. 1), which was flown on May 13, 1951, extends from just west of Salina, Kansas, to the border of Colorado, a distance of about 350 miles. The flight elevation ranged from 3,000 to 3,500 feet above the ground. The other profile (Fig. 2), flown on February 23, 1950, is slightly less than 150 miles long and cuts across the southwestern corner of Kansas from Oklahoma to Colorado. The flight elevation was approximately 2,500 feet above ground.
Figure 1--Aeromagnetic profile west of Salina, Kansas.
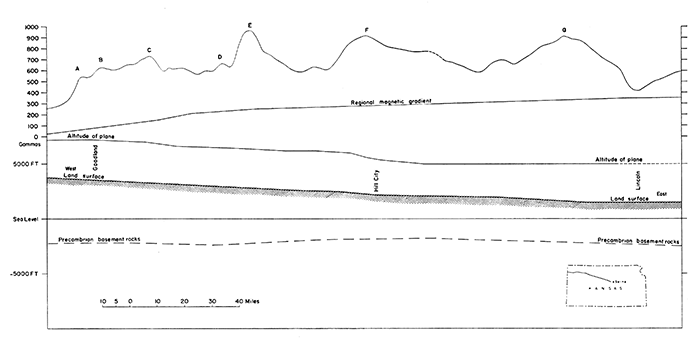
Figure 2--Aeromagnetic profile across southwest corner of Kansas.
There is an estimated uncertainty of ±1 mile in ground locations on the Salina profile and probably about twice this amount in locations on the other profile. This accuracy is adequate for a study of this type as most local magnetic effects attenuate rapidly with elevation and are of little importance in the study of regional structure, but major magnetic features which are recorded at higher elevations are several miles wide.
The data are obtained by a continuously recording fluxgate AN/ASQ-3A magnetometer installed in a multiengine aircraft; the detector element is towed on a long cable to remove it from the magnetic field of the plane. This equipment and its use have been fully described by Balsley (1952). The magnetometer records changes in the intensity of the earth's total magnetic field rather than absolute values, therefore the profiles do not have a common datum; the datum is arbitrarily assigned for each profile. The profiles contain instrumental and diurnal drift that occurred in the elapsed flying time but the drift is probably very small during the short period of time required for each traverse. The original records contain a small amount of instrumental noise, very short period fluctuations of less than 5 gammas, which has been eliminated in the final compilation. Some of the minor irregularities of 10 gammas or less that appear on the southwest profile may have been introduced in the process of machine rectifying the original curvilinear record and have been disregarded in the following discussion.
Inspection of the two profiles in Figures 1 and 2 shows a gradual rise in the over-all level of the profile from west to east because the regional gradient of the earth's magnetic field is decreasing at approximately 7 gammas per mile toward the southwest in western Kansas. The component of this gradient along the flight path has been plotted beneath each profile from magnetic data obtained from the U.S. Coast and Geodetic Survey. It will be noted that the gradient is greatest at the western end of the Salina profile, which is nearly east-west, and least near Salina, where the direction of the profile is southeasterly. In profiles where the regional magnetic gradient is large, it is removed to facilitate study of the effects due to the earth's outer crust, but in these two profiles the slight distortion produced by the regional gradient is not enough to affect the interpretation of the anomalies and its removal is not necessary.
Each profile consists of a series of major anomalies tens of miles across and hundreds of gammas in amplitude upon which are superimposed several much smaller features. To facilitate the discussion of these anomalies they have been lettered A through G on the Salina profile (Fig. 1), and H through M on the southwestern profile (Fig. 2). Some reasonable conclusions can be made about the geologic environment giving rise to the anomalies, partly on the basis of theoretical considerations and partly by analogy with the known magnetic expression of rocks obtained from surveys in other areas. A unique solution is not possible, however, because the size and shape of the anomaly depends on several unknown parameters such as the dimensions of the source, its depth of burial, and its magnetic susceptibility, and the magnetic susceptibility, in turn, depends not only on the composition of the rock but also on the nature of the magnetization, whether induced by the earth's field or remanent or a combination of the two. The interpretation of profiles is further restricted because, as the amplitude of the magnetic field is known only along a single line, it is necessary to assume that the anomalies are caused by two-dimensional bodies at right angles to the profile.
Because the magnetic susceptibility of unmetamorphosed sediments is negligible in comparison with that of igneous rocks and many metamorphic rocks, the sources of these anomalies are presumed to be in the buried Precambrian basement rocks, which lie at depths of 4,000 to 6,000 feet beneath the surface along the Salina profile and 6,000 to 7,000 feet beneath the surface along the profile to the south. The approximate position of the basement, which was derived by generalizing well data from the National Oil Scouts and Landmen's Association Yearbooks (1956 and preceding), has been indicated on Figures 1 and 2. In western Kansas the basement is relatively flat and has a gentle gradient to the southeast, except for a rise of about 1,000 to 1,500 feet under the broad Central Kansas Uplift (Eardley, 1951, p. 39). Any contribution to the magnetic profile by this uplift is undoubtedly masked by the larger and sharper anomalies produced by contrasts in magnetic susceptibility of the basement rocks. For example, an uplift 100 miles wide and 1,000 feet high will produce a total-intensity anomaly of only 15 gammas, if the moderately high susceptibility of 0.004 cgs units is assumed. On the other hand, an unbottomed igneous block 8 miles across with a susceptibility only 0.001 cgs units higher than that of the surrounding rocks will produce an anomaly of more than 200 gammas (Vacquier and other, 1951, p. 134). The role of basement relief is treated in greater detail in the analysis of an aeromagnetic survey in central Pennsylvania where the Precambrian rocks are also buried by a thick sedimentary sequence (Joesting and others, 1949, p. 1754-56).
It is sometimes possible to determine the approximate depth of the body causing an anomaly by measuring the horizontal extent of the steepest vertical gradient on the flank of the anomaly. This method, which is described in "Interpretation of aeromagnetic maps" by Vacquier and others (1951), yields the correct depth provided a suitably isolated anomaly is selected and certain assumptions about the disturbing mass are valid. The mass must have uniform polarization, vertical sides, and infinite downward extent, conditions which are approximated sufficiently in basement rocks to permit reliable determinations in most cases. For single profiles there is the additional requirement that the body must have a trend normal to the profile, for if the profile crosses the body at an oblique angle the depth obtained will be too large.
On the Salina profile (Fig. 1), analyses of the west flanks of anomalies A, B, D, E, and F and the east flank of C yielded the following depths below the airplane, which was approximately 3,500 feet above ground: A = 10,000 feet; B = 8,500 feet; C = 10,000 feet; D = 8,OOO feet; E = 13,OOO feet; and F = 4 3/4 miles. Although some of the anomalies were not ideal for this method, four out of six of these determinations give surface-to-basement depths in the range of 4,500 to 6,500 feet, which is in reasonable agreement with the 4,500 to 6,000-foot range in depth of the basement below the surface as established by drilling.
Several inferences can be made on the basis of the agreement between these data. Specifically, the assumption that the anomalies are due to the contrasts in susceptibility that occur in the basement rocks rather than to the relatively gentle upwarping of the basement surface is shown to be valid. The fact that no shallow depths were determined indicates that the anomalies are not caused by susceptibility contrasts within the sedimentary overburden or by later intrusions of igneous material into the sedimentary rocks. Finally, the smaller anomalies, A through D, and probably also E, seemingly were caused by variations in susceptibility in rocks extending downward from the top of the Precambrian. rocks, and F was caused by a source deep in the basement complex.
These were the only anomalies on the two profiles suitable for quantitative determinations with these techniques, but by using the same basic principle it is possible to make qualitative estimates of the other anomalies. Anomaly G on the Salina profile requires a source even deeper than that producing F. On the southwestern profile (Fig. 2), anomaly H, the three coalescing anomalies I, J, and K, and perhaps also M, could be caused by susceptibility contrasts in rocks deeply buried within the Precambrian basement rocks, but these anomalies may be caused by susceptibility contrasts nearer the top of the Precambrian rocks if the geometry is different than that assumed for making the depth determinations. The segment that lies between K and M contains some smaller features that may be caused by more shallow material in the basement.
Although it is unwise to place full reliance on interpretations based on the analysis of single profiles, several tentative conclusions are possible. The smaller anomalies between A and E on the Salina profile resemble those produced by local variations in susceptibility such as are found within many large igneous intrusive bodies and may indicate the presence of granite across this whole segment. A similar explanation might be made for the segment from K to M on the other profile but this interpretation is more doubtful. Rocks at or near the top of the Precambrian probably cause the various minor features on the flanks of the larger anomalies. Most of the broader features on the two profiles may be caused by large masses at a considerable distance beneath the surface of the Precambrian rocks.
Balsley, J. R. (1952) Aeromagnetic surveying in Advances in Geophysics: v. 1, p. 314-439, New York, Academic Press.
Eardley, A. J. (1951) Structural geology of North America: 624 p., New York, Harper.
Joesting, H. R, Keller, Fred, and King, Elizabeth R. (1949) Geologic implications of aeromagnetic survey of Clearfield-Philipsburg area, central Pennsylvania: Am. Assoc. Petroleum Geologists Bull., v. 33, p. 1747-66.
National Oil Scouts and Landmen's Assoc. 1956 (and preceding years), Oil and gas development in United States 1955 (and preceding years).
Vacquier, V. V., Steenland, N. C., Henderson, R G., and Zietz, Isidore (1951) Interpretation of aeromagnetic maps: Geol. Soc. America Mem. 47, 151 p.
Kansas Geological Survey
Comments to webadmin@kgs.ku.edu
Web version Nov. 21, 2013. Original publication date 1959.
URL=http://www.kgs.ku.edu/Publications/Bulletins/137/King/index.html