| Original published in W.W. Hambleton, ed., 1959, Symposium on Geophysics in Kansas: Kansas Geological Survey, Bulletin 137, pp. 199-207 | ||
Highway Geology Section, State Highway Commission of Kansas
The complete article is available as an Acrobat PDF file.
An earth-resistivity instrument has been used to supplement information, gained by other methods, concerning engineering geology and its application to the design and construction of highways in Kansas. This instrument has been successfully used in the preliminary classification of excavation, the location of low-displacement faults, and in the evaluation of quarry sites for the type and extent of materials present. It has also been used with success in indicating the presence of vertical joints in limestone quarries.
The engineering geology of certain areas in Kansas presents problems that require information other than that which can be obtained by routine geological investigations. The cost of obtaining the information by core drilling is often too great to warrant the use of the core drill. An earth-resistivity instrument has been used to supplement the information obtained by standard methods and to obtain information that was not obtainable by those methods at reasonable cost.
In the investigations conducted by the Highway Geology Section of the State Highway Commission of Kansas, a Model ER-7 [Manufactured by Carl A. Bays and Associates Inc., Urbana, Illinois] earth-resistivity instrument has been used employing the Wenner (1916) four-electrode configuration. In this method of investigation, four electrodes are equally spaced in a straight line and, with the instrument used, a vibrator-commutated direct current of known amperage is passed between the outside (field) electrodes. The drop in potential is measured between the two intermediate (potential) electrodes and is read directly on a scale, which converts the readings to resistivity in ohm-centimeters.
Two methods of interpreting and presenting results are employed. The first is the Gish-Rooney (1925) or individual-test-value curve, on which the measured apparent resistivities are plotted as ordinates and the corresponding electrode spacings (depth) as abscissas. The second is Moore's (1945) cumulative-resistivity curve. Both curves usually are plotted on the same graph utilizing the same abscissa scale but different ordinate scales.
An example of the two methods of presenting results is shown in Figure 1. The dashed line indicates the Gish-Rooney or individual-resistivity-test-value curve, and the solid line shows the cumulative method of plotting results. The readings shown were obtained from a depth traverse that attempted to locate the base of the Fort Hays chalk of the Cretaceous Niobrara formation. The electrode spacings were increased in increments of 2 feet, and readings were taken at each spacing (the effective depth of current flow approximates the value of the electrode spacing used).
The Gish-Rooney curve (Fig. 1) shows several changes in slope, resulting in a stair-step type of curve. This curve may indicate that zones in the Fort Hays chalk exhibit different resistivities at this location. As a first approximation, it was judged that the base of the chalk is shawn by the sharp inflection point at 34 feet, which may be caused by water below the base of the chalk. On the cumulative curve only two breaks or inflection points are indicated. This is an approximate method of presentation, however, and the inflection points may be shifted slightly, depending upon interpretation. It is possible, for example, to choose an alignment of the points that produces another slight change in slope at 22.5 feet. This alignment does not change the other two points of intersection and, if valid, may be due to the massive chalk zone near the base of the Fort Hays.
Figure 1-Resistivity curves showing individual-test-value curve compared with cumulative resistivity curve. [Project No. 36-45-F-092-3 (3), Station 715+ 08, Jewell County, Kansas, on U.S. Highway 36, about 1/2 mile west of Montrose.]
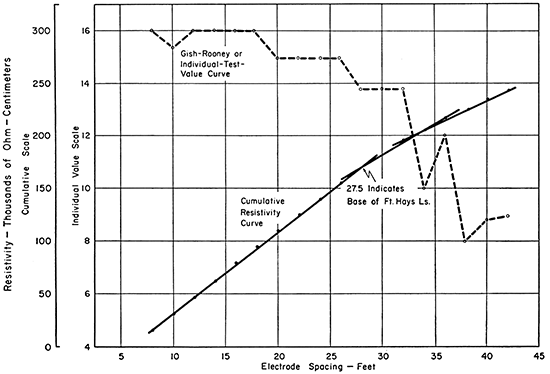
From the two curves it was determined that the break at 27.5 feet on the cumulative curve was the base of Fort Hays chalk. Thus, the break at 34 feet on both curves was judged to be the depth of weathering in the Blue Hill shale below the Fort Hays chalk. Core-drill information obtained later at the same location indicated that the base of the chalk was at a depth of 26.8 feet. Drilling stopped in weathered Blue Hill shale at 33.1 feet, hence the true depth of weathering was not determined. The base of the Fort Hays chalk has been determined in other areas by this same method with equal accuracy.
During the preliminary geological investigation of Project 26-11 S-648 (3) in Cherokee County, Wilson and Fredericksen (1955) found that the project area was mantled with residual Mississippian chert weathered from the Warsaw and Keokuk limestones. [Project begins at the Kansas-Missouri border 1/2 mile north of the Oklahoma line and extends northwest about 2 miles to the intersection of Kansas Highway 26 and U.S. Highway 166, 4 miles east of Baxter Springs, Kansas.] They found also that large chert boulders, which were locked in place, extended for several feet above the true mantle-bedrock contact, and should be classified as "rock excavation". From exposures in the area it was known that several feet of material above the large chert boulders would be "common excavation". For a definition of rock excavation and common excavation see State Highway Commission of Kansas (1955).
The blanket of chert gravel prevented investigation by the usual methods. Attempts were made to drive a steel sounding bar but penetration below 2 feet could seldom be obtained. Core-drill information would have been too costly to obtain for the entire project, so an earth-resistivity instrument was used to provide information, which otherwise would have been unobtainable at reasonable cost.
Several calibration depth traverses were conducted along road cuts in the area where the composition of the material could be observed. Both the individual-test-value and cumulative method were used to plot the results of the preliminary traverses. By comparing the calibration curves with the actual composition of the material is was found that in most places the depth of common excavation could be established within 1 foot, and that the base of the open joints (chert boulder zone) could be determined with equal accuracy.
Depth traverses were next made along the project line (usually to a depth of 40 feet) and the calibration curves were then used to help interpret the results. From information gained through the use of the resistivity instrument the geologists were able to predict that no rock excavation would be encountered anywhere along the proposed project. Actual construction records indicate that the prediction was correct.
Construction of Lovewell Dam on Whiterock Creek in Jewell County necessitated raising the grade of Kansas Highway 14 where it crosses the area to be inundated. The long, high fill that was necessary to obtain a satisfactory elevation for the roadbed required a large quantity of rip rap for protection of the fill slopes.
Usable material for rip rap is very scare in Jewell County. Byrne, Houston, and Mudge (1948) indicated the presence of an estimated 3,000 cubic yards of quartzite in the Dakota formation in the SE SW sec. 12, T. 5 S., R. 6 W., Jewell County. Swineford (1947), however, stated that the quartzite at that location was less than 3 feet thick. Thus, the amount of material available could be much less than the estimated 3,000 cubic yards.
Inspection of the site led to doubt that enough quartzite actually was present to warrant opening a quarry. Resistivity surveys were made to evaluate the possibility of obtaining a sufficient quantity of usable material,
Calibration and test curves were made from resistivity surveys on the thick quartzite deposits near Lincoln, Kansas. The readings taken in that area indicated resistivities of nearly 15,000 ohm-centimeters near the surface, gradual1y increasing to 80,000 ohm-centimeters at a depth of 40 feet.
Resistivity readings from traverses at the quartzite location in Jewell County had values of about 13,000 ohm-centimeters at the surface, but these values dropped abruptly to an average of 5,000 ohm-centimeters with depth. The drop in apparent resistivity with depth was interpreted to indicate that the quartzite actually was only 2 or 3 feet thick, and therefore present in insufficient quantity to warrant further consideration.
During the routine geological investigation of Project 36-45 F-092-3 (3) Jewell County, the geology field party located a series of faults in the Fort Hays chalk in the backslopes of U.S. Highway 36 about 1/2 mile west of the town of Montrose. The faults were not readily visible because they display only small vertical displacement. They were difficult to locate even from core-drill information because of the small displacement. Maximum vertical displacement was less than 3 feet, and the drill holes had to be located near the fault plane to detect offset of the beds. If the drill holes were located a few feet from the fault plane, no evidence of faulting could be detected. Although the project line was nearly parallel to existing U.S. Highway 36, the presence and exact location of the faults on the new alignment could not be ascertained by routine methods of investigation.
Constant-depth resistivity surveys were conducted in an attempt to establish the location of the faults on the proposed project. This method differed from the depth traverses in that the electrodes were equally spaced at a pre-determined interval and the spacing was not changed during the investigation. The electrodes were placed parallel to centerline of the proposed project, and the entire electrode configuration was moved parallel to centerline in increments of 4 feet after each reading. A spacing (or depth) of 8 feet was chosen because that depth penetrated the top of the Fort Hays chalk member at all places.
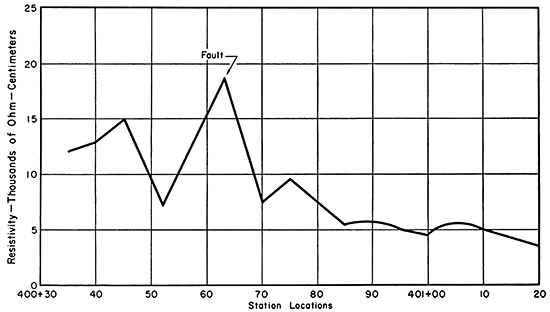
It was thought that the resistivity readings would vary with mantle thickness and topography, except where a fault was encountered; at such places a sharper change in readings was expected. Five possible faults were located as a result of the constant-depth traverse. Each fault was indicated by the saw-tooth appearance of the resistivity curve as shown in Figure 2. It was not then known, however, whether the location of the fault coincided with the high point on the curve or with one of the low points on either side of the high point.
Figure 2-Constant-depth resistivity curve showing location of fault in Fort Hays chalk. [Project No. 40-98-IN-01-3(14), Ellis County, Kansas, near southwest corner of Ellis.]
At about the same time, field geologists conducting a preliminary geologic survey on Project 40-98 IN-01-3 (14) Ellis County located two faults in the Fort Hays chalk near the southwest corner of the city of Ellis. Surface expression of the faults consisted of coarsely crystalline calcite along the fault traces, which crossed centerline at right angles.
A constant-depth traverse was conducted parallel to centerline at a spacing (depth) of 10 feet, 5-foot progressions being made normal to the fault trace. A straight plot of resistivity in ohm-centimeters against station location across one of the faults is shown in Figure 2. The same type of saw-tooth effect was observed in the resistivity curves for the faults in Jewell County. Furthermore, in Ellis County the exact location of the faults was known. It was found that the apex of the high peak coincided with the location of the fault plane. This information was then used to predict the location of the fault planes on the Jewell County project. At the time of this writing, excavation had not begun on the Jewell County project, and the accuracy of the predictions is not known.
In addition to locating the faults, an attempt was made to determine the strike and dip of the fault plane. The strike was determined by running a second traverse parallel to the first but offset from it by a distance of 100 feet. The strike or at least the trend of the fault could be obtained by joining the two faultplane locations. The apparent dip was determined by running another traverse at the same location, but at a greater depth. The dip was then computed from the difference in elevation of the two traverses and the shift in the location of the resistivity peak caused by the fault plane.
The apparent dip of one of the Jewell County faults (only one checked) was found to be 60° by this method. The apparent dip of the (same ?) fault plane that was observable in the backslope of U.S. Highway 36 also was 60°. The dip of one of the faults in Ellis County was computed to be 83°, and dip of 80° was observed where the fault was exposed in a nearby stream cut. More work is necessary before it can be said definitely that these methods of determining dip and strike are valid, but the seeming accuracy of the completed work indicates that the possibility does exist.
Quarry operators often have found that limestone quarries, opened for the purpose of obtaining concrete aggregate, proved to be unsatisfactory, owing to excessive clay content. The clay usually was found in vertical joints, which were not located during the preliminary core-drilling investigations.
The success of the resistivity instrument in determining the presence of faults suggested its use to indicate the presence of vertical jointing in proposed limestone quarry sites. Several constant-depth traverses were conducted at operating quarries that showed clay-filled vertical joints, closed vertical joints (no clay), and no visible indication of vertical jointing.
All resistivity surveys made at quarries that exhibited vertical jointing produced saw-tooth resistivity curves much like those obtained from faulted areas. Quarries that exhibited no apparent vertical jointing yielded resistivity curves with no saw-tooth characteristics. Figure 3 shows resistivity curves obtained from the Stoner limestone in quarries located about 1/2 mile apart. Both traverses utilized an 8-foot spacing between electrodes and 4-foot progressions of the entire electrode configuration. Curve A shows typical saw-tooth character of curves obtained at quarries that exhibited strong vertical jointing. The high readings at the beginning of the curve are due to the poor contact of electrodes with the very thin soil on top of the Stoner limestone. Clay-filled joints were found to correspond with locations 16, 40, and 65 on this curve. Curve B is typical of curves obtained from quarries that did not exhibit vertical jointing.
Figure 3--Resistivity curves from constant-depth traverses over Stoner limestone east of Ottawa, Franklin County, Kansas. Curve A--Bert Ross quarry, SW sec. 6, T. 17 S., R. 20 E., which exhibited clay-filled vertical joints. Curve B--Concrete Materials quarry, SE sec. 6, T. 17 S., R. 20 E., which did not show any vertical jointing.
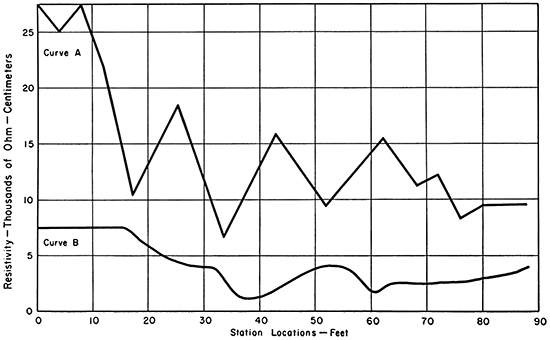
These results indicate that proposed quarry sites possibly could be evaluated for the presence of vertical joints. If constant-depth resistivity traverses produce curves that fail to exhibit a saw-tooth effect when plotted on a horizontal scale of 1 inch=10 feet and a vertical scale of 1 inch=5,000 ohm-centimeters, then vertical jointing is probably not present. If a sawtooth curve is obtained, and if adjacent high and low readings differ by more than 5,000 ohm-centimeters, then vertical jointing is likely to be present.
The exact location of the joints cannot be predicted if the joint spacing is equal to or less than the distance between the outside (current) electrodes. This is readily apparent because the resistivity curves would be influenced by two or more joints that occurred within the limits of the electrode configuration. Also it is difficult to determine whether a curve is influenced by more than one joint at a time. The joint spacing might be determinable by comparison of traverses at different depths to note the appearance or disappearance of some of the peaks. This conclusion is speculative, however, because an exact joint pattern has not yet been worked out.
Indication of vertical jointing is possible only under conditions of thin overburden; the difference between adjacent high and low readings becomes smaller as the thickness of overburden increases. The fact that vertical jointing is indicated by the resistivity instrument does not necessarily mean that the quarry will contain clay-filled joints. It was found that closed joints containing no clay produced saw-tooth curves just like those obtained from clay-filled joints and faults.
Byrne, F. E., Houston, M. S., and Mudge, M. R. (1948) Construction materials in Jewell County, Kansas: Preliminary Report, U.S. Dept. Interior Pub.; Table I.
Gish, O. E., and Rooney, W. J. (1925) Measurement of resistivity of large masses of undisturbed earth: Terrestial Magnetism, v. 30, p. 161-188.
Moore, R. W. (1945) An empirical method of interpretation of earth-resistivity measurements: Am. Inst. Mining and Met. Engineers Trans., v. 164 (Geophysics) p. 197-214.
State Highway Commission of Kansas (1955) Standard specifications for state road and bridge construction: sec. 13, p. 68-72.
Swineford, Ada (1947) Cemented sandstones of the Dakota and Kiowa formations in Kansas: Kansas Geol. Survey, Bull. 70, pt. 4, p. 53-104. [available online]
Wenner, F. C. (1916) A method of measuring resistivity in the earth: U.S. Bur. Standards Bull. 12, p. 469-478.
Wilson, Frank, and Fredericksen, Walter (1955) Geological Report, Proj. 26-11 S-648 (3) Cherokee County: Open file report, Kansas State Highway Commission.
Kansas Geological Survey
Comments to webadmin@kgs.ku.edu
Web version Dec. 1, 2013. Original publication date 1959.
URL=http://www.kgs.ku.edu/Publications/Bulletins/137/Crumpton/index.html