Kansas Geological Survey, Bulletin 109, Part 5, originally published in 1954
Originally published in 1954 as Kansas Geological Survey Bulletin 109, Part 5. This is, in general, the original text as published. The information has not been updated.
A map depicting the thickness of a sequence of rocks between surfaces that were once flat or relatively flat records the structural movements that occurred between the development of the limiting surfaces. Such an isopachous map is essentially a structure map of the first surface at the time of the second. The accuracy with which such maps reveal the structural movements that took place during the interval depends on how closely the limiting surfaces approached a plane. The deformation is most accurately revealed where the confining surfaces were depositional. Erosional surfaces of low topographic relief may be used to reveal regional warping of broad areas. The relation of the sequence of rocks to underlying and overlying formations determines the time of movement. Isopachous maps that include sequences of formations whose thicknesses were separately controlled by conflicting patterns of folding express a composite of both movements and reveal neither.
Isopachous maps involving great thicknesses of rocks have been used for some time to reveal structural movements in the Rocky Mountain region. They are equally useful in determining the milder structural warpings of the mid-continent region where the rock sequences are thinner and the deformation is of a lower order. The evaluation of such structural movements in the mid-continent region, however, is attended by some difficulties involving refinements of subsurface stratigraphy such as topographic relief on truncated surfaces and local channeling. These factors are of secondary importance in the western regions where the sediments are thicker and deformed by much stronger structural movements. This paper is intended to call attention to the application and limitations of thickness maps in determining regional deformation especially in the mid-continent.
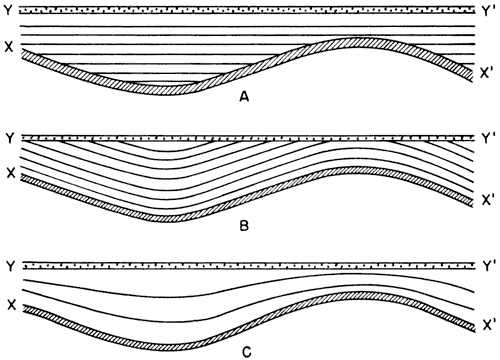
If an originally flat surface such as X-X' of Figure 1A is covered by younger rocks which are later folded and beveled by erosion to the surface Y-Y' (Fig. 1B), the variations in the thickness of the rocks between the two surfaces as shown in B will obviously reveal the place and the amount of folding. The thin areas represent anticlines and the thick areas represent synclines. Thickness maps, which are three dimensional, are structural maps if, as in the cross sections, the limiting surfaces were originally flat and horizontal. Such maps show the structure of the surface X-X' at the time of Y-Y'.
Figure 1--Hypothetical cross sections illustrating how deformation is shown by the difference in thickness between a folded sedimentary surface and a subsequently beveled surface.
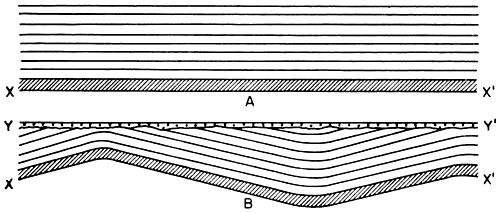
The flat surfaces that limit the sequence may be sedimentary surfaces like X-X' or the result of erosional beveling such as Y-Y'. It is obvious that thickness maps will not reveal structural movement with mathematical accuracy unless both upper and lower surfaces were originally geometrically flat and horizontal. Such surfaces are, of course, rare although they were at times approached on sedimentary beds, especially evaporites. When both the limiting surfaces were depositional like X-X', the thickness reveals the structure with a high degree of accuracy. When one or both of the surfaces were erosional, the accuracy with which the structure is revealed by thickness lines depends upon how closely the surfaces originally approached conditions of flatness and horizontality. If the topographic relief is relatively high the thickness may reveal only generalized structure over broad areas.
This discussion refers especially to regional structure. The horizontal distances represented in the diagrams may be assumed to be from 50 to 100 miles.
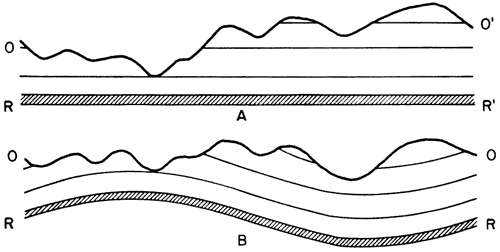
In Figure 2A, the line O-O' represents a deeply eroded surface. A thickness map of the interval O-R will represent the topography of the surface O-O' and not the structure. In Figure 2B, which represents the same sequence after folding, the deformation during the interval cannot be determined by a thickness map because one of the surfaces did not even approach a horizontal plane. Such a surface occurs at the base of the Mississippian Cowley formation of Kansas.
Figure 2--Hypothetical cross sections illustrating the absence of any structural significance in thickness maps when one of the limiting surfaces is very irregular due to deep erosion.
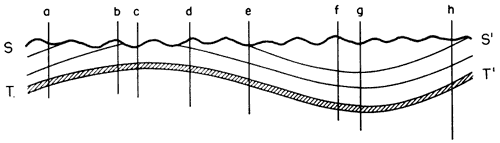
Under the conditions represented in Figure 3, the erosional relief of the surface S-S' is small when compared to the regional deformation. The regional structure will be revealed in general terms by a thickness map of the interval S-T. The vertical lines represent wells that have penetrated the sequence at high and low points of the eroded surface. The use of these wells in drawing isopachs will give a distorted impression of the local structure but will approximately represent the regional deformation. The Devonian rocks in Kansas, which overlie a surface with a local relief of as much as 80 feet, is an example. The imperfections of eroded surfaces generally prevent their use in small areas, although some erosional surfaces, like that of the Mississippian in Kansas, were so nearly flat that thinning of the Mississippian limestones occurs on the crest of even low local anticlines in eastern Kansas.
Figure 3--Hypothetical cross section illustrating the relation of structure to thickness of a sequence where topographic relief of one limiting surface is considerably less than the structural relief of the other. Regional deformation is approximately revealed. Letters a to h represent wells penetrating the unit.
Although thickness maps may reveal the place and amount of folding, they do not reveal the sequence of events nor the time of folding. Figure 4A represents the deformation of the original flat lower surface as having developed before the deposition of the overlying sediments. Figure 4B represents the folding and beveling of the rocks as having occurred at the end of the sequence of deposition. Figure 4C represents the deposition of a sequence of rocks that was being deformed more or less contemporaneously with deposition. In C, both the upper and lower surfaces are depositional.
Figure 4--Cross sections showing that thickness maps reveal the total deformation that took place between the limiting surfaces and not the sequence of structural events. Maps representing the thickness of the unit between surfaces X-X' and Y-Y' in sections A, B, and C will be the same, although the time of deformation in each is different.
The thickness maps in all three of these examples are identical and reveal only the place and amount of deformation. In order to discover the sequence of events it is necessary to determine the stratigraphic relation of the section involved to the overlying and underlying rocks by the construction of such cross sections as those shown.
It should be recalled that most structural deformation probably took place by differential and oscillatory movements such as are so clearly revealed by the cyclical deposits of the Pennsylvanian. The conditions represented by Figure 4A and 4B would be modified by such differential movements during the period of deposition.
The examples illustrated by Figure 4 are not hypothetical. Diagram A roughly illustrates the character of the deformation between the top of the Mississippian and the base of the Kansas City when the beveled surface at the top of the Mississippian in Kansas was deformed before the region was submerged in the Pennsylvanian sea. Diagram B roughly illustrates the character of the deformation between the top of the Simpson and the base of the Devonian when folding and beveling occurred mainly at the end of the sequence. Diagram C illustrates conditions that prevailed in Kansas during the Pennsylvanian when differential warping was more or less contemporaneous with cyclical deposition.
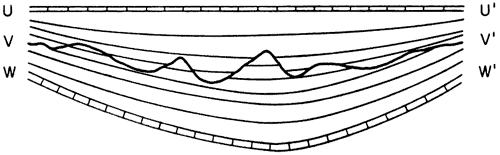
Figure 5 shows the progressive deformation of a syncline interrupted by an angular unconformity that resulted in topographic relief represented by V-V'. The thickness of rocks between U-U' and W-W' records the total of many differential movements during the deposition of the sequence. The movements that occurred during the hiatus at V-V' which were in the same pattern of folding as those above and below are included in the total folding expressed by the overall thickness. Such a sequence occurs between the top of the Topeka limestone of late Pennsylvanian age represented by W-W', and the Cottonwood limestone of early Permian age in Kansas, represented, by U-U'. The line V-V' represents the unconformable contact between Pennsylvanian and Permian strata.
Figure 5--Cross section showing that the total movement inferred from the thickness of rocks between the originally flat surfaces U-U' and W-W' is not affected by an intervening unconformity V-V'.
A more complex situation results when the sequence mapped includes formations warped by conflicting structural movements. Figure 6A represents a sequence of rocks that was originally horizontal but later deformed and beveled to the surface M-M'. This surface was later buried beneath horizontal sediments which were finally warped by a new and different pattern of folding and subsequently beveled as represented in Figure 6B. The later folding greatly altered the original structure below the surface M-M'.
Figure 6--Cross sections showing the effect on the thickness of a sequence between the originally flat surfaces N-N' and O-O' when folding represented by N-N' of cross section A was modified by later folding of another kind as shown by M-M' of cross section B. The overall thickness between O-O' and N-N' shown in cross section C does not differentiate between the results of the two movements.
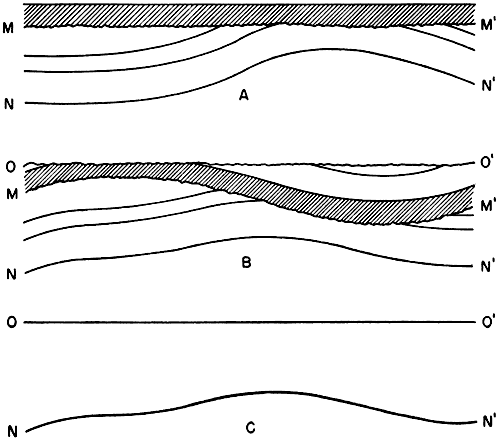
In Figure 6C, an anticline appears in the center of the line N-N' as a result of the two conflicting patterns of deformation. In the subsurface this anticline occurs neither in its original position as in A nor under the anticline in the surface rocks as in B. Something like this happened when the westerly trending Chautauqua arch which was developed in southeastern Kansas between Simpson and Mississippian time was crossed at right angles in early Pennsylvanian time by the northerly trending Cherokee basin syncline. The present attitude of the Pennsylvanian rocks in southeastern Kansas does not reveal the Chautauqua arch. The destruction in this way of regional structural features by later movements is not uncommon and a number of other phenomena of the kind are known in the Kansas-Missouri area.
The diagrams of Figure 6 are, of course, greatly exaggerated but they illustrate the concept that there may be a shifting of the crest in minor as well as regional anticlines under the influence of later and different patterns of folding. However, where the changes in regional dip are low as in most areas in Kansas, the shifting of the crest on strong local anticlines seems to be negligible in most cases. There are, however, some exceptions.
Thickness maps alone, however, are not infallible guides in revealing structural movements and it is necessary to be sure that the limiting surfaces were originally essentially flat. Figure 7A shows the thickness of the rocks between surfaces X-X' and Y-Y'. Y-Y' is known to be reliable datum. X-X' is an eroded surface which in other areas was a beveled surface with very low erosional relief as indicated by the regularity of the overlying formation. Regarded alone the variations of the thickness of rocks between X-X' and Y-Y' suggest the occurrence of a beveled syncline such as is shown in Figure 7B. However, consideration of the relation of the surface X-X' to the underlying rocks shows that the thickening of the sequence is accompanied by a compensating thinning in the older rocks as shown in Figure 7C.
Figure 7--Cross sections showing the erroneous interpretation of cross section A as a beveled syncline as in cross section B, on consideration of thickness alone. The relation of the sequence between X-X' and Y-Y' to the underlying formations, however, reveals a filled valley without deformation as shown in cross section C and Figure 8.
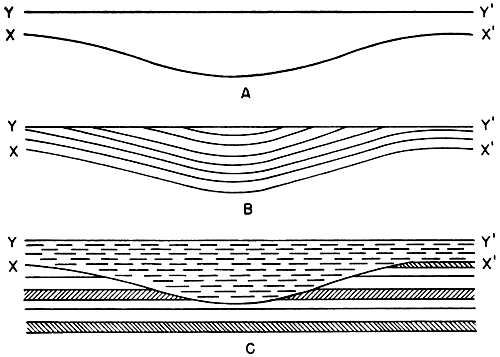
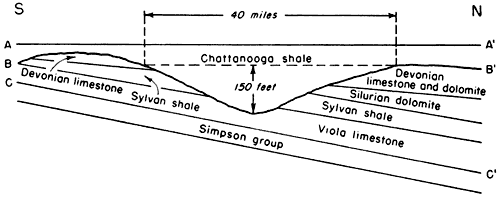
A classic example of this relation is shown in Figure 8. The diagram represents a north-south cross section across a valley eroded in the pre-Chattanooga surface of McPherson County, Kansas. The thickening of the Chattanooga shale is compensated by the thinning of the underlying formations.
Figure 8--Diagrammatic cross section of a pre-Chattanooga valley filled by later Chattanooga shale in McPherson County, Kansas. The interval between A-A' and B-B' does not reveal structural movement. The interval between A-A' and C-C' indicates deformation.
Figures 9 and 10 illustrate the application of these principles. Both are taken from a report prepared in cooperation with the geological surveys of Kansas, Missouri, Iowa, and Nebraska (Lee and others,1946).
Figure 9 shows the thickness in northern Missouri and southern Iowa of all rocks between the Pre-Cambrian and the Simpson group which in this area is represented mainly by the St. Peter sandstone. It includes the Arbuckle group and the Lamotte (Reagan) sandstone. The thickness interval is 200 feet. Only those wells which reveal the presence of the Bonneterre at the base of the sequence have been used. Wells in which hills of Pre-Cambrian rocks are overlain by rocks younger than the Bonneterre have been ignored.
Figure 9--Map showing the thickness of the sedimentary rocks below the St. Peter sandstone, and in southern Missouri, the thickness of the rocks between the top of the Roubidoux formation and the top of the Lamotte sandstone. Thickness lines spaced at 200-foot intervals.
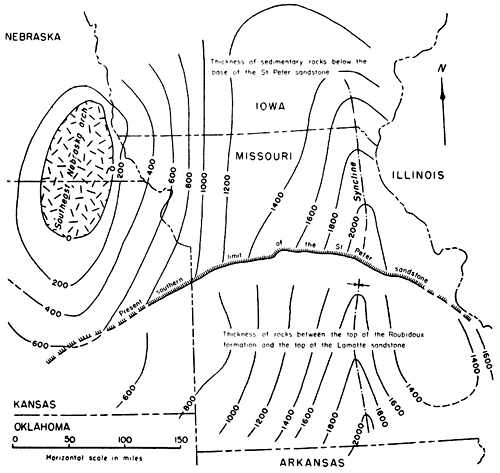
Except on such hills, the Bonneterre at the base of the Arbuckle group is widely distributed. It lies near the base of a 2,000-foot sequence in northeastern Missouri, which is topped by uppermost Arbuckle and capped by St. Peter. In an area in northeastern Kansas and southeastern Nebraska, the St. Peter overlaps on granite. On the flanks of this area the St. Peter immediately overlies the Bonneterre. The thickness of the sequence thins westward from more than 2,000 feet in eastern Missouri to a featheredge in northeastern Kansas on the flanks of the uplifted area called the Southeast Nebraska arch.
The thickness map reveals that between the deposition of the first sediments on the Pre-Cambrian surface and the deposition of the St. Peter, a deep syncline developed in eastern Missouri accompanied by the rising of the Southeast Nebraska arch. The local broadening of the space between some of the isoopachs may represent low secondary structures or, perhaps, minor topographic relief on the Pre-Cambrian surface.
The St. Peter is no longer present in the Ozark region and isopachs to the base of the St. Peter cannot be drawn in southern Missouri. The Roubidoux, however, provides a suitable datum for isopachs. In southern Missouri thickness lines have been drawn to show the thickness between the top of the Lamotte sandstone at the base of the Bonneterre and the top of the Roubidoux. The pattern of folding is similar to that revealed below the St. Peter in northern Missouri. Near the Arkansas line, the top of the Lamotte had subsided more than 2,000 feet below the top of the Roubidoux but only 600 feet on the west limb of the syncline at the margin of control. An anticline seems to have developed in southeastern Missouri. The thickness map of the Roubidoux-Lamotte sequence in southern Missouri reveals that the syncline recognized in northeastern Missouri was already developing before Roubidoux time and was thus due in part to differential subsidence. Other data indicate that there were intermediate periods of exposure, erosion, and beveling during the period of deposition as well as at its close. I emphasize the pre-St. Peter regional structure because Figure 10 shows a complete reversal of the pattern of folding.
Figure 10 shows the thickness of rocks between the top of the Arbuckle and the base of the Devonian. The sequence includes the St. Peter sandstone, the Viola or Kimmswick limestone. the Maquoketa or Sylvan shale, and rocks of Silurian age. The thickness can be shown only in areas in which both the Devonian and St. Peter rocks have survived. The several formations of the sequence were truncated by pre-Devonian erosion and cropped out on the pre-Devonian surface in more or less parallel belts flanking the Arbuckle of the Ozark area as shown.
The contour interval is 200 feet. The 50-foot contours of the original map reveal some local irregularities in the thickness due to topographic relief on the upper surface of the sequence but these details do not materially affect the overall relations shown by 200-foot isopachs.
Figure 10--Map showing the thickness of the sequence of rocks from the base of the St. Peter sandstone to the base of the Devonian dolomite and limestone. Thickness lines spaced at 200-foot intervals.
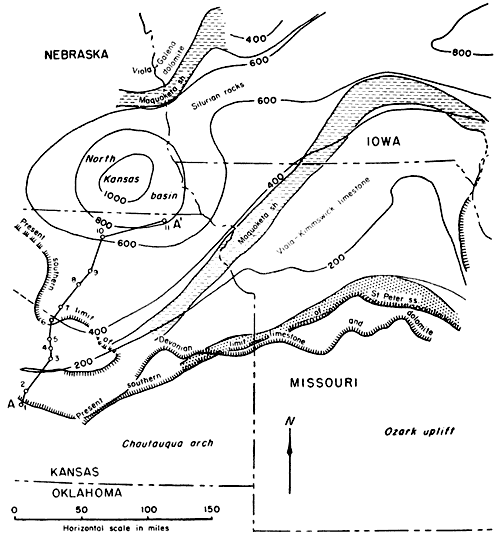
It will be noted that the area of the Southeast Nebraska arch has become a basin known as the North Kansas basin in which more than 1,000 feet of rocks of this sequence underlie the Devonian. The Ozark area, which until St. Peter time was traversed by a deep southerly plunging syncline, has taken the first step toward becoming the Ozark uplift of subsequent geologic history. The southerly plunging syncline in northeastern Missouri has been transformed into a northerly plunging anticline. The cause of this extraordinary reversal of structural pattern is obscure. It may ultimately be explained by contemporaneous major structural activity in remote regions. Similar reversals in the pattern of deformation occurred during later periods in Kansas and adjoining areas.
Such changes in regional structure although accomplished by slow differential movement must have been accompanied by readjustment and migration of ground water, and changed the direction of movement of nascent oil. Oil already trapped in an anticline might be in unsymmetrical relation to the anticline after tilting. Where the subsequently imposed regional dip exceeded the closure of an anticline in which oil was already trapped, the oil must have escaped up dip.
Lee, Wallace, and others (1946) Structural development of the Forest City basin of Missouri, Kansas, Iowa, and Nebraska: U. S. Geol. Survey, Oil and Gas lnvesti., Prelim. Map 48, sheets 1-7.
Kansas Geological Survey, Thickness Maps as Criteria of Regional Structural Movement
Placed on web Aug. 8, 2007; originally published in May, 1954.
Comments to webadmin@kgs.ku.edu
The URL for this page is http://www.kgs.ku.edu/Publications/Bulletins/109_5/index.html