Kansas Geological Survey, Open-file Report 2004-65
by
Saibal Bhattacharya, Susan Nissen, Martin K. Dubois, and Alan P. Byrnes
Kansas Geological Survey, Lawrence, Kansas
KGS Open File Report 2004-65
This report is a follow-up to KGS OFR 2003-76. The studies reported here pertain to detailed characterization of a Mississippian carbonate field--Judica (Ness County, Kansas). This field had been short listed as a part of a U.S. DOE sponsored project to identify a target reservoir with potential for placement of a horizontal infill well. The industry partner in this project was Mull Drilling Co. (MDC). Therefore, fields and leases made available to this project were owned/operated by MDC. The initial preliminary audit was carried out on 35 Mississippian fields in the target area of interest for MDC (16S/26W to 28S/20W in Kansas) to select fields that have produced greater than 0.5 MMSTB and that showed minimum depletion in reservoir pressure from publicly available data sources. This exercise resulted in a short list of 14 fields that were studied more closely to rank them in accordance to their current reservoir pressure (or pressure depletion), minimum pay thickness, average well spacing, volumes of estimated remaining oil-in-place (ROIP), recovery efficiency, and MDC's operational preferences. Six fields were selected as a result of this ranking process and a second round of screening studies were carried out on them. These included single-phase tank model simulation studies using RESMOD to predict the productive potential of infill wells and an inventory of available data--fluid production, pressure, petrophysical log, and core data. On the basis of these studies, 3 Mississippian fields were selected for detailed characterization and simulation studies. MDC finally selected Judica field as their candidate field for drilling the pilot well to the demonstration horizontal trajectory.
Figure 1 is a structure map on the Mississippian pay in the Judica field study area. This model has been detailed in KGS OFR 2003-76, and was constructed by integrating available wireline log, core, and production data. This is a mature Mississippian field, and before the shooting of the 3D data it was assumed that well logs and other data from already drilled wells, here on a 80 acre spacing, is sufficient to model these fields in the detail that would enable making reasonable predictions about the economic viability of horizontal infill wells. Facts mentioned in Figure 1 indicate the complexity in the field. Wells located high on the structure have tested dry, while cumulative production varied significantly between the producing wells. Evidence of a channel to the west and south of the area of interest is apparent, and given the well spacing it is difficult to trace its exact boundaries. Also, limited water production and pressure data make simulation predictions less robust than one would like. This map also shows the location of the pilot wells and the wells where shut-in fluid levels were recorded as a part of this study.
Figure 1. Pre-pilot tasks accomplished, Judica Field, reservoir model. A larger version of this figure is available.
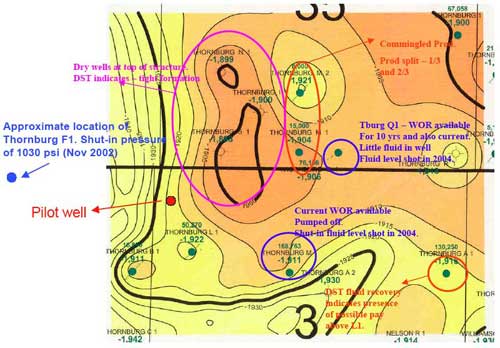
Figure 2 summarizes the results from the simulation studies based on the pre-3D geomodel. Figure 2A is the map of the estimated reserves in place in Judica study area as of January 2003. Figure 2B captures the drainage effects of a north-south trending horizontal well (HWell) over a 10-year production period. Figure 2C summarizes estimated cumulative oil and water production from this horizontal well. Figures 3A, 3B, and 3C show similar estimations for an east-west trending horizontal infill well. Figure 4 shows the simulator-calculated average reservoir pressure distribution in the study area as of January 2003. It appears that most of the reservoir is calculated to be at an average pressure of 1080 psi (yellow colored grids). As shown in Figure 1, fluid columns were shot over a 5 day shut-in period in Thornburg F1 (TF1), located outside and west of the study area, in November 2002 and indicated that the reservoir pressure was in the range of 1030 psi. The closeness of the calculated average reservoir pressure, after history matching of individual wells in the study area, with the recorded shut-in pressure at Thornburg F1 appeared to validate the underlying geomodel and the simulation output.
Figure 2A. Pilot well--evaluate potential of different trajectories, January 1, 2003, remaining reserves (oil-ft).
Figure 2B. Ten years in the future, January 1, 2013, remaining reserves (oil-ft) after drilling an infilll horizontal well, the Mull 2. Located northeast of the L 1 in far NW sect. 3. Well length = 1210 ft., skin = 1.5, well diameter = 6 inches, bottom hole pressure = 200 psi (Pwf).
Figure 2C. Estimated production.
| Year | Cum Oil (MO) |
Cum Water (MW) |
|---|---|---|
| 2004 | 15.4 | 103.6 |
| 2006 | 32.5 | 303 |
| 2008 | 44.8 | 498.5 |
| 2010 | 54.1 | 689.6 |
| 2012 | 61.5 | 875.3 |
| 2013 | 64.6 | 966.2 |
Figure 3A. Pilot well--evaluate potential of different trajectories, January 1, 2003, remaining reserves (oil-ft) [same as fig. 2a].
Figure 3B. Ten years in the future, January 1, 2013, remaining reserves (oil-ft) after drilling an infilll horizontal well, the Mull 3. located northwest of the L 1 in far NW sect. 3. Well length = 1870 ft., skin = 1.5, well diameter = 6 inches, bottom hole pressure = 200 psi (Pwf).
Figure 3C. Estimated production.
| Year | Cum Oil (MO) |
Cum Water (MW) |
|---|---|---|
| 2004 | 40 | 149.3 |
| 2006 | 77.1 | 460.8 |
| 2008 | 99.6 | 775.2 |
| 2010 | 115.5 | 1084.1 |
| 2012 | 127.6 | 1383.1 |
| 2013 | 132.8 | 1529 |
Figure 4. Average reservoir pressure mapp of L5 as of Jan. 2003. Current reservoir pressure data assumed to be similar to Thornburg F1 located west of the study area. Bottom-hole pressure of 1,030 psi recorded in Nov. 2002 after a 5-day shut-in.
Based on the history matches of fluid production, average reservoir pressure, and predicted production volumes from a targeted horizontal infill, MDC decided to drill a pilot well (Thornburg 1-3) to validate the structure and thickness of Mississippian pay porosity and the extent of the channel bordering the study area. The DST at the pilot well was also intended to confirm the current reservoir pressure and retrieved core data would be tested in the laboratory to obtain representative petrophysical data--permeability- porosity correlations, relative permeability and capillary pressure.
The pilot well encountered the Mississippian that was structurally very low, i.e., below the field oil-water contact (OWC). Three attempts at coring resulted in the retrieval of only conglomerate fill. Also, the DST resulted in questionable shut-in pressure profiles suggesting packer failure. Figure 5 summarizes the major events that took place after the drilling of the pilot well. One of the major reasons for drilling the pilot well was to confirm the current reservoir pressure. Infill horizontal wells are successful when they are placed in reservoir with low or minimal pressure depletion. Most of the productive wells in the study area have already been plugged. Thus, shut-in fluid levels were shot at Thornburg M1 Slawson (TM1s). However, it resulted in a very slow build-up that failed to stabilize after 3 days and thus was terminated prematurely. From the recovered data, it appeared that the reservoir pressure may be in the range of 500 psi, which is substantially less than that recorded at TF1 and calculated by the simulation studies. A shut-in fluid column survey at Thornburg Ql (TQ1) resulted in quick stabilization of pressure at 1000 psi. Given the discrepancy between shut-in fluid columns at TQ1 and TM1s, MDC decided to shoot a 3D seismic survey over the study area to better understand the reservoir heterogeneity.
Figure 5. Tasks accomplished after drilling of pilot well.
| Nov. 19, 2003 | Spudded pilot well. |
| Nov. 27-28, 2003 | Attempted to core Mississippian interval. |
| Nov. 29, 2003 | DST Mississippian-Warsaw interval. |
| Nov. 30, 2003 | Rig released. |
| Dec. 16, 2003 | Shut-in fluid levels from Thornburg M1 Slawson (TM1s) received. Very slow build-up. Test terminated before stabilization of fluid column. Suspect reservoir presure close to 500 psi. |
| Jan. 8, 2004 | Shut-in fluid level measurement at Thornburg Q1 (TQ1) initiated. |
| Jan. 13, 2004 | Shut-in fluid levels at TQ1 indicates a reservoir pressure in the range of 1000 psi. |
| Jan. 29, 2004 | Mull Drilling decides to shoot a 1 sq. mile 3D seismic survey centered around the pilot well. Mull also negotiating with Pintail, operator of the adjacent TM1s lease. Tentative date for 3D survey, April 2004. |
| April 23, 2004 | Start of 3D survey in Judica. |
| May 21, 2004 | Mull receives results from 3D survey. |
| June 15, 2004 | Marty Dubois updates reservoir model after input from Mull. |
| July 6, 2004 | Present simulation results to Mull based on Marty's initial revised model. Forward 3D data for curvature analyses by University of Houston. |
| July 26, 2004 | Obtained interpreted results from University of Houston. |
| Aug. 19, 2004 | Mull visits KGS to review final reservoir model. Extent of resertvoir compartmentalization becomes evident--pressure and reservoir compartments. |
| Sept. 7, 2004 | Complete simulation of area of interest using current reservoir model. |
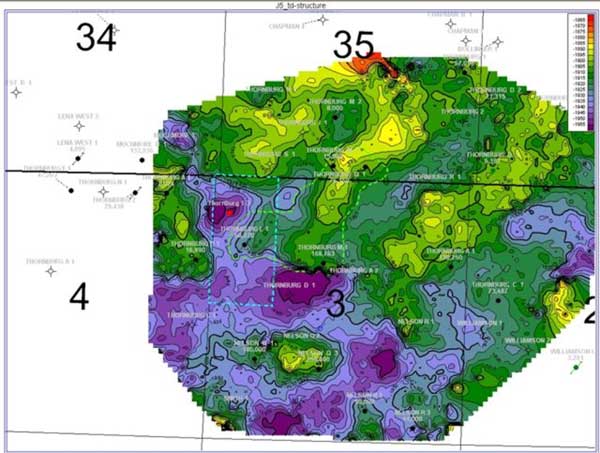
Drilling the Thornburg 1-3 well illustrated the risk of drilling without a clear view of the complexities of the Mississippian erosional and karsted surface. Subsequent 3D seismic shot over the Judica area revealed a significantly different view of the Mississippian terrain and a more refined model with smaller compartments. Seismic reflections corresponding to the top of the Mississippian and other surfaces were interpreted across the Judica 3D seismic survey. Grids of the seismic time horizons were converted to depth using velocities derived from well control, then imported and contoured in Petra, a Geoplus mapping application. Earlier subsurface and post 3D Mississippi structure maps are shown in Figures 6A and 6B for comparison. Figure 7 is a Mississippi structure of the greater Judica area. The major features were recognized by the earlier subsurface mapping work, however the finer scale karst related features are evident in the post-3D work.
Figure 6A. Judica study area, pre-3D structure map.
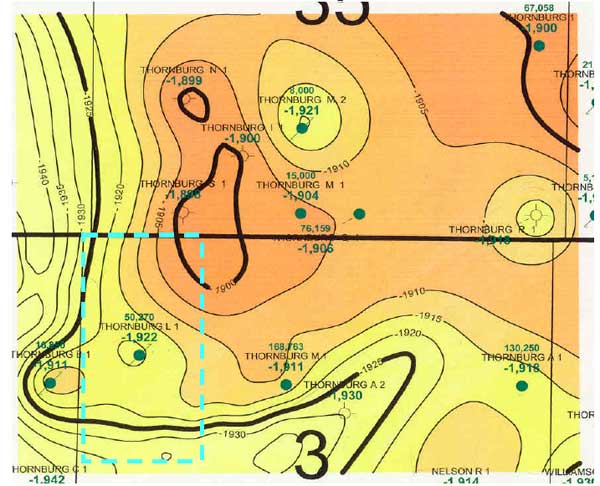
Figure 6B. Judica study area, post-3D structure map.

Figure 7. Structure map of the larger research area. A larger version of this figure is available.
In the earlier work it was recognized that compartmentalization within the Mississippian dolomite reservoir was due to reservoir heterogeneity, karst processes, and actual structure. The new data does not change these earlier conclusions, however the data does provide evidence that compartmentalization due to karst is more pervasive than earlier thought. The effect is to reduce the size of the prospective compartment within the lease boundaries of the operator (blue dashed outline in Figures 6-8, 10-11, 13-21, and 24).
3-D seismic attributes provide additional insight into reservoir properties. For instance, a decrease in porosity will increase both seismic velocity and density and could have an observable affect on seismic amplitudes. A crossplot (Figure 8A) of porosity-height (phi-h) of the Judica zone from well data versus amplitude of the Base Warsaw LS horizon (the trough immediately below the peak corresponding to the top Mississippian) extracted from the 3D seismic survey at the well locations shows an empirical relationship between seismic amplitude and phi-h. A model of the seismic response to variation of porosity within the Judica zone, based on sonic information from the Thornburg 1-3 well, is shown in Figure 9. This model shows that the magnitude of the seismic amplitude extracted along the Base Warsaw LS horizon is predicted to increase by approximately 60% as average porosity in the Judica zone decreases from 25% to 5% (or as phi-h decreases from 6 to 1.2 porosity-ft), validating the empirical relationship. Base Warsaw LS amplitude is mapped in Figure 10A while Figure 10B shows the Mississippian structure map, with warmer colors representing lower amplitude (and therefore presumed areas of higher porosity-feet). Warmer colors on the amplitude map are associated with producing areas and are not necessarily correlated with structure. A very strong structural high in the south half of Section 35, immediately north of the target area, is non productive due to lack of porosity in the reservoir interval. The cooler colors in the amplitude map over this area may be related to this lack of porosity in the upper Mississippian. The base Warsaw LS amplitude map in conjunction with the structural map is able to discriminate between the dry and productive wells in the greater Judica area.
Figure 8A. Porosity-height vs. seismic amplitude.
Figure 8B. Seismic amplitude of the base of the Warsaw Limestone.

Figure 9. Modeled variation in amplitude of the base of the Warsaw Limestone horizon due to increase in porosity of Judica zone. A larger version of this figure is available.
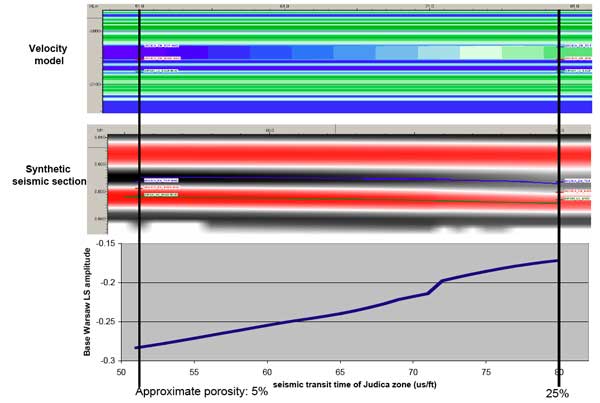
Figure 10A. Seismic amplitude of the base of the Warsaw Limestone.
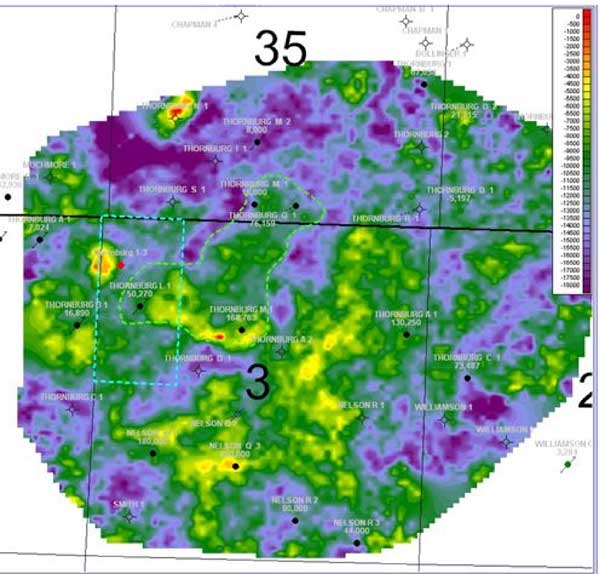
Figure 10B. Post 3D structure map.
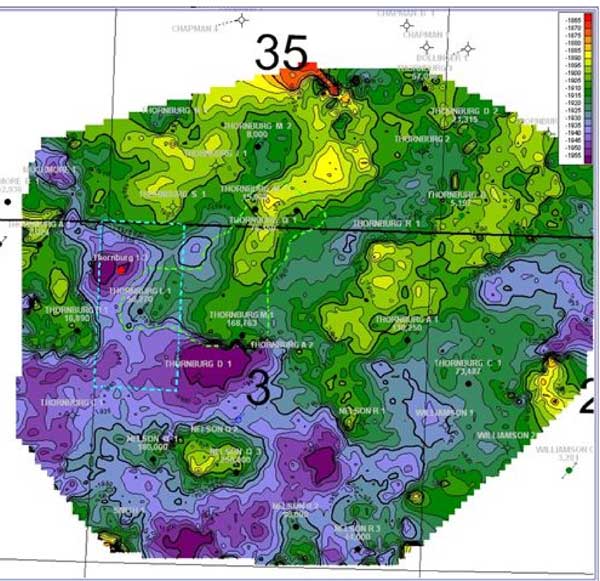
Figure 11 shows the 3D volume based on the revised reservoir geomodel developed by incorporating the 3D seismic analysis. One of the limiting factors to Judica simulation has been the limited water production data. Only the current water-oil-ratio (WOR) is available at TM1s while WORs were recorded at TQ1 over a period of 10 years. Figure 12B shows the plot of WOR against cumulative oil for TM1s and TQ1, while Figure 12C plots the WOR against time for TQ1. Figures 13B and 13D show the history match on cumulative oil production and daily fluid rates for well TM1s. Figure 13C shows the history match obtained for this well using the pre-3D geo-model. Figures 14 to 16 show similar history matches for other wells within the simulation study area. In most cases, the post-3D model enables better history matches with well production. Figure 17 plots the simulator calculated average reservoir pressure with time, and indicates that the current reservoir pressure is close to 470 psi which is close to what the incomplete shut-in fluid column data from TM1s seem to indicate. Not having any alternate and better source of current reservoir pressure data, MDC advised on conducting incremental recovery from horizontal infills based on a current assumed reservoir pressure of 500 psi.
Figure 11. 3D model input to reservoir simulation.
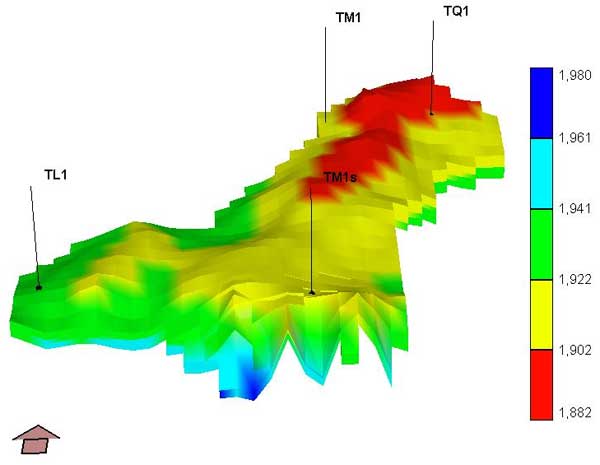
Figure 12A. Judica study area, post-3D structure map.
Figure 12B. Water-oil-ratio vs. cumulative oil for Thornburg Q 1 (triangle) and Thornburg M 1 (sect. 3) (square).
Figure 12C. Water-oil-ratio vs. time for Thornburg Q 1.
Figure 13A. Judica study area, post-3D structure map.
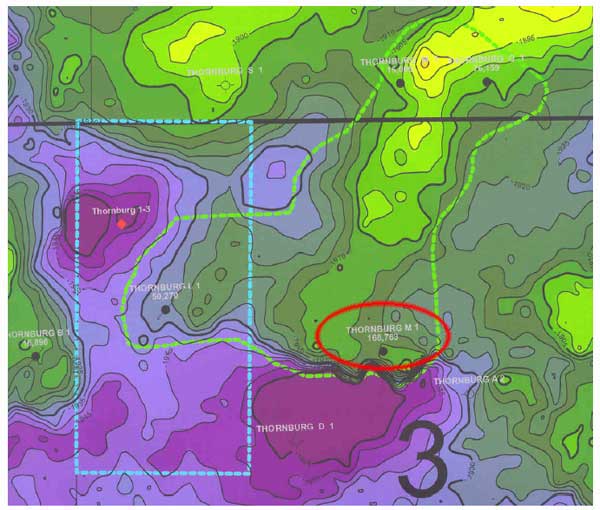
Figure 13B. Cumulative oil for Thornburg M 1 (sect. 3).
Figure 13C. Simulation match for water and oil rates for Thornburg M 1 (sect. 3) before the 3D seismic survey.
Figure 13D. Closer water-history match when water-oil-ratio vs. cumulative oil is used to estimate water production.
Figure 14A. Judica study area, post-3D structure map.
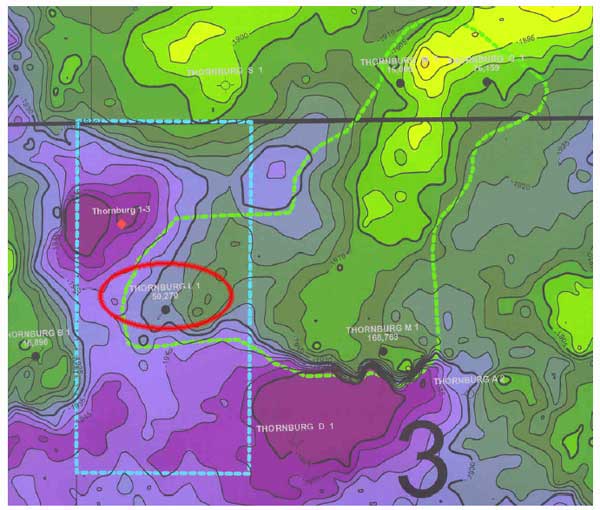
Figure 14B. Cumulative oil for Thornburg L 1.
Figure 14C. Simulation match for water and oil rates for Thornburg L 1 before the 3D seismic survey.
Figure 14D. Final model.
Figure 15A. Judica study area, post-3D structure map.
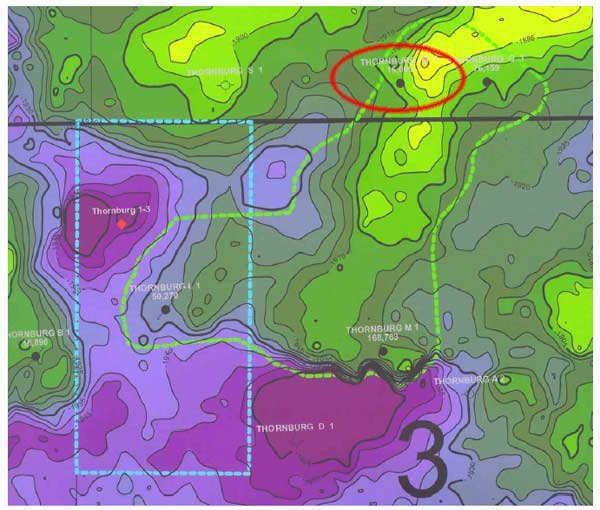
Figure 15B. Cumulative oil for Thornburg M 1 (sect. 35).
Figure 15C. Simulation match for water and oil rates for Thornburg M 1 (sect 35) before the 3D seismic survey.
Figure 15D. Final model.
Figure 16A. Judica study area, post-3D structure map.
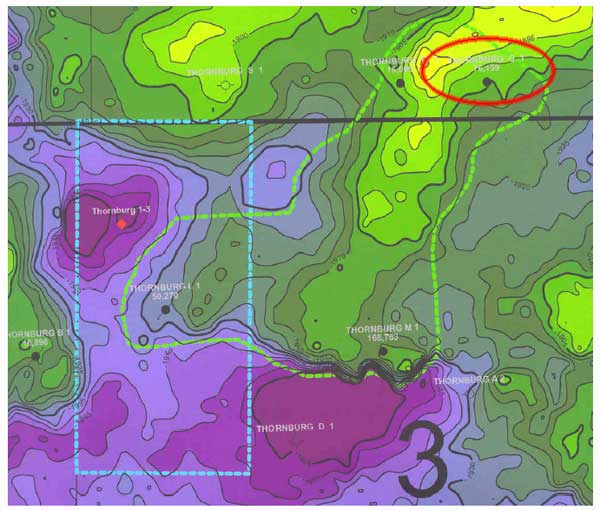
Figure 16B. Cumulative oil for Thornburg Q 1.
Figure 16C. Simulation match for water and oil rates for Thornburg Q 1 before the 3D seismic survey.
Figure 16D. Final model.
Figure 17. Average reservoir pressure decline. Current reservoir pressure of 470 is close to estimated pressure from shut-in test for Thornburg M 1 (section 3), which is 500 psi.
Figure 18A shows the distribution of calculated residual reserves (oil saturation feet) in the Judica study area. Figures 18C and 18D compare the simulated residual potential using the pre- and post-3D models, and it clearly indicates a decrease in the oil saturation-feet in the post-3D model. Figure 19C shows the estimated recovery from an infill horizontal trajectory (shown in Figure 19B). This is a 1000 feet well placed in L5 zone, and the simulator predicts a cumulative recovery of 11.5 MBO after 5 years. In the event of actual placement of a horizontal well, it is anticipated that it will perforated the thinner and thus less productive L3 zone as well. Figure 20 shows the simulator-calculated production output from the same horizontal infill assuming that it is perforated both in L3 and L5 along its lateral length of 1000 feet. The additional completion in L3 results in a marginal increase in cumulative production to 14 MBO over a period of 5 years.
Figure 18A. 3D model input to reservoir simulation [same as fig. 11].
Figure 18B. Judica study area, post-3D structure map [same as fig. 6b].
Figure 18C. Pre-3D--evaluate potential of different trajectories, January 1, 2003, remaining reserves (oil-ft) [same as fig. 2a].
Figure 18D. Post 3D--remaining reserves (oil-ft)
Figure 19a. Judica study area, post-3D structure map [same as fig. 6b].
Figure 19B. Post 3D--remaining reserves (oil-ft)
Figure 19C. Cumulative oil and water model with horizontal well. Well diameter = 6 inches, skin = 0.0, Lateral placed in L5 (1000 ft). Cumulative oil = 11.5 MBO after 5 years. Pwf = 50 psi.
Figure 19D. 3D model input to reservoir simulation with wells labeled.
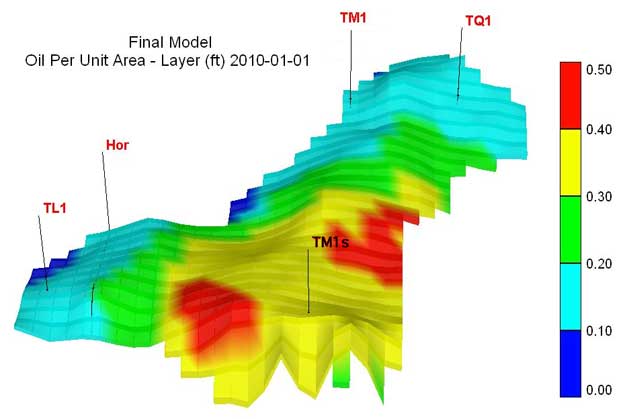
Figure 20. Potential of Horizontal Infill--L5 and L3. Well diameter = 6 inches. Skin = 0.0. Lateral placed in L3 and L5. Cumulative oil = 14 MBO after 5 years. Pwf = 60 psi. Average reservoir pressure @ Jan 2010 = 297 psi. Lateral length = 1000 ft.
One of the major drivers affecting productive potential of the infill horizontal well is the current reservoir pressure and hence the available drawdown. However, lacking a definite knowledge about the current reservoir pressure in the immediate vicinity of TM1s, area of reach for a lateral out of the already drilled pilot, the analytical aquifer in the simulator was strengthened so that the calculated average pressure increased to about 550 psi (Figure 21). Figures 22A to 22D show that the strengthening of the aquifer did not result in major discrepancies in the history matches achieved for the individual wells in the study area. Figure 23 shows the simulator calculated cumulative production from a horizontal infill trajectory (Figure 19B) and completed in both L3 and L5 zones when the underlying aquifer is assumed to be stronger than modeled in the earlier runs. The stronger aquifer simply nudged the cumulative production from the infill to 15.1 MBO.
Figure 21. Aquifer Strengthening. Average Reservoir Pressure = 550 psi (Jan 2005).
Figure 22A. History Match, Stronger Aquifer--TL1.
Figure 22B. History Match, Stronger Aquifer--TM1s.

Figure 22C. History Match, Stronger Aquifer--TM1.
Figure 22D. History Match, Stronger Aquifer--TQ1.
Figure 23. Potential of Horizontal Infill, stronger aquifer. Well diam = 6 inches. Skin = 0.0. Lateral placed in L3 and L5 (1000 ft). Cum oil = 15.1 MBO after 5 years. Pwf = 60 psi. Avg. res. Pr. = 361 psi (Jan 2010).
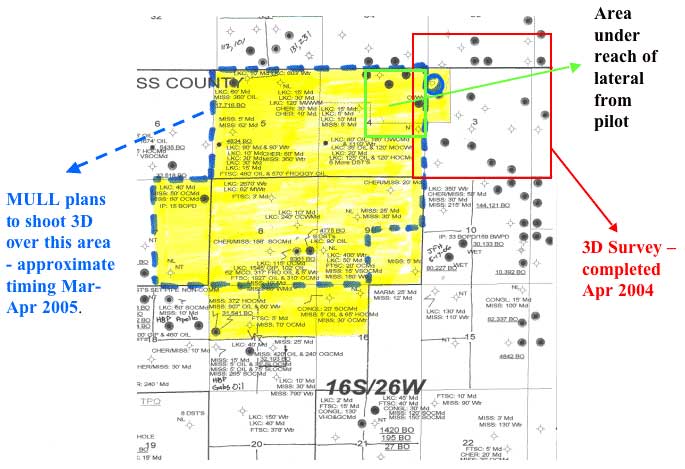
With low calculated recoveries from the possible horizontal trajectory, MDC evinced interest in studying the effects of drilling a longer lateral (1900 feet long) which extends beyond their property lines. Figure 24A shows the well trajectory while Figure 24C plots the expected cumulative recovery after 5 years of production to be at 28.6 MBO. MDC estimates of current drilling expenses are noted in Figure 25, and given these economics, estimated recoveries, oil prices, and risks and benefits associated with other available targets within MDC's portfolio, MDC decided against drilling a lateral out of the pilot well in Judica study area. MDC has acquired additional acerage (area colored in yellow in Figure 26) adjacent and to the west of Judica field and they plan to shoot 3D survey over area marked by broken blue lines in Figure 26. KGS will apply interpretation techniques, developed in this study, to map reservoir compartments and to discriminate between dry and productive wells on this to be acquired 3D data to identify resource pockets that MDC may consider exploring. Confirmation of potential of these reserve compartments will validate techniques developed in this project to identify candidates for horizontal infilling in mature Mid-continental Mississippian fields.
Figure 24A. Potential of Horizontal Infill--L5, Stronger Aquifer, Extend into Neighboring Lease. Cum oil = 28.6 MBO after 5 years. Well diam = 6 inches. Skin = 0.0. Lateral placed in L5 (1900 ft). Pwf = 60 psi.
Figure 24B. 3D model input to reservoir simulation with wells labeled.
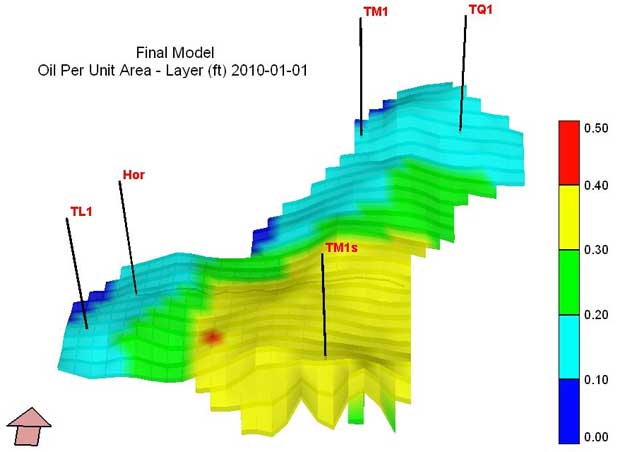
Figure 24C. Cumulative oil and water model with horizontal well.
Figure 25. Approximate drilling costs in Kansas.
| Vertical well dry | $105,000 |
| Vertical well completed | $260,000 |
| Horizontal well dry | $350,000 |
| Horizontal well completed | $500,000 |
Figure 26. Future plans.
Kansas Geological Survey, Energy Research
Placed online June 29, 2005
Comments to webadmin@kgs.ku.edu
The URL for this page is HTTP://www.kgs.ku.edu/PRS/publication/2004/OFR04_65/index.html