 |
|
Kansas Geological Survey Open-file Report 2003-31 |
Capillary Pressure
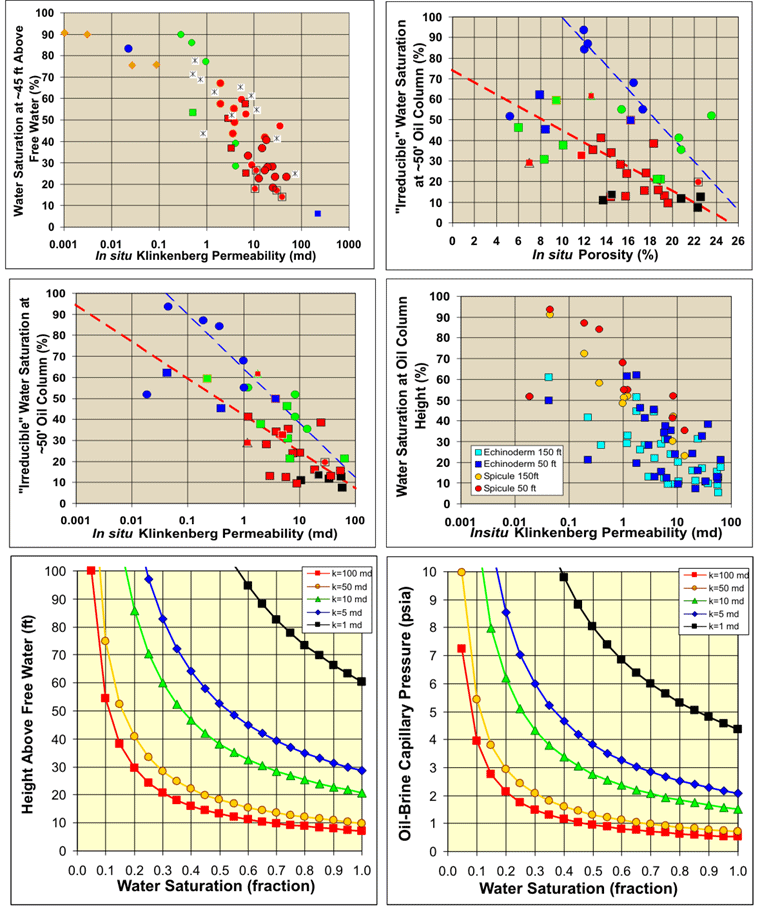
Fluid saturations in the Wellington West field were determined using electrical wireline logs and capillary pressure relations. Capillary pressure curves show a relationship of increasing threshold entry pressure with decreasing permeability that is consistent with decreasing pore throat size with decreasing permeability. Capillary pressure properties of Mississippian carbonates differ between lithofacies. Structural closure in many Mississippian Kansas fields is less than 60 feet limiting oil column heights and necessitating understanding of the exact capillary pressure relationships.
Air-brine capillary pressure measurements indicate that water saturations
at 45-50 ft (Sw45,Sw50) above free water increase with decreasing porosity
and permeability. Because of the close correlation between lithofacies and
k-![]() , Sw also increase
with decreasing grain/mold size from packstone to mudstone. Sw45 in Schaben
can be predicted within + 14% (saturation %) using: Sw45(%) = -20*log kinsitu
+ 61. Within the echinoderm-rich facies in Ness Field, Sw50 is correlated
with
, Sw also increase
with decreasing grain/mold size from packstone to mudstone. Sw45 in Schaben
can be predicted within + 14% (saturation %) using: Sw45(%) = -20*log kinsitu
+ 61. Within the echinoderm-rich facies in Ness Field, Sw50 is correlated
with ![]() and k: Sw50(%)
= -3.21
and k: Sw50(%)
= -3.21 ![]() insitu + 87.6l
(SE=+19%) and Sw50(%) = -17.5 log10 kinsitu + 42.1 for Echinoderm-rich
facies (SE=+8.7).
insitu + 87.6l
(SE=+19%) and Sw50(%) = -17.5 log10 kinsitu + 42.1 for Echinoderm-rich
facies (SE=+8.7).
For cores near Wellington West the following relations predicts Sw60:
Sw60(%) = -28.8 log10 kinsitu + 62.6.
Generalized Capillary Pressure Curves
To provide capillary pressure curves for the reservoir simulation it was
necessary to develop generalized curves that represented the specific permeabilities
that might be assigned to a gridcell. Equations to construct generalized capillary
pressure curves were constructed based on the relationships evident from the
entry pressures and curve shapes in the air-mercury capillary pressure curves,
and from the saturations evident in the air-brine capillary pressure analysis.
The relationships between increasing entry pressure, “irreducible”
wetting phase saturation, and the capillary curve curvature (reflecting increasing
pore throat size heterogeneity) with decreasing permeability were utilized
to develop equations that would predict the capillary pressure curve using
permeability as the independent variable.
Entry pressure, or the first pressure at which wetting phase desaturation
begins and similar to R35, exhibits a strong correlation with permeability
and can be predicted using:
Pcowentry = 4.374 ki-0.4625
Where Pcowentry is the oil-water entry pressure and ki is the in situ permeability. Using the above term and a function to model capillary pressure curve shape synthetic capillary pressure curves could be created for any permeability.

|
|
e-mail : webadmin@kgs.ku.edu
Last updated July 2003
http://www.kgs.ku.edu/PRS/publication/2003/ofr2003-31/P2-03.html
