Kansas Geological Survey, Open-file Report 2001-67
by
John H. Doveton
KGS Open File Report 2001-67
Porosity in sandstones generally takes the form of intergranular pores: the pore space between the grains of quartz and other detrital minerals. By contrast, porosity in carbonate rocks can take a wide variety of forms and, while geologists classify carbonate pore types in terms of genesis, petrophysicists use a simple subdivision based on morphology: between (1) interparticle: intergranular and intercrystalline porosity; (2) fracture porosity; and (3) vug: either moldic porosity from the dissolution of grains or vugs that are larger than the grains.
The most widely used form of the Archie equation for both limestones and dolomites is the basic:
F = 1 / Φ2
that relates formation factor, F, with porosity (Φ) and the cementation exponent (m) with a value of two, which is a good choice for carbonate rocks whose porosity is dominantly intercrystalline as demonstrated by numerous core measurements and log evaluations. Dullien (1992) showed that for a rock framework with uncorrelated pore and solid components, the expected value of m should be 2. The uncorrelated pore space will contain both electrically connected pore space and "dead end" pore space that is by-passed by electrical flow. If there is an increase in unconnected pore space, then there will be an increase in m and this effect is highly marked in oomoldic reservoirs in both Kansas and the Middle East.
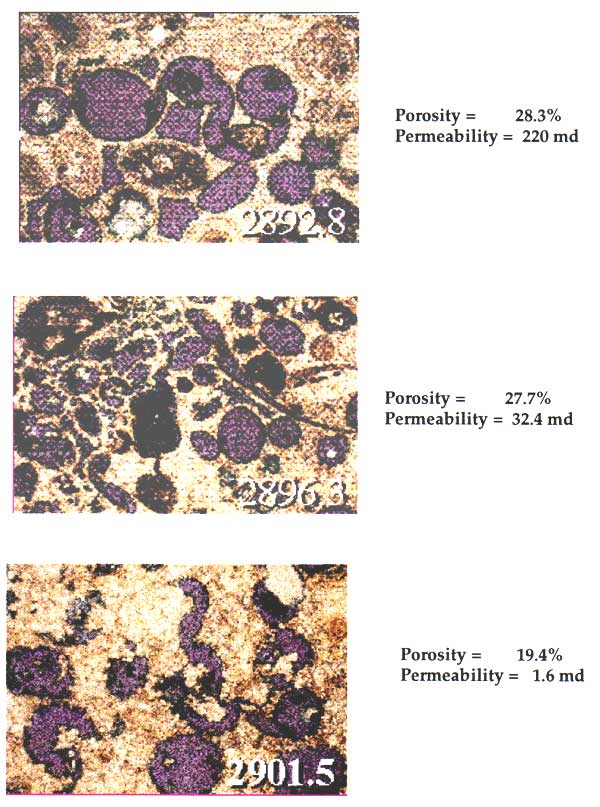
Pennsylvanian limestones commonly contain oomoldic porosity (Figure 1) in south-central Kansas and can cause major problems in conventional log analysis because of the radical difference in properties between the large oomolds and the fine interparticle porosity. These oomoldic grainstones commonly have high pore volumes and are readily distinguished from low-porosity wackestones in these sequences. While the neutron and density logs are sensitive to all pore sizes, the sonic log porosity does not reflect all the oomoldic pores. The distinction is commercially important because much of the oomolds are poorly connected vuggy pores that cause an increase in resistivity, such that water-saturated oomoldic zones can look to be promising hydrocarbon shows and be confused with real oomoldic oil and gas producers. This has been enough of a problem to encourage the specific use of EPT (electromagnetic propagation tool) logging in some wells.
Figure 1--Thin-section examples of Lansing "C" Zone oolitic grainstone lithofacies showing oomoldic pores.
Over the years, many petrophysical models, ranging from theoretical and complex to simple and pragmatic have been proposed as practical solutions to the log analysis of oomoldic reservoir units. This report does not propose a radical new solution, but uses newly available core and log data from the Lansing oomoldic limestones of Kansas to test simple log analysis models that can be applied to oomoldic reservoirs across the State. The data used in this report was gathered by Alan P. Byrnes, Martin K. Dubois and others as part of the "Field Demonstration of Carbon Dioxide Miscible Flooding in the Lansing-Kansas City Formation, Central Kansas" project, funded by the federal Department of Energy.
Measurements from core taken from the Lansing-Kansas City "C" and "G" Zones in Murfin Carter-Colliver CO2 #1 were used to examine alternative formulations of the Archie equation. A crossplot of formation factor and porosity (Figure 2) demonstrates the inadequacy of the standard Archie equation, F = 1 / Φ2 as a useful descriptor. Its use in log analysis would cause anomalously low water saturations to be calculated. The application of the generalized Archie equation (variable a) was made by regression analysis to the measurements and shows a broad fit, matched with the Archie equation of:
F = 9.47 / Φ1.36
The equation has statistical utilty, but is not a functional petrophysical relationship because its extrapolation leads to impossible values at high porosities.
Figure 2--Formation factor-porosity plot of core measurements from the Carter-Coliver #1 well matched with three models of Archie equation predictions.
As an alternative Archie equation model, the form F = 1 / Φb+cΦ can be used, where m is a variable determined by the porosity, and so varies with depth. The advantages of this equation form over the generalized form of the Archie equation, F = 1 / Φm are that it honors a functional petrophysical relationship, and the value of m at any porosity value can be solved immediately and checked against core data. Its disadvantages appear to be that the equation plots as a curve on the formation factor-porosity crossplot and that it is less easy to solve than the simple regression of the standard Archie equation. The terms b and c of the "variable m" Archie equation were computed as a minimum sums-of-squares procedure using a spreadsheet solver utility as values of b = 1.9 and c= 4.35: F = 1 / Φ1.9+4.35Φ
Examination of the trace of this function on the formation factor-porosity crossplot shows an extremely close match with the general Archie equation within the range of the measurement data. For the purposes of predicting formation factor from porosity from logs, they are indistinguishable.
In log analysis of oomoldic limestones in the Lansing-Kansas City of other Kansas wells, either the "generalized" or "variable m" solutions of the Archie equation reported here can be used as functions that have been calibrated to Kansas core data. The scatter of the data about these two functions is not simply a matter of measurement error, but reflects the natural variability of proportions of total pore volume between oomolds and interparticle pores. These predictive equations should therefore be considered as first order, since their predictions are determined by the total porosity. Improvement by a second order predictive model would incorporate information regarding the partition of the total porosity between oomolds and fine pores such as may be given by the incorporation of sonic porosities.
Watfa and Nurmi (1987) proposed some simple expansions of the Archie equation that incorporate fracture porosity and vug porosity. They reported that application of these equafions gave estimates of water saturations in a variety of Middle Eastern carbonate reservoirs that were an improvement on the simple Archie equafion with cementation exponent, m of 2.
If the vugs are not connected, then electrical current does not flow through them and they are non-conducfive voids. For this model, the equafion is:
Φm = (Φ - Φnc)2
where Φnc is the vug porosity. When rearranged in terms of the cementation exponent, the equation is:
m = (2 log(Φ - Φnc)) / log(Φ)
which has the same structural form as the Nugent equation that will be discussed later in conjunction with the use of sonic log porosities.
Oomoldic pores behave as microvugs in the sense that they are electrically poorly connected, so that the Watfa-Nurmi equation can be used to estimate the subdivision of the total pore space measured in core between non-connected oomolds and connected interparticle porosity. Contours of non-connected porosity from the Watfa-Nurmi model can also be plotted directly on the formation factor-porosity crossplot (Figure 3). A crossplot of connected porosity predicted by the Watfa-Nurmi equafion and total porosity measured from core (Figure 4) shows a ragged positive trend between the two. A trend fitted to these data suggests that overall there is an approximately equal partition between the two pore types, although non-connected pores are more dominant at higher porosities.
Figure 3--Watfa-Nurmi equation predictions of non-connected porosity plotted as contours on a formation factor-porosity plot of core measurements from the Carter-Coliver #1 well.
Figure 4--Crossplot of total core porosity versus Watfa-Nurmi equation predictions of connected porosity calculated from the formation factor from core measurements in the Carter-Coliver #1 well.
The neutron and density logs are responses to pores of all sizes. However, field observation over many years has shown that the sonic log is a measure of interparticle (intergranular and intercrystalline) porosity but is largely insensitive to either fractures or vugs. This discrimination can be explained largely by the way that the sonic tool measures transit time by recording the first arrival waveform which often corresponds to a route in the borehole wall free of fractures or vugs.
When sonic porosities are compared with neutron and density porosities, the total porosity can be subdivided between "primary porosity" (interparticle porosity) recorded by the sonic log and "secondary porosity" (vugs and/or fractures) computed as the difference between the sonic porosity and the neutron and/or density porosity. Typically, moderate values in secondary porosity are caused by vugs, because fracture porosity does not usually exceed 1 to 2% by volume. The total porosity can be estimated from the average of the neutron and density porosities:
Φt = (Φn + Φd) / 2
and is distinctly higher than the sonic porosity in oomoldic zones because of significant "secondary" porosity.
Because an aim of this report is to use the sonic log as an aid to improve estimates of the cementation exponent, m, the question at hand is the nature of the relationship between the "primary" porosity of the sonic log and the connected porosity modeled by the Watfa-Nurmi equation. A crossplot of depth-matched porosity from the sonic log and core formation factor Watfa-Nurmi estimates of connected porosity is shown in Figure 5, with respect to the measurement of total porosity measured from core. A consistent pattern is observed of a higher values of electrically-connected pore volume when compared with the sonic porosity measure. However, notice that the differentiation is minor at the low porosity range but increases at higher porosities.
Figure 5--Crossplot of total core porosity versus Watfa-Nurmi equation predictions of connected porosity calculated from the formation factor from core measurements and sonic log porosity in the Lansing "C" Zone in the Carter-Coliver #1 well.
This characteristic is common to other petrophysical studies of oomoldic reservoirs although expressed in a different way. So, for example, the Nugent equation (Nugent, 1984) is often used to resolve water saturation in oomoldic zones, by computing an apparent "m" value for each zone and then applying the Archie equation for water saturation:
m = 2log(Φs) / log(Φt)
When rewritten, the Nugent equation becomes:
Φmt = Φ2s
which is a model that would equate all oomoldic porosity with totally water-saturated, but non-connected vugs and so is a reformulation of the Watfa-Nurmi equation, with substitution of the sonic porosity for non-connected porosity. However, petrophysicists have noted that the Nugent equation value for m is either reasonable or is biassed as an underestimate, i.e.
m ≥ 2log(Φs) / log(Φt)
The data of this report suggests that the estimate of the cementation exponent may be good at lower porosities, but that estimates are significantly lower than their true vales at higher porosities.
So, if the sonic log porosity tends to be an overestimate of the connected porosity, a transform equation should be developed to predict connected porosity from the sonic porosity that honors the following constraints:
In the development of the equation, it could be considered that the sonic porosity resulted in either an overestimate of the connected pore volume or an underestimate of the non-connected pore volume, because the effects are complementary. The modification of the conventional sonic porosity estimate of the non-connected porosity:
Φnc = (Φt - Φs)
to
Φnc = (Φt - Φs) / (1 - Φt)
both honored the constraints listed above, and provided a good fit to Watfa-Nurmi equation estimates of partition between connected and non-connected pores in the Lansing "C" Zone of the Carter-Colliver #1 well. The comparison is shown in Figure 6, which also demonstrates the consistently higher values of sonic porosity as related to core-calculated connected porosity, and the good match between total porosity estimated from the neutron and density logs and the total porosity measured on core samples.
Figure 6--Profile of core total porosity (black circles), neutron-density log total porosity (blue bold curve), sonic log porosity (blue fine curve), Watfa-Nurmi core estimates of connected porosity( green diamonds), and WNN log prediction of connected porosity (green bold curve) in the Lansing "C" Zone in the Carter-Coliver #1 well.
Acceptance of the modified equation to estimate non-connected porosity leads to a reformulation of the Nugent equation to reflect its "calibration" with estimates of connected/non-connected porosity generated by the Watfa-Nurmi equation, which are themselves determined by cementation exponents measured from core samples. To clarify, the Nugent equation equates the sonic porosity with the connected porosity, or: Φc = Φs
In the modified Nugent model,
Φnc = (Φt - Φs) / (1 - Φt)
and so
Φc = (Φs - Φ2t) / (1 - Φt)
Then,
m = 2log(Φc) / log(Φt)
where the estimate of connected porosity is given by sonic porosity transform, rather than the raw sonic porosity value.
The four alternative models used to develop Archie equations for log analysis were assessd in their ability to match core measurements by comparison of their estimates of cementation exponents with core measurements from the Lansing "C" Zone in the Carter-Colliver #1 well (Figure 7).
Figure 7--Comparison of Archie cementation exponent, m, with predictions made by generalized Archie quation (a-m), an archie equation with m determined by porosity (mphi), the Nugent equation (nugent), and the Watfa-Nurmi-Nugent (wnn) in the Lansing "C" Zone in the Carter-Coliver #1 well.
The four equations can be subdivided into two types:
The two equations that use only total porosity are the generalized Archie (a-m) and the variable-m (mphi) forms. The two equations yield almost identical results, so that either could be used, although the variable-m form is preferred, both because it is more reasonable as a petrophysical function and allows cementation exponents to be estimated immediately at any depth in a logged sequence. The overall fit between these estimates and the core measurements is to be expected, because the equations were based on fits to the core data. The use of the equation in other wells can be anticipated to be a good first order model, provided that the partition of the pore volume between oomoldic and interparticle pores is similar to the Lansing "C" and "G" zones in the cored well. If the volumetric partition is variable between oomoldic grainstone reservoirs, then another log measurement variable should be used in evaluation and this is provided by porosities estimated from the sonic log.
The two Archie equations that incorporate the sonic log are the Nugent equation and the modified Nugent equation introduced in this report. Examination of cementation exponents predicted by the Nugent equation can be seen as consistent underestimators of the cementation exponent at higher values, although quite acceptable in the low range. Use of the Nugent model will lead to underestimation of water saturation, although the results would be great improvement on a classic Archie equation with a cementation exponent value of two. The modified-Nugent equation provides better estimates at the high range of cementation exponent. Because these values are commonly associated with high-porosity zones in oomoldic reservoirs, the improved estimates would be especially significant in reservoir evaluation.
Dullien, F.A.L., 1992, Porous Media: Fluid Transport and Pore Structure. Second Edition: Academic Press, San Diego, 574 pp.
Nugent, W.H., 1984, Letters to the Editor: The Log Analyst, v. 25, no. 2, p. 2-3.
Watfa, M., and Nurmi, R., 1987, Calculation of saturation, secondary porosity and producibility in complex Middle East carbonate reservoirs, paper CC; in, 28th annual logging symposium transactions: Society of Professional Well Log Analysts, 24 p.
Kansas Geological Survey, Energy Research
Placed on web Sept. 13, 2007; originally released in 2001
Comments to webadmin@kgs.ku.edu
The URL for this page is http://www.kgs.ku.edu/PRS/publication/2001/OFR01_67/index.html