Kansas Geological Survey, Open-file Report 2000-52
by
Ricardo A. Olea and Willard J. "Bill" Guy
KGS Open File Report 2000-52
November 2000
CORRELATOR is a computer program to assist in the correlation of wireline logs. Application of the program to logs partially penetrating the Mississippian limestone reservoir in the Schaben field, confirms the advantages of the software to describe the geology of the subsurface, relative to other packages, such as the Stratigraphic Geocellular Modeling by Stratamodel.
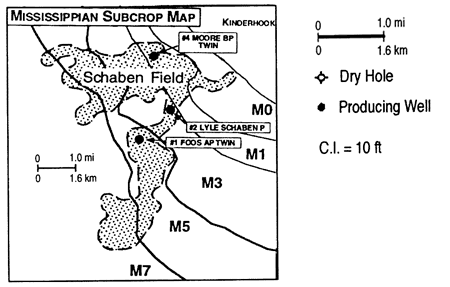
The Schaben field, Ness county, has been the subject of extensive studies by the KGS Petroleum Research Section. The most important findings were published recently in the American Association of Petroleum Geologists Bulletin (Montgomery et al., 2000).
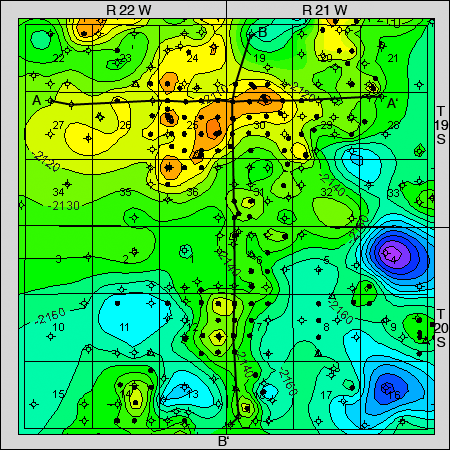
Figure 1--Index map displaying depth to the top of the Mississippian. The heavy, solid lines show the location of two cross-sections selected to characterize the field (From Montgomery et al., 2000).
In this paper, it called our attention the poor readability of Figure 6--reproduced here as Figure 2--used to provide a general understanding of the stratigraphic relationships in the field. The pair of cross-sections that appear in that illustration were prepared using the Stratigraphic Geocellular Modeling package by Stratamodel
Figure 2--(A) West-east and (B) north-south structural cross-sections, Schaben field, showing units and oil/water contacts within the field (From Montgomery et al., 2000)
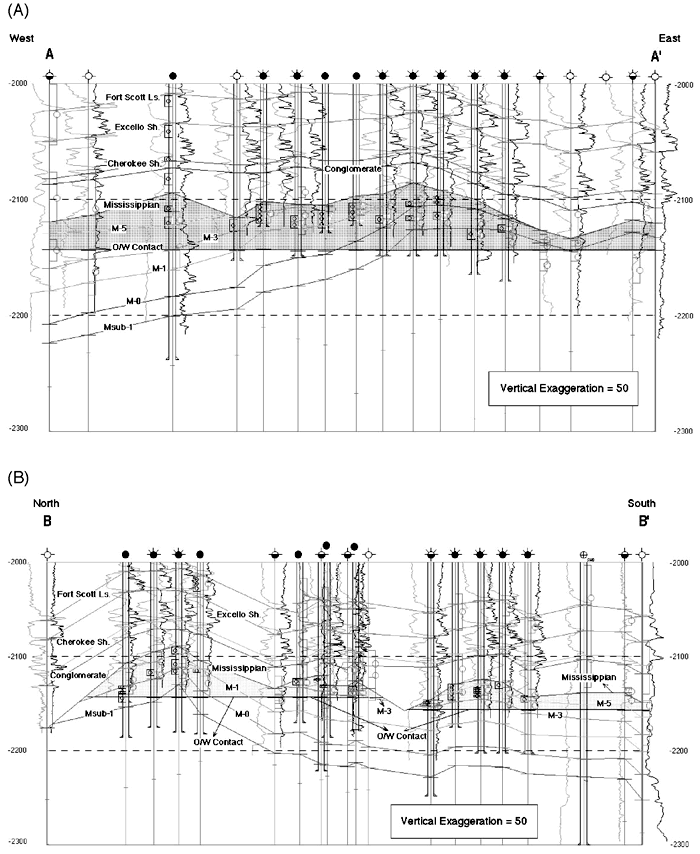
It is the objective of our report to demonstrate that the software CORRELATOR developed in-house offers a far more satisfactory alternative for the specific purpose of preparing cross-sections based upon the correlation of wireline logs, especially now that the Stratamodel unit has been dismantled.
Similar to manual interpretation, the search for correlations with the assistance of the computer program CORRELATOR (Olea 1988) operates on pairs of sequences of measurements, the wireline logs λ, typically along vertical cores or wells. For easy reference, the well to the left of a display is called "reference well" and the one to the right, "matching well." CORRELATOR uses up to a pair of logs per well generically called shale log and correlation log.
Given any depth zi in the reference well, CORRELATOR automatically selects as the correlating elevation the level zkbest in the matching well that maximizes the weighted correlation coefficient. If the logs are sampled at regular intervals, the weighted correlation coefficient ω1,2,3,4(i,k;n) is defined as the product of the normalized shale similarity coefficient α1,3(i,k;n) for the shale logs and the Pearsonian correlation coefficient r2,4(i,k;n) for the correlation logs:
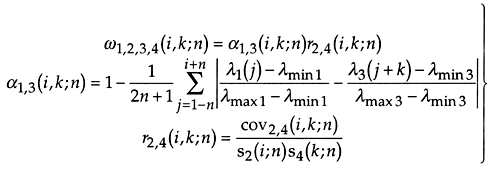
The normalized shale similarity, the covariance cov2,4(i,k;n), and the standard deviations s2(i;n) and s4(k;n), are calculated over correlation intervals of 2n + 1 readings each. The correlation coefficient is sensitive to the matching of the signatures of the correlation logs and the other coefficient is sensitive to the discrepancy in the relative proportions of shale as given by the shale logs. The maximization of the weighted correlation coefficient comprises an additional parameter, the interval kmin ≤ k ≤ kmax of search for the best match. The automatic maximization of the weighted correlation coefficient always yields one largest value ω1,2,3,4max(i,kbest;n) for every elevation zi in the reference well. However, not all correlations are saved. In a first step, the system discards all weak correlations below a threshold. In a final stage an expert system checks for global consistency and interactively suggests to the user the discarding of crossing or inconsistent correlations.
By combining the correlations obtained from several pairs of wells, CORRELATOR is capable of displaying cross-sections showing top and bottoms of lithostratigraphic units, correlations present in all wells for the same lithostratigraphic level, and cross-sections showing the spatial variation in the amount of shale. By solving the three-point problem--determining the dip and azimuth of every plane defined by lithostratigraphically equivalent points in three wells located in the vertices of a triangle, preferably close to equilateral--the program is also able to generate dips representing the regional inclination of the strata. Such dip plots are extremely useful for detecting faults and unconformities and summarizing the geological evolution of any portion of a basin through geologic time.
Rendition of CORRELATOR results can be in color or black and shades of gray. Intervals that are white represent no correlation between wells. For the shale variation cross-sections, the hotter the color, the cleaner the rock. Although there is flexility in the selection of the scale, the choice consistently used here is:
0-20% shale: red
20-40% shale: orange
40-60% shale: yellow
60-100% shale: green
Logs along the two cross-sections in Figure 1 have been digitized at a regular interval of 2 readings per foot. They are listed in Tables 1 and 2 and are stored at the Internet data base maintained by the Kansas Geological Survey:
http://www.kgs.ku.edu/Magellan/Logs/index.html
These wells have at least a gamma and a resistivity log from at least the Heebner to the Mississippian. With the exception of the Pickrell 2 Borger well drilled after the preparation of the Montgomery et al. (2000) study, the wells in this report are the same as those in their paper.
Table 1--Wells in the west-east cross-section
| Well | Location |
|---|---|
| 1. Texas Energies 1-27 Foos | NE NW sec 27 T19S R22W |
| 2. Woolsey 1 Glaves | SE NW NE sec 27 T19S R22W |
| 3. Hellar 1 Ford | NE NW sec 26 T19S R22W |
| 4. Sinclair 2 Lent | App. NE NE sec 26 T19S R22W |
| 5. Holly 4 Borger | NW NW sec 25 T19S R22W |
| 6. Cities Service Oil Co. 2A Borger | App NE NW sec 25 T19S R22W |
| 7. Petroleum Management 2 Borger | NW NE sec 25 T19S R22W |
| 8. Pickrell 3 Borger | SW NE NE sec 25 T19S R22W |
| 9. Cities Service Oil Co. 2D Moore | 150'SW NW NW sec 30 T19S R21W |
| 10. Cities Service Oil Co. 3D Moore | 150'SW NE NW sec 30 T19S R21W |
| 11. Cities Service Oil Co. 6B Moore | App. NE NE sec 30 T19S R21W |
| 12. Cities Service Oil Co. 4B Moore | App. NW NE sec 30 T19S R21W |
| 13. Cities Service Oil Co. 4A Rein | App. NW NW sec 29 T19S R21W |
| 14. Pickrell 1C Rein | NW NE sec 29 T19S R21W |
| 15. Vincent 1 Rein | N2 NW NW sec 28 T19S R21W |
| 16. Petroventures 1 Rein | NW NE NW sec 28 T19S R21W |
Table 2--Wells in the north-south cross-section.
| Well | Location |
|---|---|
| 1. Twin Western Resources 1 Schaben | NE NW sec 19 T19S R21W |
| 2. Champlin Petroleum Co. 2 Wittman | SW SW sec 19 T19S R21W |
| 3. Cities Service Oil Co. 2D Moore | 150'SW NW NW sec 30 T19S R21W |
| 4. Cities Service Oil Co. 2C Moore | APP NW SW sec 30 T19S R21W |
| 5. Pickrell Drilling Co. 1A Schaben | SW NW sec 31 T19S R 21W |
| 6. Ritchie Exploration 1AP Foos | NE SW SW sec 31 T19S 21W |
| 7. Cities Service Oil Co. 1A Foos | SW SW sec 31 T19S 21W |
| S. Zorger Petroleum 1 McJunkin | NE NW NW sec 6 T20S 21W |
| 9. Pickrell Drilling Co. 1 Sears | NW NW sec 6 T20S 21W |
| 10. Cities Service Oil Co. 3A O'Brien | APP SW SW sec 6 T20S 21W |
| 11. Cities Service Oil Co. 4A O'Brien | SW NW sec 7 T20S 21W |
| 12. Cities Service Oil Co. 1B O'Brien | APP NW SW sec 7 T20S 21W |
| 13. Cities Service Oil Co. 2B O'Brien | APP N2 SW SW sec 7 T20S 21W |
| 14. Mack Oil Co. 1 Wittman | 150' SE SW NW sec 18 T20S 21W |
| 15 Bennett & Roberts Dilling 1 Schwein | SW SW SW sec 18 T20S 21W |
Plates 1 and 2 display all logs and tops for the most important markers below the Heebner. Tables 3 and 4 provide depth to such markers.
Table 3--Depth to tops in the west-east cross-section. Tracing started from Well Moo2D. The datum is sea level. All results are in feet.
| Wells and Logs | Tops | ||||||||
|---|---|---|---|---|---|---|---|---|---|
| Fs 1-27 GR-ILD |
Glaves 1 GR-GUAR |
Ford 1 GR-GUAR |
Lent 2 GR-GUAR |
Bor4 GR-ACCU |
Bor2A GR-LL |
Bor3 GR-GUAR |
Moo2D GR-LL |
||
| 1 | 1467.0 | 1467.0 | 1460.0 | 1460.5 | 1462.0 | 1463.5 | 1456.5 | 1463.0 | Heebner |
| 2 | 1502.5 | 1502.0 | 1494.5 | 1497.0 | 1497.0 | 1496.5 | 1491.5 | 1497.0 | Douglas |
| 3 | 1516.5 | 1513.5 | 1507.5 | 1507.5 | 1509.5 | 1512.5 | 1508.5 | 1514.0 | Lansing |
| 4 | 1586.5 | 1585.0 | 1575.5 | 1578.5 | 1574.5 | 1576.5 | 1574.5 | 1580.0 | Kansas City |
| 5 | 1860.0 | 1859.5 | 1848.0 | 1851.5 | 1852.5 | 1849.5 | 1840.0 | 1852.0 | Pleasanton |
| 6 | 1872.5 | 1869.0 | 1856.0 | 1858.0 | 1860.0 | 1856.5 | 1847.0 | 1859.0 | Marmaton |
| 7 | 1947.5 | 1945.0 | 1933.5 | 1937.5 | 1938.0 | 1932.0 | 1918.5 | 1930.0 | Pawnee |
| 8 | 2026.0 | 2024.0 | 2012.5 | 2015.0 | 2015.0 | 2010.0 | 1996.0 | 2010.5 | Fort Scott |
| 9 | 2047.0 | 2044.5 | 2034.5 | 2036.0 | 2036.5 | 2031.5 | 2013.5 | 2028.0 | Cherokee |
| 10 | 2122.5 | 2110.5 | 2094.5 | 2114.5 | 2103.0 | 2100.51 | 2085.5 | 2107.0 | Mississippian |
| Wells and Logs | Tops | |||||||
|---|---|---|---|---|---|---|---|---|
| Moo2D GR-LL |
Moo4B GR-LL |
Moo6B GR-LL |
Rein 4A GR-LL |
Rein 1C GR-LL |
V. 1 Rein GR-GUAR |
P. 1 Rein GR-GUAR |
||
| 1 | 1459.0 | 1463.0 | 1476.0 | 1484.5 | 1494.5 | 1489.5 | 1508.5 | Heebner |
| 2 | 1492.5 | 1496.0 | 1510.0 | 1521.0 | 1533.0 | 1526.0 | 1545.5 | Douglas |
| 3 | 1511.0 | 1514.5 | 1525.0 | 1534.0 | 1545.0 | 1536.0 | 1555.0 | Lansing |
| 4 | 1577.0 | 1580.5 | 1590.5 | 1600.5 | 1609.0 | 1604.5 | 1622.0 | Kansas City |
| 5 | 1843.5 | 1848.5 | 1858.0 | 1866.0 | 1874.5 | 1866.5 | 1887.5 | Pleasanton |
| 6 | 1850.5 | 1855.5 | 1864.5 | 1872.5 | 1882.5 | 1880.5 | 1899.0 | Marmaton |
| 7 | 1925.0 | 1928.0 | 1939.0 | 1948.0 | 1965.5 | 1961.5 | 1986.0 | Pawnee |
| 8 | 2006.0 | 2009.0 | 2021.0 | 2027.5 | 2036.0 | 2032.0 | 2049.0 | Fort Scott |
| 9 | 2023.5 | 2027.0 | 2038.0 | 2047.5 | 2056.5 | 2051.0 | 2068.0 | Cherokee |
| 10 | 2088.5 | 2087.0 | 2100.5 | 2116.5 | 2132.5 | 2126.5 | 2154.5 | Mississippian |
Table 4--Depth to tops in the north-south cross-section. Tracing started from Well Moo2D. The datum is sea level. All results are in feet.
| Wells and Logs | Tops | ||||||||
|---|---|---|---|---|---|---|---|---|---|
| Sch 1 GR-GUAR |
Wittm2 GR-LL |
Moo2D GR-LL |
Moo2C GR-LL |
Sch1A GR-LL |
Fs1AP GR-RSFL |
Fs1A GR-LL |
McJun1 GR-GUAR |
||
| 1 | 1502.5 | 1466.0 | 1463.0 | 1463.5 | 1498.5 | 1494.0 | 1496.5 | 1502.0 | Heebner |
| 2 | 1538.0 | 1499.5 | 1497.0 | 1496.5 | 1535.0 | 1530.5 | 1533.5 | 1538.0 | Douglas |
| 3 | 1550.0 | 1516.0 | 1514.0 | 1513.0 | 1550.0 | 1543.5 | 1546.5 | 1551.0 | Lansing |
| 4 | 1616.0 | 1584.0 | 1580.0 | 1579.0 | 1615.5 | 1611.0 | 1613.5 | 1619.5 | Kansas City |
| 5 | 1899.5 | 1855.0 | 1852.0 | 1853.5 | 1885.0 | 1879.0 | 1883.5 | 1888.0 | Pleasanton |
| 6 | 1906.5 | 1862.0 | 1859.0 | 1858.0 | 1895.5 | 1888.5 | 1892.0 | 1896.0 | Marmaton |
| 7 | 1982.0 | 1931.5 | 1930.0 | 1935.5 | 1967.5 | 1959.5 | 1965.0 | 1968.5 | Pawnee |
| 8 | 2062.0 | 2013.0 | 2010.5 | 2016.0 | 2049.0 | 2041.5 | 2046.5 | 2049.5 | Fort Scott |
| 9 | 2080.5 | 2030.5 | 2028.0 | 2035.5 | 2071.5 | 2065.0 | 2070.0 | 2073.5 | Cherokee |
| 10 | 2160.0 | 2106.5 | 2107.0 | 2111.5 | 2138.5 | 2124.5 | 2133.0 | 2132.0 | Mississippian |
| Wells and Logs | Tops | |||||||
|---|---|---|---|---|---|---|---|---|
| Sears 1 GR-GUAR |
O'Br3A GR-LL |
O'Br4A GR-LL |
O'Br1B GR-LL |
O'Br2B LL |
Wittm1 GR-ACCU |
Schwn1 GR-LL |
||
| 1 | 1498.0 | 1500.5 | 1491.0 | 1496.5 | 1515.0 | 1496.5 | 1500.0 | Heebner |
| 2 | 1534.5 | 1537.5 | 1527.0 | 1532.5 | 1549.5 | 1530.0 | 1533.5 | Douglas |
| 3 | 1547.0 | 1549.5 | 1538.5 | 1544.5 | 1561.5 | 1542.5 | 1545.5 | Lansing |
| 4 | 1613.0 | 1615.0 | 1604.0 | 1611.0 | 1628.5 | 1611.0 | 1615.0 | Kansas City |
| 5 | 1882.5 | 1885.0 | 1871.5 | 1875.0 | 1895.0 | 1882.0 | 1891.5 | Pleasanton |
| 6 | 1890.0 | 1893.0 | 1879.0 | 1882.5 | 1902.5 | 1893.0 | 1904.5 | Marmaton |
| 7 | 1962.0 | 1972.0 | 1965.5 | 1963.5 | 1979.5 | 1974.0 | 1978.0 | Pawnee |
| 8 | 2044.0 | 2053.5 | 2041.0 | 2041.0 | 2060.5 | 2052.5 | 2058.5 | Fort Scott |
| 9 | 2068.0 | 2079.0 | 2066.0 | 2066.5 | 2085.0 | 2080.5 | 2084.0 | Cherokee |
| 10 | 2126.0 | 2147.0 | 2125.0 | 2125.0 | 2142.0 | 2140.5 | 2152.0 | Mississippian |
Plates 3 and 4 provide a display of the percent shale for the same interval and vertical exaggeration as the cross-section reproduced in Figure 2.
Plate 5 and following offer alternative displays of different intervals for the same two previous cross-sections.
Montgomery, S. L., Franseen,E. K., Bhattacharya, S., Gerlach, P., Byrnes, A., Guy, W., and Carr, T. R., 2000, Schaben Field Kansas: Improving performance in a Mississippian Shallow-Shelf Carbonate: American Association of Petroleum Geologists Bulletin, vol. 84, no. 8, p. 1069-1086
Olea, R. A., 1988, CORRELATOR, an Interactive Computer System for Lithostratigraphic Correlation of Wireline Logs: Petrophysical Series 4, Kansas Geological Survey, 85 p.
Kansas Geological Survey, Energy Research
Placed online Jan. 3, 2011
Comments to webadmin@kgs.ku.edu
The URL for this page is http://www.kgs.ku.edu/PRS/publication/2000/ofr52/index.html