Kansas Geological Survey, Open-file Report 93-49
KGS Open File Report 93-49
Prepared for presentation at SEPM 1992 Theme Meeting: Mesozoic of the Western Interior, Fort Collins, Colorado
Released December 7, 1993
The full report is available as an Adobe Acrobat PDF file (81 kB).
Gamma-ray logs of closely-spaced wells along a lengthy east-west traverse have been digitized from just below the Stone Corral (Lower Permian) to the Fort Hays (Upper Cretaceous). For each well, the digitized interval ranges stratigraphically from just below the Stone Corral (Lower Permian) to the Fort Hays (Upper Cretaceous). In a conventional presentation of the regional geology based on gamma-ray logs, the individual traces would be hung in a single presentation, with correlation lines marked to aid visualization. The scope of this data set is such as to stretch the limits of this style of presentation beyond its practical limits.
In an alternative approach, each digital gamma-ray log has been transformed to a gray-level image strip, where the darkness intensity is a function of the natural gamma radioactivity of the logged formations. Under this system, sandstones and limestones appear as white or pale gray, while shales register as dark gray or black. When hung together on a common stratigraphic horizon and arranged in correct geographic order, the result is a regional gray-level image of the subsurface geology of the Permian to Cretaceous sequence. The major advantage of this approach is that the information is coded in a visual form that is close to a simulation of how the geology would actually appear, when making allowance for the vertical exaggeration. The immediacy of the image should free the observer to focus easily on structural and stratigraphic features of all kinds.
A reduced photocopy is indexed with some major subsurface units and should be used as the stratigraphic reference key for the large cross-section. The Stone Corral forms a distinct and continuous band at the base of the section. The Cedar Hills Sandstone (Lower Permian) is the most obvious feature in the overlying Permian as a thick wedge that subcrops at the base of the Cretaceous to the east. This is of particular interest to the Dakota Aquifer Program study, because it is saline waters moving upwards through the Cedar Hills that cause local, but major, degradation in Dakota water quality in central Kansas. Sandstones at the base of the Cheyenne appear to be traceable for considerable distances, and contrast with the rather patchy sandstone developments within the Dakota Formation. These are the expected outcome of distributary channel networks and the complex facies mosaics of the delta and coastal plains which deposited the original sediments. The marine transgressive sequence of the Upper Cretaceous (Graneros Shale, Greenhorn Limestone, Carlile Shale) shows as a broad regional bands at the top of the section.
The regionally continuous units in the sequence both above and below the Dakota Aquifer form useful visual reference patterns in the assessment of the internal geometry of the Dakota sandstones and the distinction of real features from artifacts introduced by processing or the discontinuities of the well spacing. It is hoped that the section images will be informative for a variety of applications, ranging from use as a basic educational exhibit to a conceptual template for realistic computer simulation models.
The original version of the regional image required remedial processing to remove errors associated with the recording of the gamma-ray logs on which the image is based. The problem can be seen readily as log strip images that appear to be either distinctly darker or lighter than the strip images of adjacent wells. Most of these anomalies are small but are sufficiently distracting to hinder the observer's eye in its ability to trace lateral features. The cause of this problem is directly attributable to random calibration errors linked with the original gamma-ray logs.
Significant progress has been made recently in methods to normalize the digital gamma-ray logs through statistical processing. Two stratigraphic units were selected to function as calibration standards: the Graneros Shale as the "hot" standard (high gamma ray values) ; the Stone Corral as the "cold" standard. The use of two different standards allows correction of random errors that involve both shift and stretch of the log with respect to its true scale.
The choice of each was based on a geological perception that they would be major local changes (at a scale less than the distance between section wells) would be fairly minor. Instead, the gamma-ray response of these units would be dominated by a regional trend, but confounded by random measurement error. This working hypothesis leads to a numerical model in which curvilinear trends may be fitted to the raw gamma-ray values of the units to extract regional changes. The appropriate choice of trend can be guided by the statistics of fit and the criterion that the residuals should represent measurement error and so show no autocorrelation.
The procedure was applied to the Stone Corral by fitting a succession of progressively more complex polynomials. There is little variation in the unit's gamma-ray values when traced across the state, so that the significant quartic polynomial trend shows little fluctuation from a constant. The residuals from this trend are essentially random, and so were equated with measurement error.
By contrast, the Graneros Shale shows systematic, but complex, regional changes that could not be absorbed satisfactorily by low-order polynomial trends. In an alternative strategy, the Graneros data was fitted with splines: short stretches of cubic polynomials with continuous derivatives at their links. The degree of complexity of the optimum spline fit was chosen as that which resulted in random residuals. More localized features on the curve can be attributed to the influence of Dakota deltaic paleogeography with respect to the line of the section. However, there is a systematic and generalized drift in gamma-ray values moving westwards. This aspect reflects the marine transgression of the Graneros from the west and the location of the Cretaceous Interior Seaway in that direction.
Increasing gamma-ray values are commonly associated with deeper marine shales. and are caused by higher concentrations of uranium fixed by organic matter under reducing conditions.
Measurement error estimates produced at each well have been used to correct digital gamma-ray records in the processing of revised versions of the image section. The final product provides a unique insight into the regional geometry of units within the Cretaceous and Permian of Kansas that is a closer representation of reality than standard, interpretative cross-sections.
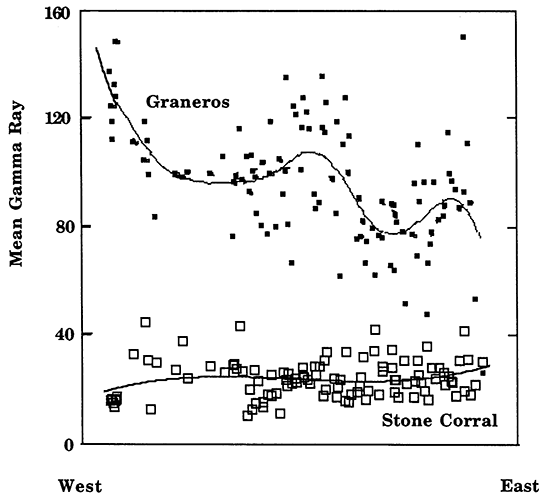
Plot of mean gamma-ray of Graneros Shale and Stone Corral referenced to east-west coordinate on the Township 16S section. The data are fitted with a high-order spline (Graneros) and a quartic polynomial (Stone Corral).
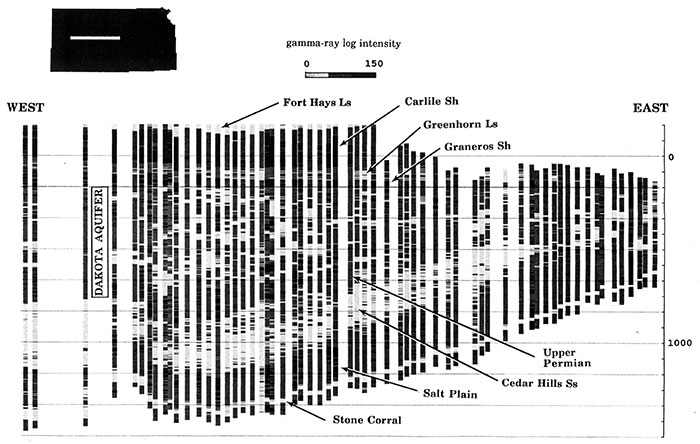
Reduced picture of a provisional gamma-ray log intensity image of the Permian through Lower Cretaceous in western Kansas along Township 16.
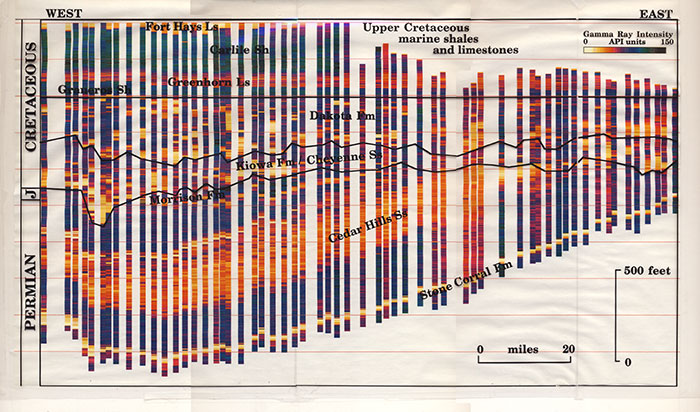
Color version added to this report. Created from an archived copy. A larger PDF version is also available.
Kansas Geological Survey, Energy Research
Placed online May 12, 2015; original report from 1992
Comments to webadmin@kgs.ku.edu
The URL for this page is http://www.kgs.ku.edu/PRS/publication/1993/OFR93_49/index.html