|
Reservoir Characterization to Inexpensively Evaluate
the Exploitation Potential of a Small Morrow Incised Valley-fill
Field
|

Kansas Geological Survey
Open-file Report 2002-9 |
Core Petrophysical Properties
Archie Cementation Exponent
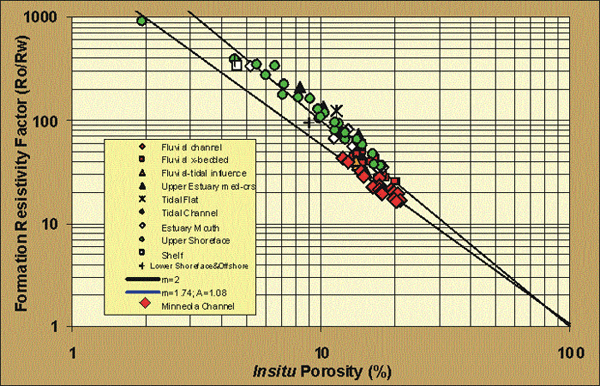
Wireline log water saturations were interpreted using the available
resistivity logs and the Archie equation for water saturation
calculations. Previous analysis of Morrow sandstones has shown
that the cementation exponent, m=1.81, and intercept, a=1, for
channel sandstones and m=2 and a=1, for other lithofacies (Figure).
For the Morrow in the Minneola Unit, average m=1.78+0.09 for a=1
for the channel sands, or alternately, linear regression analysis
of the trend indicates that m=1.74 and a=1.08. Other lithofacies
exhibit an average m=2.

e-mail : webadmin@kgs.ku.edu
Last updated March 2002
http://www.kgs.ku.edu/PRS/Poster/2002/2002-9/P2-05.html

