Orientations of Seismic Lineaments Compared to Regional Structure
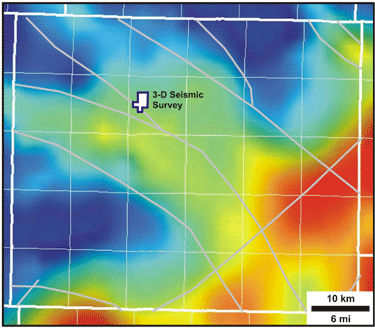
In order to search for seismic features related to fracturing in the Dickman Field Mississippian reservoir, maps of volumetric most negative curvature have been extracted from the top of Mississippian and Gilmore City seismic horizons. The Gilmore City is the base of the Mississippian aquifer, approximately 130-180 ft (20-30 milliseconds) below the reservoir in Dickman Field. The two maps are very similar, showing oriented sets of lineaments that appear to persist from the top of Mississippian to the base of the aquifer.
These lineaments were interpreted on the Gilmore City horizon, and their orientations were analyzed using rose diagrams. The Gilmore City horizon was used because it is more continuous than the top of Mississippian, and curvature of the Mississippian surface is somewhat affected by topographic irregularities due to erosion at the pre-Pennsylvanian unconformity surface.
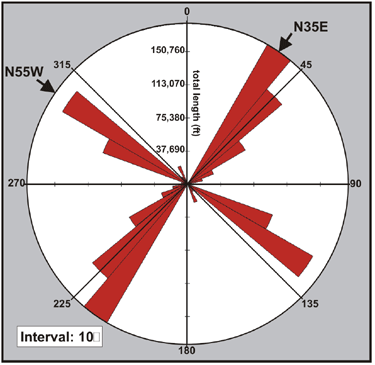
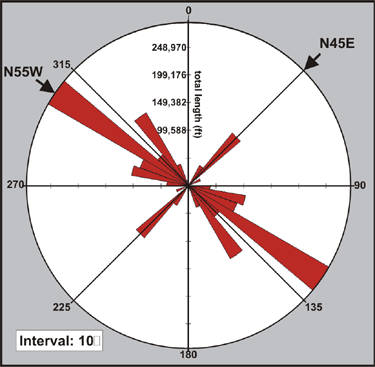
Rose diagrams of the interpreted lineaments show two main orientations, N45E and N45W, similar to the orientations of lineaments interpreted from a dip map of the regional top of Mississippian surface and also similar to regional gravity and magnetic lineament trends for Ness County, KS.
Although the number of lineaments interpreted with NE and NW trends is approximately equal in the Dickman seismic survey, NE-trending lineaments have greater length and continuity than the NW-trending lineaments. The NE lineament trend parallels the fault at the northwest corner of the seismic survey.
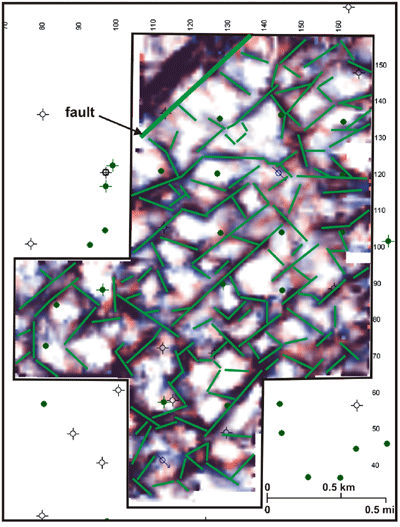
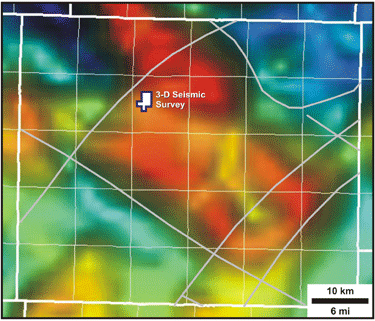
Superimposed volumetric most negative curvature maps extracted at the top of Mississippian (red) and Gilmore City (blue) horizons. Saturated colors indicate tightest curvature. Purplish colors indicate features that are coincident on the two maps. Lineaments interpreted from the Gilmore City curvature map are superimposed in green.
 |
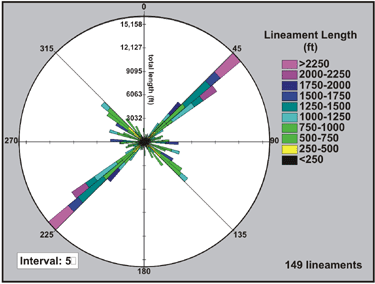 |
| Rose diagram showing the number of interpreted lineaments within a given azimuth sector. Lineament length is indicated by color. | Rose diagram showing the sum of lineament lengths within a given azimuth sector. Lengths of individual lineaments are indicated by color. |
Regional Mississippian Structural Trends
 |
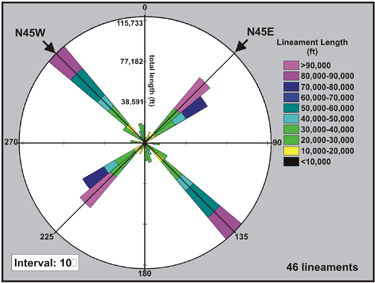 |
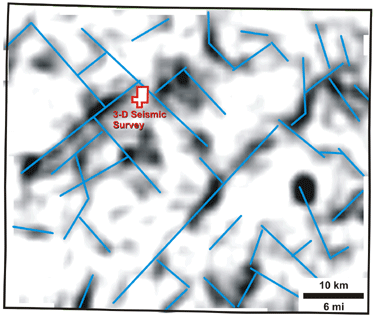
| Dip map of the top of Mississippian surface (from well tops) for Ness County. Black indicates high dip. Interpreted lineaments are shown in blue. High dip lineaments are likely to represent faults. | Length-azimuth rose diagram of lineaments interpreted from the top of Mississippian dip map |
Regional Magnetics
 |
 |
| Magnetic map of Ness County with regional lineaments superimposed in gray (After Kruger, 1997). Blues represent lowest values, reds represent highest values. |
Length-azimuth rose diagram of Ness County regional magnetic lineaments. |
Regional Gravity
 |
 |
| Bouguer gravity map of Ness County with regional lineaments superimposed in gray (After Kruger, 1997). Blues represent lowest values, reds represent highest values. | Length-azimuth rose diagram of Ness County regional gravity lineaments. |
http://www.kgs.ku.edu/PRS/AAPG2005/karst/p2-01.html
Last Modified December 2005