Putting it all together
The integration of geoscience data by quantitative methods
Previous--Objectives, Principal Components ||
Next--Principal Component 1 Scores
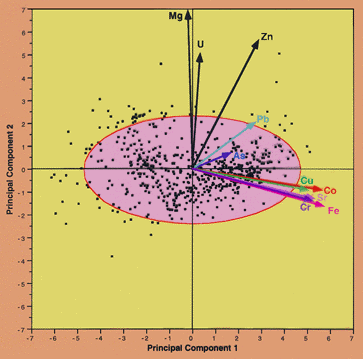
Principal Components Plot
Component 1 = 48%, Component 2 = 12%
Grazer Palaeozoikum
A large version of this figure is available.

Previous--Objectives, Principal Components ||
Next--Principal Component 1 Scores
