![]()
![]()
![]()
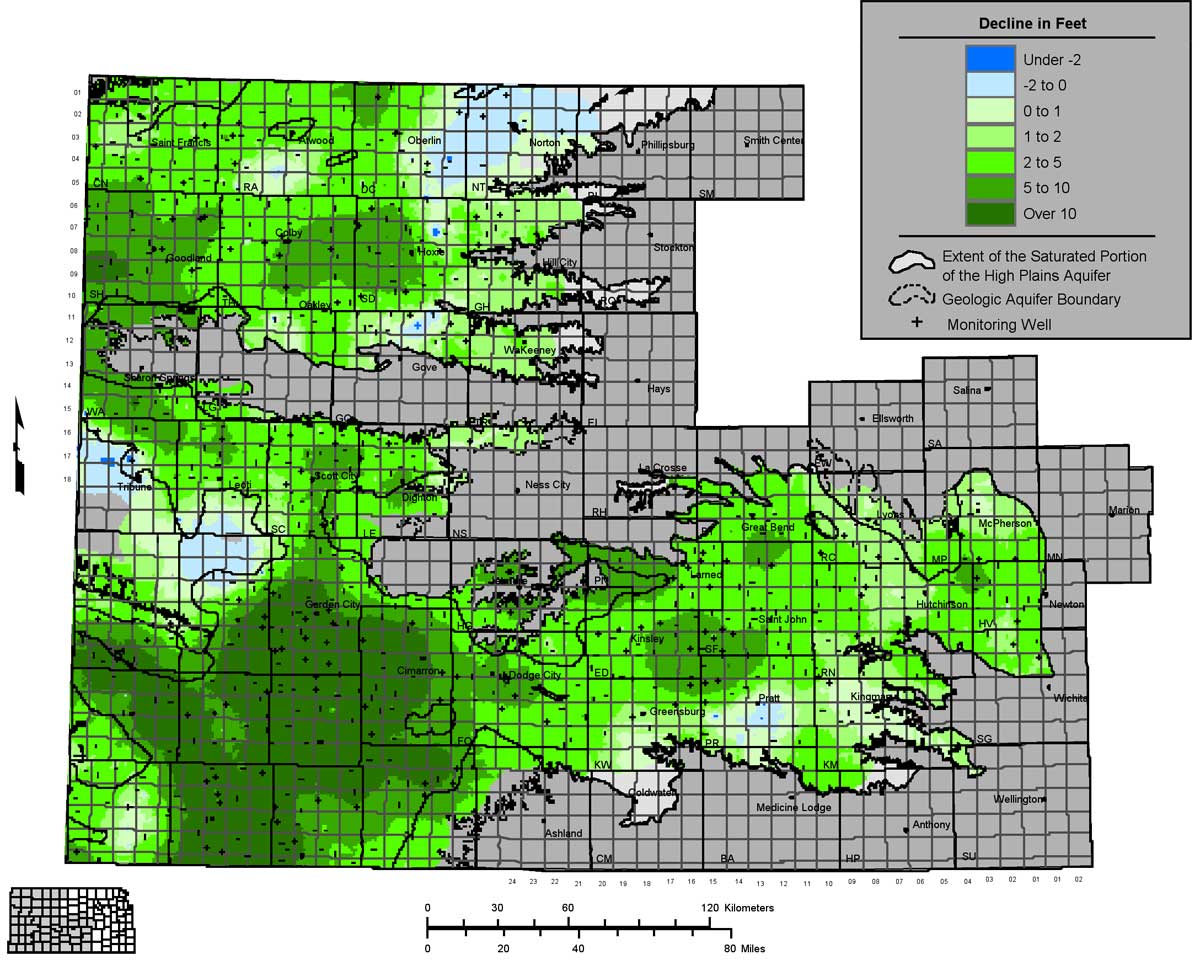
Figure 18--Water level changes for the five-year interval from 1999 to 2004.
Kansas Geological Survey, Water Level CD-ROM
Send comments and/or suggestions to webadmin@kgs.ku.edu
Updated Dec. 30, 2004
Available online at URL = http://www.kgs.ku.edu/Magellan/WaterLevels/CD/Reports/OFR04_57/fig18.htm