2000 Annual Water Level Raw Data Report for Kansas
Prev Page--Report Start || Next Page--Acquisition Activity
The Division of Water Resources (DWR) of the Kansas Department of Agriculture and the Kansas Geological Survey (KGS) manage and operate the statewide cooperative annual water level measurement program. Water level measurements are scheduled annually for about 1,400 wells spread across 51 central and western Kansas counties (Figure 1). These annual measurements are nominally made during the month of January and include wells used for stock, irrigation, household, and monitoring (some abandoned agricultural or domestic wells). The data acquired during these yearly measurements are tabulated to establish trends and allow evaluation and judgments for effective water resource management.
Figure 1--Locations of wells in 2000 water-level measurement program.
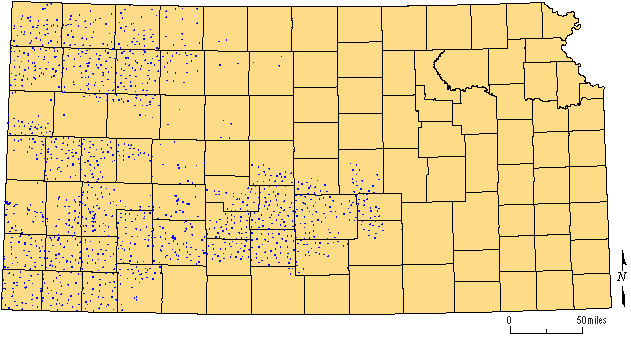
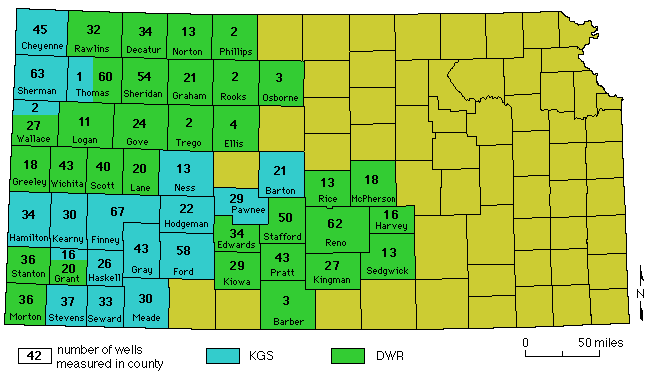
Figure 2--Number and organizational responsibility by county for the 2000
network wells.
Data acquisition enhancements evaluated during the 2000 campaign include the introduction of the Warlock. This is a paperless data entry system centered around a small (3"x5"x_") handheld computer, the Palm Pilot-III, running custom in-house software. Initial results show this system to be an extremely effective and a highly efficient data acquisition/ recording tool.
Spatial analysis of the 1999 water level data identified 32 locations where new wells should be incorporated into the annual measurement network to eliminate sampling "holes." Cooperation between the groundwater management districts (GMDs), DWR, and KGS staff identified wells acceptable for inclusion in the network at 16 of the 32 locations. Even though only 12 of the 32 sites actually resulted in water level measurements, a procedure is developing for the incorporation of new wells into the annual network while the overall completeness of sampling continues to improve. The last three years have seen positive growth in the number of wells in the annual network in response the retirement or replacement of inconsistent, plugged, or inaccessible wells.
The Quality Control program continues to achieve its objectives of identifying and quantifying sources of unwanted variation in observation well data collection, and in flagging wells whose measurements require verification. In 2000, most of the possible sources of unwanted variation were not significant, in strong contrast with results obtained in 1999 when most exogenous variables were significant. The variance in water level change in 2000 is about one-third its value in 1999, probably because 24 wells whose measurements were atypical and likely in error were deleted from the network. These 24 wells had made excessive contributions to the total variance and were responsible for most of the statistical significance attributable to exogenous variables. The wells had been repeatedly measured, indicating that measurers either had difficulty obtaining reliable readings or that initial depths to water were significantly out-of-trend. As the Quality Control process continues to be applied to the KGS observation well measurement program in the future, similar improvements in data quality are to be expected.
The original observation well network designed in 1984 was based on a regular hexagonal pattern, with observation wells located at or near the centers of the hexagons. Unfortunately, some current observation wells are far from the centers of their hexagons, and some hexagons no longer contain a network well at all, resulting in "holes" in the network. The integrity of the network is being restored through the selection and measurement of new wells optimally located to fill existing undersampled areas. Determining the very best places for replacement wells requires a geostatistical study, which unfortunately delays the measurement of the water surface in undersampled areas. Replacement wells selected by measurement staff during the measurement campaign are preferred over leaving a "hole" in the network for that measurement year while waiting for a computer-aided replacement well to be selected for the following year. A good rule of thumb for field workers to use for selecting a replacement for a lost observation well is to choose a new well as close as possible to the center of the hexagon. It is possible to have holes form in the network if replacement wells deviate too far from the center of the hexagon. Yearly geostatistical studies will define undersampled areas (holes) and select optimum locations for replacement wells to eliminate extraneous holes in the network occasionally left by the hexagon system.
Prev Page--Report Start || Next Page--Acquisition Activity