Kansas Geological Survey, Open-file Report 2008-31
by
Margaret Townsend
KGS Open File Report 2008-31
Final Report for Rural Water District #7 Bonner Springs, Kansas
December 2008
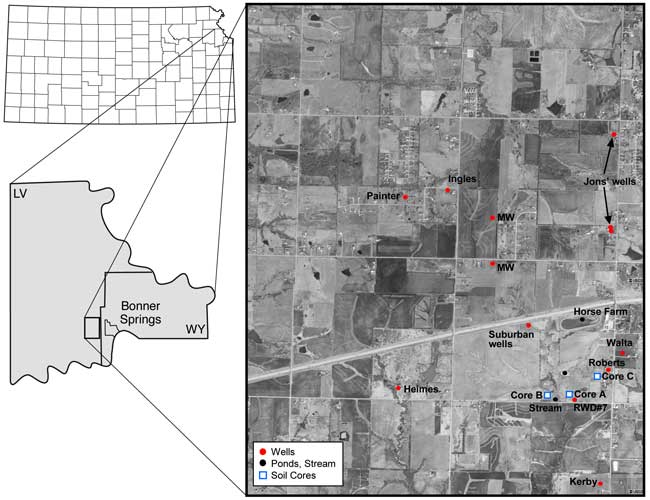
Rural Water District #7 in Leavenworth County, Kansas, requested the Kansas Geological Survey (KGS) to investigate the cause of increasing nitrate-N concentration (close to 10 mg/L) in well #1 utilized for water supply for the water district. The nitrogen-15 natural abundance isotope method is used to determine the nitrate origin. In addition, bromide/chloride and sulfate/chloride ratios are used to identify sources of salinity as an additional means to trace the nitrate origin. The study area is located in T. 11S., R. 22 E. in Leavenworth County, west of Bonner Springs, Kansas (fig. 1).
Water samples were collected from RWD#7 Well 1, additional domestic wells within the same ground-water watershed, from several ponds, and a stream in October 2007 (fig. 1). Wells were turned on for approximately 10 minutes prior to initiation of monitoring for specific conductance and temperature readings. Samples were collected at five-minute intervals until the specific conductance and temperature readings were constant. The wells usually ran for a minimum of 20 minutes before a sample was collected.
Figure 1. Sampling points for ground water (wells, red circles), surface water (ponds and stream, black circles), and soil cores (blue squares) in secs. 15, 16, 21, 22, and 23, T. 11 S., R. 22 E., Leavenworth County, Kansas.
Well-water samples were collected in a bucket that was cleaned with deionized water between wells, and then poured into sample bottles: a 500-ml non-preserved sample for cations (calcium, magnesium, potassium, sodium), and bicarbonate, and a 200-ml sample with 2 ml 10% HCl preservative for nitrate and other anions (chloride, and sulfate). Surface-water samples were also collected using a bucket that was cleaned with deionized water between wells, and then poured into sample bottles: a 500-ml non-preserved sample for the cations and bicarbonate, and a 200-ml sample with 2- ml 10% HCl preservative for nitrate and other anions.
Samples for nitrogen-15 analysis were collected in 100-ml bottles. All samples were kept on ice until returned to the KGS laboratory in Lawrence. Samples were refrigerated in the laboratory until analyses were performed. Samples for isotopes were frozen until sent for analysis at the University of Virginia.
A Garmin© geographic positioning system (GPS) device was used to take latitude and longitude location readings for each sampling point. Notes and pictures were taken concerning the land use surrounding each well.
A soil core was collected at each of three sites in the vicinity of RWD#7 well #1 using a Geoprobe operated by PSA Environmental of Lee Summit, Missouri. Core C was topographically upgradient of the well, core A was near the well, and core B was south of the well. Collection sites are shown in figure 1. Cores were collected in liners to approximately 40 ft at all three sites. The liners were split open and the cores described and subdivided for chemical and particle-size analysis.
The KGS Analytical Services Section filtered the water samples through 0.45-µm membrane filter paper before analysis. Specific conductance was measured to estimate chloride concentration and determine a dilution factor for the optimum concentration range of the analytical method. Nitrate, chloride, sulfate, and bromide concentrations were determined using a Dionex ICS Series 3000 ion chromatograph. Bicarbonate content was computed from an alkalinity determination using an automated titrimeter. Cation concentrations were measured using an inductively coupled argon plasma spectrometer. Charge balance errors calculated for the well waters, for which measurements of all major and substantial minor constituents were completed, were all <2% and averaged 1.0%. As a part of its quality assurance steps, the KGS participates in the standard reference water program of the U.S. Geological Survey.
Laboratory information and chemical data for the ground-water and surface-water samples are listed in Appendix A. The table includes the total dissolved solids (TDS) content calculated from the major and minor constituent concentration. In the TDS computation, the bicarbonate concentration was multiplied by 0.4917 to approximate the carbonate that would be left in the residual solids after evaporating to dryness.
The bromide/chloride ratio and sulfate/chloride ratio methods involve plots of the constituent mass ratios bromide/chloride or sulfate/chloride versus chloride concentration, with points for the water-sample data and curves for the mixing of different source waters (Townsend and Whittemore, 2005; Whittemore, 1984; 1988; 1995). Each mixing curve is generated using an algebraic equation for conservative mixing of two end-member waters. Conservative mixing refers to the simple mixing of waters without chemical reactions, such as mineral precipitation or adsorption, which could alter the concentrations of one or both of the constituents. The bromide/chloride ratio is multiplied by 10,000 for graphical display to give numbers that range from about one upwards (the lowest mass ratios are near 0.0001 for halite or rock-salt dissolution). Logarithmic scales are used in the graphs because they produce a more even distribution (separation) of points for large ranges in concentration and ratios than linear scales. The mixing curves bend in different directions depending on the relative difference in the ratios compared to the difference in the chloride concentrations for the end points.
Chemical analyses for soil nitrate-nitrogen (nitrate-N) and ammonium-nitrogen (ammonium-N), using standard soil methods, were done at the Kansas State University (KSU) Soils Testing Laboratory, Manhattan, Kansas. Particle-size analysis for all cores was done by D. Rinaldi at University of Missouri-Kansas City. Particle size was also analyzed by KSU Soil Testing Laboratory on core C in order to evaluate the relationship of nitrate-N and ammonium-N concentrations with particle size. Standard hydrometer methods were used (Bouyoucos, 1962; Foth et al., 1971; Gavlak et al., 2003). Chemical analyses for each core and particle size analysis for core C are reported in Appendices B1, B2, and B3.
Sub-samples for nitrogen-15 isotope analysis of organic nitrogen were selected from all cores based on the maximum nitrogen concentrations throughout the cores. Previous work suggested that most nitrogen found in soil samples is of organic origin (Townsend et al., 2007b). All soil samples were dried in a 50° C oven, ground, and weighed. All soils were treated with 30% hydrochloric acid to remove carbonates. Potassium chloride was used to remove the inorganic nitrogen present in the soil. The samples were again dried in a 50° C oven and placed in a desiccator until sent to the University of Virginia for analysis.
The nitrogen-15 isotopic composition in the waters was determined at the Department of Environmental Sciences, University of Virginia. Water samples were treated with hydrochloric acid to remove carbonates and then dried. Samples of the dried nitrate-containing salts dissolved in the waters were combusted at high temperature to nitrogen gas for analysis of their isotopic compositions.
Soil samples were weighed based on the reported nitrogen-values record sent with the samples to prevent interferences on the mass spectrometer. The samples were combusted at high temperature to nitrogen gas for analysis of their isotopic compositions. Values were reported for organic nitrogen δ15N values.
The δ15N was determined on a Micromass Optima isotope ratio mass spectrometer (IRMS) coupled with an elemental analyzer (EA), with an overall precision better than 0.5‰. The data are reported relative to a standard (atmospheric N2) defined to be 0‰, and expressed in δ notation as:
δsample(‰)= (Rsample/Rstandard -1) x 1000
where δsample represents δ15N, and R is the molar ratio of the heavier to the lighter isotope for the standard or sample (Hoefs, 2001). The analyses were run on nitrate in all samples.
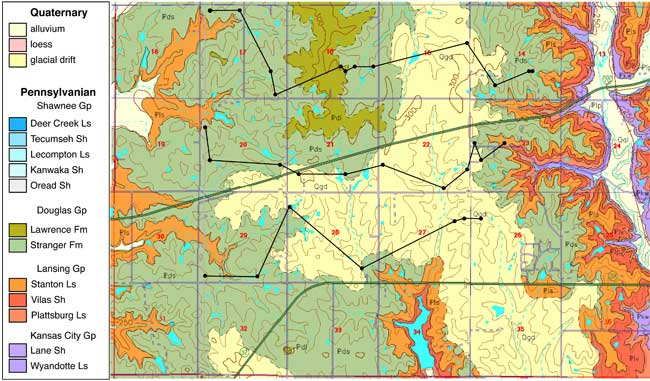
Loess soils overlie unconsolidated glacial drift and alluvial sediments of sand, silt, and clay which cover the Pennsylvanian bedrock in the area (fig. 2). The soils in the area are generally Sharpsburg-Shelby association and the Grundy-Pawnee-Shelby association. Both associations are deep, moderately well drained to poorly drained, and have silty-clay and clay-loam subsoils. Particle size is predominantly silty clay with occasional increased sand content throughout the profile. Soil coring sites are shown in figure 1.
Figure 2. Geologic map of the study area (McCauley, 1998). Study area underlain by Pennsylvanian bedrock and overlain by glacial drift. Glaciated areas probably underlain by buried glacial valleys are in secs. 15, 16, 21, 22, 23, and 27 (Denne et al., 1998).
Wells in the area range in depth from 25 to 40 ft (hand dug) to depths of up to 140 ft (drilled). Average depth to water is about 40 ft. Direction of ground-water flow is generally towards the subsidiary streams in the area which ultimately flow to the Kansas River.
Domestic wells in the area were sampled to determine variation in water quality near the RWD#7 well and away from the immediate study area. Wells that were sampled are shown in figure 1.
The geology in the study area is composed principally of Pennsylvanian sandstones, limestones, and shales with overlying glacial drift deposits (fig. 2; McCauley, 1998). The study area has indications of a buried sand and gravel channel occurring in a north south direction through the study area (Denne et al., 1998). Many wells in the study area are located in these sand and gravel deposits. Figure 3 shows geologic cross sections based on water-well completion records in the study area (http://www.kgs.ku.edu/Magellan/WaterWell/index.html). Locations of well logs are shown in figure 2.
Figure 3. Cross-sections from WWC5 well log file for Leavenworth County, T. 11 S., R. 22 E. Wells in secs. 15, 22, 27 and 28, T.11 S., R. 22 E. (fig. 2) have more sand and gravel intervals indicative of a north-south buried glacial valley present in the area. Horizontal distances between wells are not to scale. Well logs are available at KGS WWC5 website http://www.kgs.ku.edu/Magellan/WaterWell/index.html (verified December 2008).
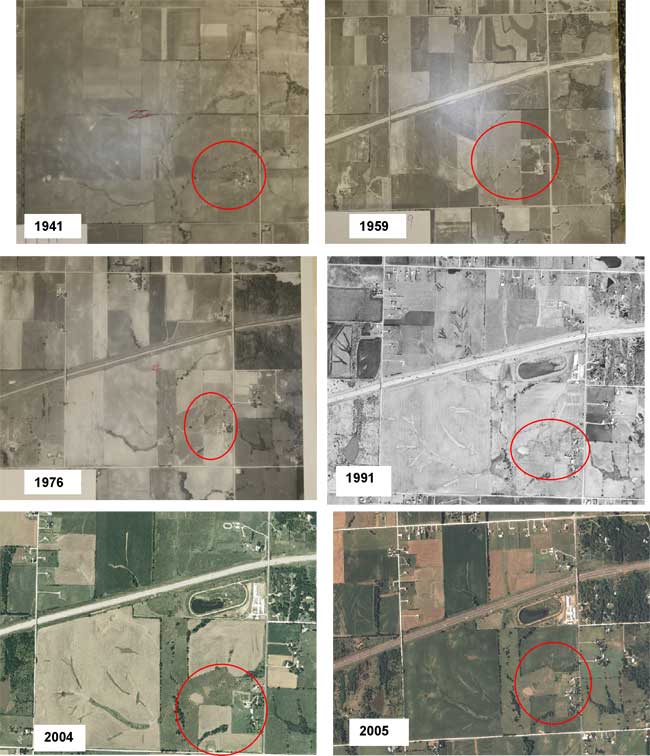
Historically, land use in the area of sec. 22, T. 11 S., R. 22 E. was pasture for dairy cattle. The aerial photos shown in figure 4 indicate changes in the overall land use. In 1941 the area was largely undeveloped. A large pond was installed between 1959 and 1976. The pond observed in 1976 was drained and another smaller pond was developed west of the first pond between 1976 and 1991 (1991 photo, fig. 4). Remnants of the pond were visible from 1991 onward.
Figure 4. Historic land-use photos of the study area from 1941, 1959, 1976, 1991, 2004, and 2005. Photos show the change in land use from pasture to an area with a large pond probably associated with the dairy that was in the area. Remnants of the pond are visible through 2005.
Ground water in the study area is generally calcium-magnesium-bicarbonate type water (fig. 5). The impact of increased nitrate-N and chloride inputs are indicated by the oval on figure 4. These wells include the hand-dug and drilled wells at a local dairy farm north of the study area, and wells located in areas with historic land use as pastureland for dairy or beef cattle. Treated and untreated wastewater and a manure sample from a feedlot (Townsend and Whittemore, 2005) are shown on the graph for comparison purposes. Two samples from Bonner Springs' municipal wells, which are located in the alluvium of the Kansas River, show the influence of increased TDS from the river for comparison with the ground water. The samples collected for this study indicate a possible mixing or dilution of animal waste, which could result in the observed chemistry of the ground water from the wells.
Figure 5. Trilinear diagram of water samples from the study area (within the oval), Bonner Springs municipal wells, untreated and treated effluent from McPherson, Kansas, and cattle manure are shown for comparison.
Chloride and bromide are ions in water considered to be conservative tracers because they are not affected by bacterial or chemical degradation. The ratios of bromide/chloride or chloride/bromide are indicative of different sources for chloride and potentially nitrate-N by association. Work by Vengosh and Pankratov (1998), Davis et al. (1997), Panno et al. (2006), and Whittemore (1984; 1988; 1995) all show that ratios based on bromide and chloride are a good discriminator of chloride sources of contamination in ground water. Use of the ratios in conjunction with nitrate-N and δ15N values helped to better define the nitrate-N sources in the study area.
The bromide/chloride ratios plotted on figure 6 are from several sources: the RWD#7 data collected in this study, literature values for horse and cattle manure (Hudak, 2003, personal communication, 2008), septic waste, saline water derived from rock salt (Panno et al., 2005), and municipal effluent (Townsend and Whittemore, 2005). The data from Hudak (2003) show the range of values that can occur from evaporation of animal waste (fig. 6). The ground-water samples collected from an active dairy farm to the north of the study area study showed similar bromide/chloride ratios (fig. 6). The observed values imply a similar source of evapoconcentrated animal waste.
Figure 6. Chloride versus bromide/chloride ratio graph showing potential sources of contamination and geochemical processes. The diagram illustrates the chemical characteristics of wells sampled in this study plus some end-member values for treated and untreated wastewater (Townsend and Whittmore (2005), septic waste, and saline water from rock salt dissolution from Panno et al. (2005). Potential source of contaminated water in the study area may be from evapoconcentration of animal waste from previous land use in the area.
Evaporation and transpiration of water concentrate the levels of dissolved solids in the residual water and increase both chloride and bromide contents without changing the bromide/chloride ratio. The samples from the current study with high nitrate-N values also have bromide/chloride ratios that fall within a range similar to those of Hudak (2003; fig. 6). The other sources shown on figure 6 (municipal treated and untreated wastewater, septic waste, and saline water from rock salt dissolution) do not have ratios that occur near the ranges observed in this study. These sources are not likely sources for the chloride and bromide concentrations observed in the ground water from the Bonner Springs study area.
Chloride concentration versus sulfate/chloride ratio plots and mixing curves are often used to assist in salinity identification. Figure 7 is a plot of chloride content versus sulfate/chloride mass ratio with points for the RWD#7 and surrounding wells, surface-water samples, data for septic waste, water-softener salt, and rock salt from Panno et al. (2005), and a manure sample (Townsend and Whittemore, 2005). The mixing zone bounded by solid lines represents the mixing of fresh ground water with saltwater from the dissolution of high-purity salt used in water softeners or rock salt, and evapoconcentration of salts as end points. Rock salt is used for road deicing in the winter and may have an impact as a source of chloride (Panno et al., 2005).
Figure 7. Sulfate/chloride ratio graph showing potential sources and processes for varying concentrations of sulfate and chloride. The diagram illustrates the chemical characteristics of wells sampled in this study plus some values for cattle manure, treated and untreated wastewater, septic waste, and saline water from the dissolution of rock salt (Panno et al., 2005). The potential source of contaminated water in the study area may be from evapoconcentration of animal waste associated with previous land use in the area.
The dashed curves represent conservative mixing of the fresh ground waters with the composition of the manure sample, septic waste, and municipal treated and untreated wastewaters. The water-softener and rock-salt sources are ruled out by the bromide/chloride relationships described earlier (fig. 5).
Figure 8 shows a direct relationship between nitrate-N and chloride concentrations for the samples collected for this study. The symbols within the oval on the graph represent wells with the highest nitrate-N and chloride concentrations. This type of correlation is often noted in studies where animal waste is a source of contamination (Townsend and Whittemore, 2005; Karr et al., 2001). If the nitrate-N and chloride increases shown in figure 8 are related to the same source, then the manure source is a better fit as the origin of chloride increases than salt dissolution as noted in figure 7. In addition, the bromide/chloride ratios for septic waste and rock salt dissolution (fig. 6) are well below the observed range for the water samples from this study, strongly supporting the idea that animal waste rather than human waste affected by water-softener salt is a source for the observed nitrate.
Figure 8. Relationship of increasing nitrate-N with increasing chloride concentrations. The horizontal line at 10 mg/L nitrate-N indicates the drinking-water limit (USEPA, 2003).
Natural abundance nitrogen isotope analysis is a frequently used method to assist in determining sources of nitrogen to ground water. The isotope analysis involves establishing the ratio of nitrogen-15 (15N) to nitrogen-14 (14N) on the nitrogen in nitrate compared to the ratio observed in the standard, atmospheric nitrogen (air). Comparisons of these values indicate if there is more (positive) or less (negative) 15N in the sample. The values thus indicate whether the sample is enriched (+) or depleted (-) in relation to the standard.
Figure 9 illustrates the range of δ15N values for various sources of nitrogen and associated processes affecting the 15N abundance (Heaton, 1986; Townsend et al., 1996). Generally, biological activities use 14N preferentially, resulting in an increased δ15N value in the remaining nitrogen. Previous work has shown that δ15N values in nitrate from commercial fertilizer sources range from -2 to +8‰, from soil nitrogen are in the range of +5 to +7‰, and from animal waste are generally greater than +10‰ (Heaton, 1986; Herbel and Spalding, 1993).
Figure 9. Range of δ15N values for various sources of nitrogen and the enrichment effects of denitrification and volatilization processes. Ranges of δ15N values from Heaton (1986) and site studies in Kansas (Townsend et al., 1996).
Figure 9 also illustrates the effects of processes in the nitrogen cycle on the resulting δ15N values. Sources such as fertilizer and legumes have very light δ15N signatures (-2 to +2‰). Ground water impacted by fertilizer frequently has measurable nitrate as well (generally greater than 2 mg/L in Kansas, Townsend et al., 1996). Because of possible volatilization of anhydrous ammonia by bacteria, the δ15N values frequently are in the range +2 to +8‰. Legume sources generally have low nitrate concentrations because the nitrogen is often tied up in an organic form, and the plant nodules need to degrade before the nitrogen is released.
Other sources such as human-septic waste or animal waste (pig in fig. 9) have starting δ15N values around +5‰. Animal waste has a high ammonia component, and the release of the ammonia when the waste is produced causes an immediate enrichment of the δ15N because the δ14N in the waste is released by volatilization. As a result, the δ15N of the remaining nitrogen is much higher, in the range of +10‰ or more. In general, animal-waste sources contain high nitrate-N concentrations (commonly more than 10 mg/L).
Volatilization also can occur in soils and rocks with carbonate zones. Carbonates can increase the pH of water towards 8.5, which means the water is more basic. In this range nitrate can be converted to ammonia gas. The lighter 14N isotope is released with the gas. The remaining nitrogen becomes enriched with δ15N of a higher value.
Another process that can result in an enriched δ15N value is denitrification. In this process, bacteria degrade nitrate to nitrogen gases that are released to the atmosphere. The 14N of the nitrate is preferentially utilized, resulting in an enriched δ15N occurring in the remaining nitrate. Signs of possible denitrification are low nitrate values, enriched δ15N values, and high levels of bicarbonate, which is a byproduct of the denitrification process.
Figure 10 is a plot of the nitrogen-15 isotope and nitrogen values for RWD#7 water samples and for some comparison samples: UAN fertilizer and a manure lagoon sample from a feedlot (Townsend and Whittemore, 2005). Points for wells nearest to the RWD#7 well plot within the animal waste zone. The area surrounding the RWD#7 well has been used historically for dairy cattle pastureland.
Figure 10. δ15N and nitrate-N values for sampled wells and sources for comparison. Areas are plotted on the graph for different sources (fertilizer and manure), and processes (volatilization enrichment, and denitrification). The graph position of samples from the study area nearest to the RWD#7 well #1 indicate probable animal-waste source for the high nitrate-N.
The δ15N for the UAN fertilizer sample falls within the range of most fertilizers (-2.6‰) (Heaton, 1986; Kreitler, 1979). Several of the water samples fall within the fertilizer range (fig. 10), suggesting that fertilizer sources may impact water quality, particularly in the more developed area such as where the two monitoring wells occur in secs. 15 and 22 (figs. 1 and 4).
The occurrence of manure in the same δ15N range as the ground-water samples helps to support the idea that animal waste is a potential source for the contamination as indicated by the bromide/chloride (fig. 6) and sulfate/chloride ratios (fig. 7) discussed previously.
Three soil cores were collected in the study area as shown in figure 1. Core A was collected near the RWD#7 well in an actively farmed field (fig. 1). Core B was collected to the west of the RWD#7 in a pasture and near the north-south stream shown in figure 1. Core C was collected south of the Roberts' well near a barn and fenced area that once housed dairy cattle. Figure 11 shows the nitrate-N and ammonium-N concentrations observed at depth in these cores.
Figure 11. Nitrogen content of soil cores A, B, and C from the study area. Locations of the cores are shown on figure 1. The highest nitrogen concentrations are from core C, which was collected in the area with historic land use as a dairy.
Core C has the highest overall concentration of nitrogen (both nitrate-N and ammonium-N). Core C was collected in an area between a barn and holding area that were used for dairy cattle. Core A, collected in the tilled field near the RWD#7 well (fig. 1) shows the next higher concentrations. This core shows fairly low concentrations of nitrate-N that may be related to planting soybeans, a legume, which would tend to preferentially use nitrogen from the soil before making nitrogen with its rhizome bacteria. Core B, across the stream from the RWD#7 well (fig. 1) has the lowest nitrogen concentrations. This may be related to sparse use of the area by cattle, and also the grasses planted at the area may utilize whatever nitrogen is available.
Figure 12 shows the occurrence of nitrogen (nitrate and ammonium), δ15N values, and particle-size analysis (in percent) for core C. This graph illustrates the general occurrence of higher nitrate with increased sand and/or silt percentages (low clay around 325, 425, and 510 inches) and higher ammonium-N with increased clay content. The increases in nitrate in the sandy zones suggest that more oxygenated water is available in these sand zones, resulting in conversion of ammonium-N to nitrate-N.
Figure 12. Graph of nitrogen and δ15N values with depth and particle-size analysis of core C.
The δ15N values generally increase with depth, which may be due to bacterial degradation of the nitrate. This type of increased δ15N signal with depth has been observed in other studies (Rennie et al., 1976; Shearer et al., 1978; Broadbent et al., 1980). However, in the cited studies, the nitrogen content usually decreases with depth indicating denitrification processes have occurred. In this study, the measurable nitrate and ammonium concentrations with depth suggest that the original source of the nitrogen may have had a higher δ15N signature than soil organic nitrogen. Animal waste may be such a source.
Figure 13 is a graph of percent nitrogen versus δ15N values for soil core C, manure samples from the study area, and associated ground-water samples. The formula for converting water nitrogen to percent nitrogen is given in Appendix A. A potential evolution path from manure at the surface and high-percent nitrogen and increased δ15N values with depth in the core to increased δ15N values in the ground water is shown. The percent nitrogen decreases from the surface manure sample to ground water because of bacterial utilization of the nitrogen as 14N and δ15N values in the remaining nitrogen increase as a result of this process. The quantity of nitrogen decreases with depth because of utilization by bacteria. This has been observed in other studies as discussed previously.
Figure 13. Graph showing percent nitrogen versus δ15N values. A potential mixing path of horse- and cattle-manure degradation in soil resulting in enriched δ15N values in ground water is shown. Core C shows increasing δ15N values with depth. Observe decreased-percent nitrogen between manure source, soil-core nitrogen values, and ground water.
The nitrate-N concentrations measured above or near the drinking water limit in conjunction with the observed δ15N values is indicative of likely animal waste sources. This type of correlation has been observed in other studies in Kansas and elsewhere (Townsend and Macko, 2007).
1. Rural Water District #7 well has an increasing nitrate-N concentration over the past few years. Potential sources that could impact the water quality of this well in the small watershed include animal waste from past dairy-farm activities such as manure storage, application of manure to fields in the area, and evapoconcentrated water from a pond most likely used by cattle in the area.
2. Bromide/chloride and sulfate/chloride ratios indicate that evapoconcentration of animal waste is a probable source for higher chloride concentrations observed in some samples, and by association, nitrate contamination in the ground water.
3. The nitrogen-15 natural-abundance method results indicate that animal waste is a probable source for the nitrate observed in wells in the area. A core collected in the area indicates decreasing nitrogen content and increasing δ15N values with depth. The increased δ15N values and decreasing nitrogen content with depth suggest biological enrichment of a high nitrogen source such as animal waste. δ15N values for water samples collected near the RWD#7 well are generally enriched for ground water, and the nitrate-N values are above or near the drinking-water limit of 10 mg/L.
4. Historical land use in the area includes pasture for cattle and a dairy in the upgradient area of the watershed affecting the RWD#7 well (fig. 4). A pond located north of the RWD#7 well was probably associated with dairy-cattle use. The soil derived from sediment remaining from this pond (fig. 4 year 1991 onward) is a likely potential source of nitrate-N produced by oxidation of mineralized ammonium-N attached to clays in the soil. The observed increased chloride concentration in some of the surrounding wells could come from evapoconcentration of animal waste in pond water, movement of this water into the soil, and then slow movement of this water through the soil to ground water.
5. Bromide/chloride ratios indicate that septic tank waste and road salt are not likely sources of contamination for higher chloride concentrations observed in the sampled wells. Past use of fields near the Roberts' well for confinement of horses may be an additional source of animal waste contamination for this well in addition to the dairy that was previously at this site.
6. Because the overall soils are primarily a clay-silt loam with occasional higher sand zones, the permeability of the soil is generally low. Soils in the area where the pond was located may be a source of nitrate and chloride that impacts the ground water. The pond may have been an unlined pond considering the time of installation (sometime between 1959 and 1976). Increased pressure from surface water in the pond may have increased infiltration over time, resulting in movement of nitrogen- and chloride-enriched water (from cattle waste in the pond) into the unsaturated zone and downward to ground water.
7. Fertilizer sources from farming near the well may eventually impact the ground water if high-fertilizer-use crops, such as corn, are not rotated with nitrogen-scavenging plants such as soybeans or alfalfa.
1. A profile of soil cores across the area of the pond may indicate if the pond is one of the potential sources of nitrogen impacting the well. The stream and pond cut into the soil profile and may have intersected a permeable zone that is facilitating nitrogen movement.
2. Mixing of water from the RWD#7 well 1 with water from RWD#7 well 2 to the south will keep the nitrate level below the drinking water limit of 10 mg/L.
3. Crop rotation to prevent buildup of excess nitrogen in the land near the RWD#7 well could prevent a secondary source of contamination to the ground water in the future. Management of crops could be discussed with the farmer using the land.
Bouyoucos, G. J., 1961, Hydrometer method improved for making particle size analysis of soils: Agronomy Journal, v. 54, p. 464-465.
Broadbent, F. E., Rauschkolb, R. S., Lewis, K. A., and Chang, G. Y., 1980, Spatial variability of nitrogen-15 and total nitrogen in some virgin and cultivated soils: Soil Science Society of America Journal, v. 44, p. 403-432.
Davis, S. N., Whittemore, D. O., and Fabryka-Martin, J., 1997, Use of chloride/bromide ratios in studies of potable water: Ground Water, v. 36, no. 2, p. 338-350.
Denne, J. E., Miller, R. E., Hathaway, L. R., O'Connor, H. G., and Johnson, W. C., 1998, Hydrogeology and geochemistry of glacial deposits in northeastern Kansas: Kansas Geological Survey, Bulletin 229, 127 p. [available online]
Foth, H. D., Jacobs, H. S., and Withee, L. V., 1971, Laboratory manual for introductory soil science, 3rd edition, W.C. Brown Co., Dubuque, IA, pp. 12-13.
Gavlak, R. G., Horneck, D. A., and Miller, R. O., and Kotuby-Amacher, J., 2003, Soil, plant and water reference methods for the Western region: WCC 103 publication WREP 125, 2nd edition, Oregon State University, Corvallis, OR, 199 p.
Heaton, T. H. E., 1986, Isotopic studies of nitrogen pollution in the hydrosphere and atmosphere--a review: Chemical Geology, v. 59, p. 87-102.
Herbel, M. J., and Spalding, R. F., 1993, Vadose zone fertilizer-derived nitrate and δ15N extracts: Ground Water, v. 31, no. 3, p. 376-382.
Hoefs, J., 2001, Stable isotope geochemistry, 4th ed.: Springer, 201 p.
Hudak, P. F., 2003, Chloride/bromide ratios in leachate derived from farm-animal waste: Environmental Pollution, v. 121, no. 3, p. 23-25.
Karr, J. D., Showers, W. J., Gilliam, J. W., and Andres, A. S., 2001, Tracing nitrate transport and environmental impact from intensive swine farming using delta nitrogen-15: Journal Environmental Quality, v. 30, p.1163-1175.
Kreitler, C. W., 1979, Nitrogen-isotope ratio studies of soils and groundwater nitrate from alluvial fan aquifers in Texas: Journal of Hydrology, v. 42, p. 147-170.
McCauley, J., 1998, Geologic map of Leavenworth County, Kansas: Kansas Geological Survey, Map M-53, scale 1:50,000.
The Soil, Water, and Agricultural Testing Laboratory (NMSU SWAT), http://swatlab.nmsu.edu/conv.html (verified December 2008).
Panno, S. V., Hackley, K. C., Hwang, H. H., Greenberg, S. E., Krapac, I. G., Landsberger, S., and O'Kelly, D. J., 2006, Characterization and identification of Na-Cl sources in ground water: Ground Water, v. 44, no. 2, p. 176-187.
Panno, S. V., Hackley, K. C., Hwang, H. H., Greenberg, S., Krapac, I. G., Landsberger, S., and O'Kelly, D. J., 2005, Database for the characterization and identification of the sources of sodium and chloride in natural waters of Illinois: Illinois State Geological Survey, Open File Series 2005-1, 21 p., Champaign, Illinois.
Rennie, D. A., Paul, E. A., and Johns, L. E., 1976, Natural nitrogen-15 abundance of soil and plant samples: Canadian Journal of Soil Science, v. 56, p. 43-50.
Shearer, G., Kohl, D. H., and Chien, S. H., 1978, The nitrogen-15 abundance in a wide variety of soils: Soil Science Society of America Journal, v. 42, p. 899-902.
Townsend, M. A., 1997, Nitrate contamination of ground water in the vicinity of Haven, KS: Kansas Geological Survey, Open-file Report 97-79, 28 p.
Townsend, M. A., Sleezer, R. O., and Macko, S. A., 1996, Effects of agricultural practices and vadose zone stratigraphy on nitrate concentration in groundwater in Kansas, USA:. Water Science and Technology, v. 33, no. 4-5, p. 219-226.
Townsend, M. A., and Whittemore, D. O., 2005, Identification of nitrate and chloride sources affecting municipal well waters of the city of McPherson, Kansas: Kansas Geological Survey, Open File Report 2005-34, 24 p. [available online]
Townsend, M. A., and Macko, S. A., 2007, Preliminary identification of ground-water nitrate sources using nitrogen and carbon stable isotopes, Kansas; in, Current Research in Earth Sciences: Kansas Geological Survey, Bulletin 253, part 3. [available online]
Townsend, M. A., Macko, S. A., Ghijsen, R., Thompson, J., Schneider, N., and Schuette, D., 2007, Variations in nitrogen water chemistry, soil content, and plant uptake at a wastewater irrigation site: Geological Society of America Abstracts with Programs, v. 39, no. 3, p. 5
Vengosh, A. and Pankratov, I., 1998, Chloride/bromide and chloride/fluoride ratios of domestic sewage effluents and associated contaminated ground water: Ground Water, v. 36, no. 5, p. 815-824.
Whittemore, D. O., 1984, Geochemical identification of salinity sources; in Salinity in Watercourses and Reservoirs (Proceedings of the International Conference on State-of-the-Art Control of Salinity), R.H. French (ed.): Ann Arbor Science, Butterworth Publishers, Stoneham, MA, p. 505-514.
Whittemore, D. O., 1988, Bromide as a tracer in ground-water studies: Geochemistry and analytical determination: Proceedings Ground Water Geochemistry Conference, National Water Well Association, Dublin, OH, p. 339-360.
Whittemore, D. O., 1995, Geochemical differentiation of oil and gas brine from other saltwater sources contaminating water resources--Case studies from Kansas and Oklahoma: Environmental Geosciences, v. 2, p. 5-31.
U. S. Environmental Protection Agency (USEPA), 2003, Alphabetical list of drinking water contaminants: U. S. Environmental Protection Agency, EPA 816-F-03-016, 6 p., http://www.epa.gov/safewater/consumer/pdf/mcl.pdf (verified December 2008).
Water chemistry analyses for ground- and surface-water samples. Includes manure sample for complete chemistry, and cow and horse manure, and fertilizer for isotope comparisons. δ15N values included.
| Sample ID |
Legal Location | Depth well ft |
LAB SP c |
LAB pH |
SiO2 mg/L |
Ca mg/L |
Mg mg/L |
Na mg/L |
K mg/L |
Sr mg/L |
HCO3 mg/L |
|---|---|---|---|---|---|---|---|---|---|---|---|
| Kerby | T11S-R22E Sec 27 ADDD | 100 | 604 | 7.58 | 26 | 109 | 9.4 | 23.6 | 1.7 | 0.264 | 257 |
| RWD#7 well #1 | T11S-R22E Sec 22 DDCC | 75 | 570 | 7.46 | 24 | 95 | 14.2 | 27.0 | 0.5 | 0.268 | 293 |
| Roberts | T11S-R22E Sec 22 DDAD | 100 | 803 | 6.97 | 29 | 143 | 22.0 | 24.9 | 0.4 | 0.386 | 337 |
| Suburban Well #3 | T11S-R22E Sec 22 BDDC | 70 | 610 | 7.22 | 21 | 98 | 15.4 | 32.0 | 0.6 | 0.285 | 345 |
| Suburban Point of Entry | T11S-R22E Sec 22 BDDC | 617 | 7.35 | 23 | 95 | 15.4 | 30.9 | 0.6 | 0.273 | 345 | |
| Walta | T11S-R22E Sec 23 CBCB | 57 | 703 | 6.88 | 28 | 94 | 16.3 | 56.6 | 0.0 | 0.367 | 397 |
| Dairy | T11S-R22E Sec 15 DDAA | 101 | 768 | 7.5 | 23 | 88 | 13.0 | 36.0 | 0.4 | 0.365 | 241 |
| Hand dug house well | T11S-R22E Sec 15 AAAD | 40 | 1135 | 7.54 | 20 | 190 | 34.8 | 71.6 | 0.8 | 0.441 | 389 |
| Hand dug windmill dairy | T11S-R22E Sec 15 DDAD | 40 | 1031 | 7.17 | 23 | 129 | 15.7 | 103 | 2.9 | 0.410 | 399 |
| MW south side 163rd St. | T11S-R22E Sec 22 BBDD | 75 | 506 | 7.19 | 22 | 75 | 14.5 | 26.1 | 1.7 | 0.238 | 308 |
| MW north side 163rd St. | T11S-R22E Sec 15 CADD | 75 | 576 | 7.3 | 26 | 100 | 12.5 | 28.0 | 0.4 | 0.242 | 385 |
| Heimes | T11S-R22E Sec 21 DCAC | 100 | 536 | 7.53 | 21 | 84 | 11.0 | 34.6 | 0.9 | 0.231 | 382 |
| Ingels | T11S-R22E Sec 16 DAA | 100 | 667 | 7.25 | 20 | 106 | 17.4 | 33.3 | 0.4 | 0.477 | 406 |
| Painter | T 11 S-R22E Sec 16 DBAC | 100 | 552 | 7.38 | 26 | 88 | 9.5 | 35.4 | 0.4 | 0.219 | 384 |
| D. Breuer pond | T11S-R22E Sec 22 DCAA | 126.1 | 6.68 | 9 | 20 | 3.5 | 3.3 | 8.7 | 0.091 | 59.6 | |
| Stoney Meadows Farm pond | T11S-R22E Sec 22 ACBB | 168.3 | 6.7 | ND | 19 | 3.1 | 11.6 | 1.9 | 0.098 | 70.0 | |
| Stream west of RWD#7 well | T 11 S-R22E Sec 22 DCCB | 571 | 6.8 | 8 | 67 | 14.8 | 33.5 | 14.8 | 0.404 | 305 | |
| Manure | 7700 | 7.42 | NA | 160 | 90 | 450 | 1448 | NA | 2624 |
| Sample ID |
SO4 mg/L |
Cl mg/L |
F mg/L |
NO3 N mg/L |
Total Nitrogen mg/L |
Nitrogen % |
Br mg/L |
Br/Cl | Br/Cl *10000 | SO4/Cl | δ15N ‰ |
Total Dissolved Solids mg/L |
|---|---|---|---|---|---|---|---|---|---|---|---|---|
| Kerby | 35.7 | 26.6 | 0.14 | 13.2 | 0.00132 | 0.043 | 0.00161 | 16.05541 | 1.34218 | 16.47 | 381.5 | |
| RWD#7 well #1 | 34.3 | 11.1 | 0.28 | 9.8 | 0.00098 | 0.067 | 0.00607 | 60.70750 | 3.10633 | 19.25 | 359.8 | |
| Roberts | 30.7 | 46.1 | 0.27 | 19.4 | 0.00194 | 0.117 | 0.00254 | 25.40323 | 0.66605 | 26.24 | 518.6 | |
| Suburban Well #3 | 31.5 | 18.3 | 0.26 | 4.1 | 0.00041 | 0.105 | 0.00576 | 57.55694 | 1.71902 | 13.80 | 374.0 | |
| Suburban Point of Entry | 27.0 | 20.3 | 0.27 | 5.4 | 0.00054 | NA | NA | NA | 1.32805 | 14.79 | 379.1 | |
| Walta | 46.9 | 14.3 | 0.45 | 4.3 | 0.00043 | 0.033 | 0.00232 | 23.21292 | 3.28593 | 14.94 | 424.0 | |
| Dairy | 21.3 | 39.2 | 0.34 | 20.7 | 0.00207 | 0.270 | 0.00687 | 68.70075 | 0.54353 | 26.05 | 410.9 | |
| Hand dug house well | 96.1 | 69.0 | 0.32 | 36.5 | 0.00365 | 0.701 | 0.01016 | 101.61453 | 1.39324 | 26.47 | 740.5 | |
| Hand dug windmill dairy | 52.4 | 95.8 | 0.36 | 14.2 | 0.00142 | 0.415 | 0.00433 | 43.33407 | 0.75887 | 24.10 | 630.0 | |
| MW south side 163rd St. | 22.0 | 5.4 | 0.34 | 3.5 | 0.00035 | 0.040 | 0.00738 | 73.77500 | 4.04507 | 9.48 | 311.9 | |
| MW north side 163rd St. | 19.6 | 2.1 | 0.18 | 3.1 | 0.00031 | 0.130 | 0.06250 | 625.00000 | 11.81342 | 1.57 | 372.1 | |
| Heimes | 5.0 | 1.1 | 0.52 | 0.8 | 0.00008 | 0.026 | 0.02363 | 236.32620 | 2.15990 | 3.21 | 345.4 | |
| Ingels | 32.6 | 12.7 | 0.42 | 3.7 | 0.00037 | 0.039 | 0.00305 | 30.51244 | 30.36899 | 8.25 | 406.6 | |
| Painter | 5.7 | 4.9 | 0.36 | 1.9 | 0.00019 | 0.021 | 0.00427 | 42.70696 | 13.64258 | 15.24 | 361.8 | |
| D. Breuer pond | 5.5 | 3.4 | 0.24 | 3.5 | 0.00035 | 0.026 | 0.00759 | 75.89521 | 1.59940 | 3.03 | 92.7 | |
| Stoney Meadows Farm pond | 2.5 | 17.2 | 0.37 | 0.5 | 0.00005 | 0.007 | 0.00041 | 4.07719 | 0.14507 | 11.64 | 89.7 | |
| Stream west of RWD#7 well | 9.0 | 42.6 | 0.32 | 1.076 | 0.00011 | 0.091 | 0.00215 | 21.47158 | 0.21120 | 4.18 | 336.3 | |
| Manure | 209 | 1223 | NA | 160 | 330 | NA | NA | NA | NA | 0.17089 | 22.3 | 5370.0 |
| UAN fertilizer | 10 | -2.59 | ||||||||||
| Cow Manure study area | 1.62000 | 5.91 | ||||||||||
| Horse manure study area | 1.60000 | 5.77 |
NA = no analysis done; ND = below detection limit. Convert mg/L to percent: multiply mg/L by 0.0001 (NMSU SWAT, 2008).
Soil chemical analyses for nitrate-N and ammonium-N. δ15N values for selected intervals for core A.
| Core A | |||||
|---|---|---|---|---|---|
| Depth interval (inches) | Mid-depth inches |
NH4 N PPM |
NO3 N PPM |
δ15N ‰ |
|
| From | To | ||||
| 0 | 12 | 6 | 5.6 | 6.6 | 4.1 |
| 12 | 24 | 18 | 5.0 | 2.4 | 6.6 |
| 24 | 36 | 30 | 4.3 | 1.4 | |
| 36 | 48 | 42 | 4.3 | 1.0 | |
| 48 | 60 | 54 | 3.4 | 0.8 | |
| 60 | 75 | 67.5 | 4.3 | 0.9 | |
| 75 | 90 | 82.5 | 4.9 | 0.7 | |
| 90 | 105 | 97.5 | 5.7 | 1.3 | 7.3 |
| 105 | 120 | 112.5 | 5.7 | 1.1 | |
| 120 | 132 | 126 | 4.9 | 1.5 | 8.2 |
| 132 | 144 | 138 | 5.9 | 1.6 | 9.4 |
| 144 | 156 | 150 | 3.1 | 0.9 | |
| 156 | 168 | 162 | 2.5 | 1.0 | |
| 168 | 180 | 174 | 3.6 | 4.1 | 7.6 |
| 180 | 204 | 192 | 2.3 | 1.5 | |
| 204 | 240 | 222 | 1.9 | 1.2 | |
| 240 | 264 | 252 | 1.9 | 1.0 | |
| 264 | 282 | 273 | 1.8 | 0.9 | |
| 282 | 300 | 291 | 1.5 | 0.6 | |
| 300 | 320 | 310 | 1.8 | 0.9 | |
| 320 | 340 | 330 | 1.8 | 0.8 | |
| 340 | 360 | 350 | 2.0 | 1.4 | |
| 360 | 380 | 370 | 1.5 | 1.4 | |
| 380 | 400 | 390 | 0.4 | 0.9 | |
| 400 | 420 | 410 | 1.4 | 1.6 | |
| 420 | 444 | 432 | 1.8 | 2.0 | |
| 444 | 456 | 450 | 2.4 | 2.2 | 8.3 |
| 456 | 468 | 462 | 1.3 | 1.5 | |
| 468 | 476 | 472 | 1.6 | 0.9 | |
| 476 | 480 | 478 | 1.8 | 2.4 | 8.7 |
| 480 | 492 | 486 | 1.5 | 1.6 | |
Soil chemical analyses for nitrate-N and ammonium-N. δ15N values for selected intervals for core B.
| Core B | |||||
|---|---|---|---|---|---|
| Depth interval (inches) | Mid-depth inches |
NH4 N PPM |
NO3 N PPM |
δ15N ‰ |
|
| From | To | ||||
| 0 | 12 | 6 | 4.7 | 8.3 | 3.2 |
| 12 | 24 | 18 | 4.4 | 3.8 | 4.4 |
| 24 | 36 | 30 | 3.6 | 2.2 | 3.7 |
| 36 | 48 | 42 | 2.7 | 1.4 | |
| 48 | 60 | 54 | 4.1 | 1.1 | |
| 60 | 72 | 66 | 3.8 | 0.9 | |
| 72 | 84 | 78 | 4.1 | 0.9 | |
| 84 | 96 | 90 | 5.1 | 0.8 | |
| 96 | 108 | 102 | 5.5 | 1.0 | |
| 108 | 120 | 114 | 5.6 | 0.9 | |
| 120 | 132 | 126 | 5.3 | 1.0 | |
| 132 | 144 | 138 | 4.0 | 2.3 | 9.1 |
| 144 | 156 | 150 | 4.3 | 0.7 | |
| 156 | 168 | 162 | 2.5 | 0.9 | |
| 168 | 180 | 174 | 1.3 | 0.8 | |
| 180 | 192 | 186 | 2.8 | 1.6 | |
| 192 | 204 | 198 | 2.9 | 0.9 | |
| 204 | 216 | 210 | 4.1 | 1.1 | |
| 228 | 240 | 234 | 1.8 | 0.9 | |
| 240 | 260 | 250 | 2.2 | 1.8 | |
| 260 | 276 | 268 | 3.1 | 1.1 | |
| 276 | 288 | 282 | 3.9 | 1.1 | |
| 288 | 300 | 294 | 1.7 | 3.3 | 8.7 |
| 300 | 312 | 306 | 3.8 | 6.6 | 8.9 |
| 312 | 324 | 318 | 7.1 | 3.9 | 9.2 |
| 360 | 372 | 366 | 3.4 | 2.7 | |
| 384 | 396 | 390 | 5.6 | 4.3 | 10.7 |
| 396 | 408 | 402 | 1.9 | 2.9 | |
| 408 | 420 | 414 | 1.1 | 1.8 | |
| 420 | 432 | 426 | 1.5 | 2.6 | |
| 432 | 444 | 438 | 1.1 | 2.0 | |
| 444 | 456 | 450 | 2.5 | 4.6 | 8.8 |
Soil chemical analyses for nitrate-N and ammonium-N, δ15N values for selected intervals, percent nitrogen, and particle size analyses for core C.
| Core C | |||||||||
|---|---|---|---|---|---|---|---|---|---|
| Depth interval (inches) | Particle | Mid-depth inches |
NH4 N PPM |
NO3 N PPM |
Nitrogen % |
δ15N ‰ |
|||
| From | To | Sand % | Silt % | Clay % | |||||
| 0 | 12 | 28 | 42 | 30 | 6 | 5.1 | 4.9 | 0.11 | 4.9 |
| 12 | 24 | 32 | 38 | 30 | 18 | 3.0 | 1.1 | ||
| 24 | 36 | 34 | 38 | 28 | 30 | 3.2 | 1.0 | ||
| 36 | 48 | 30 | 32 | 38 | 42 | 4.2 | 1.2 | ||
| 48 | 60 | 32 | 32 | 36 | 54 | 2.9 | 0.8 | ||
| 60 | 72 | 34 | 30 | 36 | 66 | 3.7 | 0.8 | ||
| 72 | 84 | 36 | 32 | 32 | 78 | 3.2 | 0.7 | ||
| 84 | 96 | 38 | 28 | 34 | 90 | 4.3 | 1.0 | ||
| 96 | 108 | 36 | 32 | 32 | 102 | 4.7 | 0.9 | ||
| 108 | 120 | 32 | 36 | 32 | 114 | 5.2 | 1.4 | 0.01 | 6.5 |
| 120 | 132 | 30 | 30 | 40 | 126 | 2.9 | 0.7 | ||
| 132 | 144 | 32 | 34 | 34 | 138 | 4.9 | 1.9 | ||
| 144 | 156 | 32 | 34 | 34 | 150 | 5.4 | 2.0 | ||
| 156 | 168 | 36 | 36 | 28 | 162 | 5.3 | 2.1 | ||
| 168 | 180 | 32 | 32 | 36 | 174 | 6.3 | 2.2 | 0.01 | 7.2 |
| 180 | 192 | 30 | 34 | 36 | 186 | 4.2 | 1.1 | ||
| 192 | 204 | 30 | 32 | 38 | 198 | 4.6 | 1.1 | ||
| 204 | 216 | 30 | 34 | 36 | 210 | 6.4 | 2.0 | ||
| 216 | 228 | 28 | 38 | 34 | 222 | 6.2 | 2.5 | ||
| 228 | 240 | 36 | 30 | 34 | 234 | 6.2 | 3.1 | ||
| 240 | 252 | 34 | 32 | 34 | 246 | 4.5 | 1.5 | ||
| 252 | 264 | 36 | 30 | 34 | 258 | 3.5 | 1.3 | ||
| 264 | 276 | 12 | 60 | 28 | 270 | 5.3 | 7.1 | 0.01 | 8.2 |
| 276 | 288 | 22 | 54 | 24 | 282 | 5.3 | 6.7 | ||
| 288 | 300 | 40 | 38 | 22 | 294 | 6.3 | 6.3 | ||
| 300 | 312 | 36 | 40 | 24 | 306 | 5.0 | 1.8 | ||
| 312 | 324 | 52 | 28 | 20 | 318 | 4.3 | 6.9 | ||
| 324 | 336 | 44 | 32 | 24 | 330 | 5.2 | 8.7 | ||
| 336 | 348 | 38 | 36 | 26 | 342 | 6.7 | 12.8 | ||
| 348 | 360 | 36 | 36 | 28 | 354 | 7.2 | 14.0 | 0.01 | 9.3 |
| 360 | 372 | 38 | 34 | 28 | 366 | 3.9 | 2.5 | ||
| 372 | 384 | 32 | 34 | 34 | 378 | 3.8 | 6.5 | 0.01 | 9.7 |
| 384 | 396 | Missing interval | 390 | 3.9 | 5.1 | ||||
| 396 | 408 | 36 | 34 | 30 | 402 | 5.1 | 8.3 | 0.01 | 9.9 |
| 408 | 420 | 36 | 34 | 30 | 414 | 7.8 | 10.8 | ||
| 420 | 432 | 40 | 32 | 28 | 426 | 9.1 | 11.2 | 0.01 | 8.4 |
| 432 | 444 | 42 | 34 | 24 | 438 | 7.4 | 11.9 | ||
| 444 | 456 | 34 | 38 | 28 | 450 | 8.3 | 13.2 | 0.01 | 9 |
| 456 | 468 | 38 | 32 | 30 | 462 | 7.4 | 9.0 | ||
| 468 | 480 | 32 | 38 | 30 | 474 | 7.4 | 10.4 | ||
| 480 | 492 | 36 | 36 | 28 | 486 | 8.2 | 14.1 | 0.01 | 7.9 |
| 492 | 504 | 34 | 34 | 32 | 498 | 8.8 | 11.5 | 0.01 | 8.8 |
| 504 | 516 | 48 | 26 | 26 | 510 | 7.4 | 8.0 | ||
| 516 | 528 | 40 | 34 | 26 | 522 | 7.4 | 8.6 | 0.01 | 10.2 |
| 528 | 540 | 44 | 32 | 24 | 534 | 5.0 | 6.6 | ||
Kansas Geological Survey, Geohydrology
Placed online Jan. 27, 2009
Comments to webadmin@kgs.ku.edu
The URL for this page is http://www.kgs.ku.edu/Hydro/Publications/2008/OFR08_31/index.html