Kansas Geological Survey, Open-file Report 2005-35
by
M. A. Townsend
KGS Open File Report 2005-35
December 2005
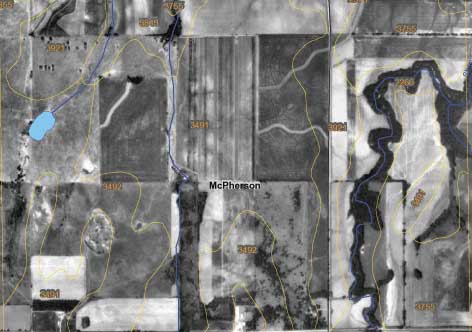
The study was undertaken at the McPherson County Feeders cattle feedlot in January 2005 to determine sources of increasing nitrate-N present in water samples from the monitoring wells at the site. The area is located in McPherson County T18S-R4W-Secs 20, 21, 29, and 30 (fig. 1). The feedlot has a capacity of up to 10,000 head but at the time of the study the owner reported about 8,000 cattle at the site.
Ground water was collected from 11 monitoring wells, 3 irrigation wells and 2 test holes. Two surface-water samples were collected from Sharps Creek. Historically one irrigation well sample was collected nearby in 1984 (Hathaway et al., 1981). The study shows that most of the monitoring wells have been impacted by nitrate-N generally of animal waste origin. The irrigation wells and surface-water samples have measurable nitrogen of inorganic fertilizer origin.
Water level measurements were collected with a Solinst(c) water-level tape at most of the wells prior to sample collection. Water samples were collected by bailer and submersible pump from monitoring and irrigation wells. A Grundfos submersible pump was used in the wells sampled by the Kansas Geological Survey (KGS). Samples were pumped until the water ran clear and the specific conductance and temperature readings were stable for three consecutive readings. The owner used a bailer on several of the wells. A minimum of 3 well volumes were removed before the sample was collected. Monitoring well #7 was sampled twice, once with a bailer and once with a submersible pump in order to evaluate the difference between the two methods. The sample was collected by bailer the first day and then the well was pumped on the second day.
Figure 1. Distribution of monitoring well and surface water samples collected at the McPherson County Feeder operation in McPherson County, Kansas in January, 2005. SW indicates surface water sample. All other dots are monitoring wells, production wells or test holes (see fig. 3) at the site.
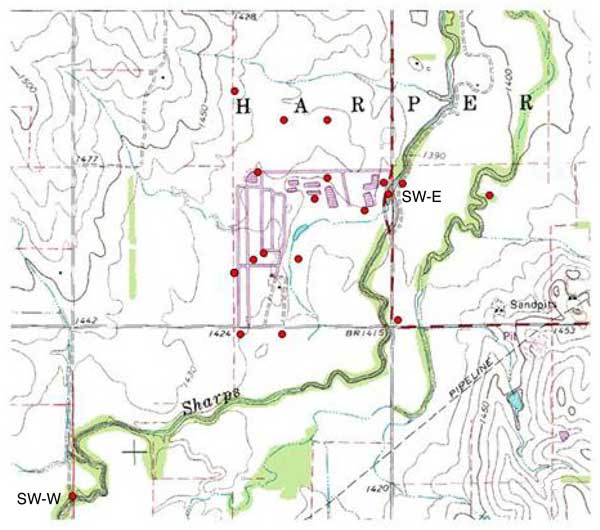
It was not possible to access the creek from the bank. Surface water samples were collected by tossing a cleaned bucket attached to a rope into the creek and retrieving the sample. One sample was collected in the creek between MW#7 site and the MWCK well on the east side of the creek (fig. 1). Another sample was collected approximately 1 mile southwest of the site upgradient of the feedlot (fig. 1).
Water samples were collected for major ion analysis: 500-ml non-preserved sample for cations (calcium, magnesium, potassium, sodium), and a 200-ml sample with 2 ml 10% HCl preservative for nitrate and anions (chloride, bicarbonate, and sulfate). Samples for nitrogen-15 analysis were collected in 100-ml bottles. All samples were kept on ice until return to the KGS. Samples for isotopes were frozen until sent for analysis at the University of Virginia.
The study area is located in south-central Kansas on Quaternary sediments overlying the High Plains aquifer system. The site is situated on alluvial terrace deposits adjacent to Sharps Creek which flows into the Smoky Hill River to the north. The soils are generally silt-loams with moderate permeability (USDA NRCS, 2005). There is a loam soil present on part of the site that has higher percent sand than most of the soils in the feedlot. Soils will be further discussed in a later section.
The depth to water ranges from approximately 7 feet to 25 feet below land surface. Ground-water flow is generally to the east-southeast towards Sharps Creek (fig. 2). However, there are two intermittent drainages on the property: one on the north edge that flows eastward to Sharps Creek and one in the middle of the feedlot that flows north and then east to the creek (figs. 1 and 3). These drainages may be zones of increased permeability and possible pathways for nitrogen to move. The monitoring wells on the north side of the site may be located along a ground-water divide that permits water to move from the north edge of the feedlot towards the northern drainage area. Unfortunately there were not enough data points to indicate flow direction in this area (fig. 2).
Figure 2. Ground-water elevation map for study area January 2005. General flow direction is to the east and southeast. Note that MW#1 and MW#7 are directly down gradient flow line for leakage from lagoons located nearby (fig. 3).
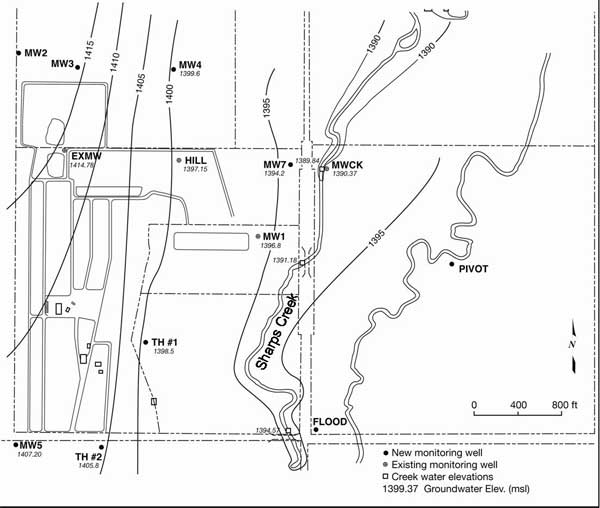
Two irrigation wells are located east of Sharps Creek. One is a flood irrigation well located near Sharps Creek (figs. 2 and 3). The other is a pivot irrigation well located in the center of the section east of Sharps Creek (figs. 1 and 3). The location of these wells east of the feedlot and east of Sharps Creek stream suggests that alluvial water is the major source for these wells and not water impacted by the feedlot. The water chemistry of these wells helps to support this idea (see Water Chemistry section).
Figure 3. Location of monitoring wells (MW), test holes (TH), irrigation wells, and surface water (SW) sampling points at feedlot relative to topography and land use indicated on figure. SW-W and SW-E are western and eastern sampling points on Sharps Creek.
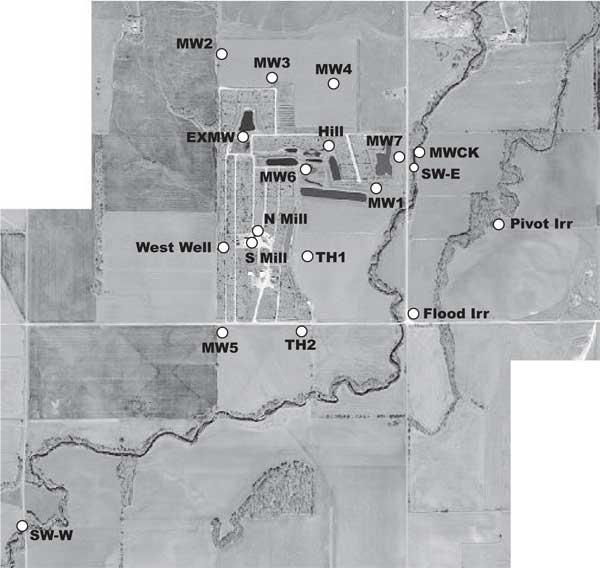
Table 1 shows the crop history and fertilizer and manure use on the fields associated with the feedlot. From 1995 to 2000 several of the fields received an unknown quantity of manure as fertilizer. After 2000, most of the fields received commercial fertilizer. The current practice is to pump the liquid lagoon waste for field application to two fields approximately 2 miles north of the site. Solid manure is hauled and spread on fields located away from the feedlot. The farmer located to the immediate west of the feedlot applies manure in alternate years.
Table 1. Crop history and fertilizer/manure application to fields around feedlot.
| Fertilizer and Manure Applications to Fields Around Feedlot |
Crop History for Area | |||||||
|---|---|---|---|---|---|---|---|---|
| Year | Field S of feedlot |
Field E of feedlot |
Field N of feedlot |
Field S of feedlot |
Field E of feedlot | Field Irr E of blacktop | Field E of Sharps Creek | Field N of Site |
| 2004 | ? | Liquid N | Liquid N | soybeans | corn | corn | corn | wheat |
| 2003 | ? | Liquid N | Liquid N | soybeans | corn | corn | corn | wheat |
| 2002 | Liquid N | Liquid N | Liquid N | milo | corn | corn | corn | milo |
| 2001 | manure | Liquid N | manure | milo | corn | corn | corn | milo |
| 2000 | manure | not owned | soybeans | soybeans | corn | soybeans | ||
| 1999 | manure | corn | corn | corn | soybeans | |||
| 1998 | manure | manure? | milo | |||||
| 1997 | manure | manure? | milo | |||||
| 1996 | manure | manure? | milo | |||||
| 1995 | manure | manure? | wheat | |||||
The area underlying the McPherson County Feeders feedlot is sited on alluvial terrace deposits located to the west and north of Sharps Creek (figs. 1, 2, and 3). The soils are composed of silt, sand, and clay. The most permeable is the Wells loam, is located within the feedlot area near the oldest lagoon at the site (fig. 4). The Wells loam (fig. 5) is predominantly sand (50-60%) with about 20% of silt and clay. As the relative amount of silt and sand in the soil increases, its permeability and therefore the potential for leaching from the site also increases. The Wells loam is the most permeable soil at the site and has the greatest potential for leakage. This soil is located near an old lagoon and some of the cattle pens (figs. 3 and 4). The location of these sources on this soil may have permitted leakage of waste downward to the ground water.
Figure 4. Soil survey from McPherson County, McPherson County Feeders site. Soils include Hord silt loam (3755), Smolan silty clay loam (3921), and Wells loam (3491). http://websoilsurvey.nrcs.usda.gov/app/ (verified September 2005).
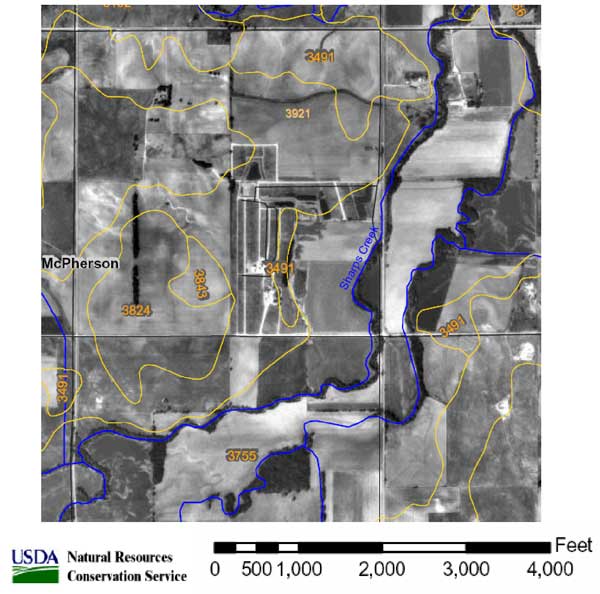
Figure 5. Wells loam. The soil is predominantly sand through most of the profile. It occurs within feedlot complex adjacent to lagoon that is now closed and sealed.
The Wells loam is also the dominant soil in an area 2 miles north of the feedlot where irrigation of liquid waste will be done in the future (fig. 6). Considering the permeability of the soil (fig. 5) careful monitoring of waste application rates and installation of soil-water lysimeters and shallow wells is advised in order to prevent potential future movement of nitrate to the ground water in this area.
Figure 6. Location of irrigation disposal area two miles north of feedlot (T18S R4W) for liquid lagoon waste from feedlot. Dominant soils in the area are Wells loam.
The Hord silt loam (figs. 3 and 7) is located primarily north of the feedlot in the area of monitoring wells #2, #3, and #4. The soil is predominantly silty with equal amounts of sand and clay (about 20% each) with measurable calcium carbonate (about 5%) at depth. The Smolan silty clay loam (figs. 3 and 8) is the dominant soil at the site (fig. 4). This soil is predominantly silt, about 30% clay and 10% sand and measurable calcium carbonate at depth (about 2-3%).
Figure 7. Hord silt loam particle size analysis and carbonate content. The soil is predominantly silt with measurable clay and sand. The soil occurs primarily along Sharps Creek portion of feedlot (to the east of the feedlot).
Figure 8. Smolan silty clay loam soil. The soil is predominantly silt with more clay than sand. The soil is less permeable than Hord or Wells soils.
The ground water at the site is a calcium, magnesium-bicarbonate type water which is typical for this area (Hathaway et al., 1981). Figure 9 shows that the irrigation wells at the site (open diamond) fall in this range as does a 1984 water sample from an irrigation-well to the south of the study area (shown by small arrow on figure 9; Appendix 1). The shift to the left on the graph indicates some increase in total dissolved solids possibly related to evaporation increases from irrigation over the 20 year period.
Figure 9. Modified trilinear diagram. Arrow parallel to chloride axis (Cl) shows increased concentration of chloride, sulfate, and nitrate-N probably due to cation exchange reactions with clays or mixing with animal waste.
The Sharps Creek West sampling point is located approximately 0.5 mile southwest of the feeder operation (figs. 2 and 3). The Sharps Creek East sampling point is located between MW7 and MWCK monitoring well (figs. 2 and 3). Increased specific conductance between the western Sharps Creek sampling point and the eastern sampling point (small arrow near open squares, fig. 9) indicates either an addition of water with a higher dissolved-solids concentration or evaporation concentration increases due to crop use of water in the area (Appendix 1; Thornwaite et al., 1957). This increase is shown on the trilinear diagram by the arrow near the squares (fig. 9). The difference in concentration between the two sampling points is not great but it does indicate that different sources may contribute to the chemistry of the stream.
The wells to the north of the feedlot (MW#3 and MW#4, fig. 9, dots) may be impacted by flow of ground water from the north side of the site towards the creek that borders the north edge of the site (fig 2). This area possibly had manure applied from 1987 through 1994 (Table 1). Potassium, chloride, and nitrate-N concentrations (Appendix 1), and δ15N values (next section) all indicate an animal waste source. The source also may be from the lagoon seepage at the northwest edge of the site (figs. 1, 2, and 3). There is also the possibility of a manure source to west where the farmer applies manure in alternate years.
The group of monitoring wells #1, #5, #7, and MWCK have relatively high chloride, sulfate, bicarbonate, and nitrate-N concentrations (figs. 9 and 10, Appendix 1). These wells are located near the eastern edge or outside the perimeter of the feedlot. Wells #1 and #7 are located downgradient from lagoons (figs. 2 and 3). The nitrate-N concentration of the sample from well #1 is 11.5 mg/L (closer to the lagoon) while the sample from well #7 (slightly farther away from lagoons) is 3.7 mg/L. Well #7 is near a lagoon that was almost empty while well #1 is located downgradient from active lagoons receiving waste. The higher concentrations of sodium, potassium, bicarbonate, chloride, and sulfate strongly suggest that the lagoon waste is influencing the water at these wells (fig. 10; Appendix 1).
Figure 10. Bicarbonate, chloride, sulfate, and nitrate-N concentrations for wells and surface water samples at feedlot site. Samples from wells MWCK, MW1, and MW7 show the most impact by liquid lagoon seepage or manure or liquid waste application. The two northern wells (MW3 and MW4) have the highest nitrate-N concentrations.
Well #5, south of the site, is near a drainage ditch from the site, which may be a source of the increased salts in the water from this location (Appendix 1 and figs. 3, 9, and 10). The sample from this well is slightly enriched in sodium, with increased sulfate, moderate bicarbonate, and high nitrate-N. Chloride and potassium are similar to the values from the irrigation wells. These results suggest that site runoff from the drainage ditch may be the source of contamination for this well with perhaps some mixing of uncontaminated ground water.
The MWCK well is located east of the feedlot and Sharps Creek (fig. 3). The higher chloride, bicarbonate, potassium, and sulfate concentrations are consistent with a manure source (Maulè and Fonstad, 2000; Appendix 1; fig. 10). The field adjacent to this well has had manure applied as fertilizer in the past as well as application of liquid waste. The higher concentration of cations and anions in this water sample in comparison to the Sharps Creek East surface-water sample collected nearby suggests that the stream is not interacting significantly with the aquifer at this point.
Data for samples from the other wells from the feedlot (EXMW, Hill, South Mill, West, and North Mill), as well as the two test holes, plot in a similar position on the trilinear graph (filled diamonds and Xs). These samples have more dissolved chloride, sodium, sulfate, and nitrate-N than the irrigation wells and the surface water samples (fig. 10). Human activities have affected water quality from these sites, perhaps from waste runoff or from manure application to the field to the west of the feedlot (fig. 3).
Figure 11 shows a plot of the sulfate/chloride ratio against chloride. The graph illustrates the increase in chloride content caused by influence of manure or lagoon waste on the water samples. Samples from wells MW#1, MWCK (east of the site), and MW#7 (east of a lagoon but west of Sharps Creek; figs. 3 and 10) have higher chloride contents than the other wells plotted on the graph. The graph indicates that animal waste probably has impacted the ground water at the site because of the overall increase in chloride and sulfate compared to the irrigation water samples.
Figure 11. Sulfate/chloride ratio versus chloride concentration for wells, surface water, and manure samples collected. Wells closest to manure location have highest chloride values and are most impacted by waste.
Natural abundance nitrogen isotope analysis is a frequently used method to assist in determining sources of nitrogen to ground water. The isotope analysis involves establishing the ratio of nitrogen-15 (15N) to nitrogen-14 (14N) for the nitrogen in nitrate compared to the ratio observed in the standard, atmospheric nitrogen (air). Comparisons of these values indicate if there is more (positive) or less (negative) 15N in the sample. The values thus indicate whether the sample is enriched (+) or depleted (-) in relation to the standard.
Isotopic values are reported as δ15N in per mil (‰) (Hoefs, 2001):
Previous work has shown that δ15N values for nitrate from commercial inorganic fertilizer sources are -2 to +8‰ in Kansas, from soil nitrogen range of +5 to +7‰, and from animal waste generally greater than +10‰ (Heaton, 1986, Herbel and Spalding 1993). Other information such as salinity, iron, and manganese concentrations and proximity to potential sources also aid in source determination.
Figure 12 illustrates the effects of processes in the nitrogen cycle on the resulting δ15N values. Sources such as inorganic fertilizer and legumes have very light δ15N signatures (-2 to +2‰). Ground water impacted by fertilizer frequently has measurable nitrate as well (generally greater than the USGS background level of 2 mg/L in Kansas ground water (Mueller and Helsel, 1995; Townsend and Young, 2000; Townsend et al, 2001). Because of possible volatilization of anhydrous ammonia by bacteria and conversion of the ammonia to nitrate, the δ15N values frequently are in the +2 to +8‰.
Figure 12. Range of δ15N values for various sources of nitrogen and the enrichment effects of denitrification and volatilization processes. Ranges of δ15N values from Heaton (1986) and site studies in Kansas (Townsend et al., 1996).
Other sources such as human-septic waste or animal waste (pig in figure 12) have starting δ15N values around +5‰. Because animal waste has a high ammonia component, the release of the ammonia when the waste is produced causes an immediate enrichment of the δ15N because the δ14Nin the waste is preferentially released by volatilization. As a result, the δ15N of the remaining nitrogen is much higher, in the range of +10‰ or more. Generally with animal-waste sources, nitrate-N values are high (commonly more than 10 mg/L) as well.
Volatilization also can occur in soils and rocks with carbonate content. Carbonates can increase the pH of water towards 8.5, which means the water is more basic. In this range nitrate can be converted to ammonia gas. The lighter 14N isotope is released with the gas. The remaining nitrogen becomes enriched with δ15N.
Another process that can result in an enriched δ15N value is denitrification. In this process, bacteria degrade nitrate to nitrogen gases that are released to the atmosphere. The 14N of the nitrate is preferentially utilized resulting in an enriched δ15N in the remaining nitrate. Signs of possible denitrification are low nitrate values, enriched δ15N values, and high levels of bicarbonate, which is a byproduct of the denitrification process.
Figure 13 shows the δ15N isotopic values and nitrate-N concentrations from the monitoring wells (MW), test holes (TH), surface water (Sharps CK east and west), production wells (labeled as to location at site) and irrigation wells. The irrigation wells and samples from Sharps Creek all show a strong inorganic fertilizer signature.
Figure 13. Graph shows nitrate-nitrogen concentration (X-axis) and δ15N values (Y-axis) from feedlot. The areas influenced by potential inorganic fertilizer and animal waste sources are shown. The blue line indicates USGS background level for nitrate-N (2 mg/L) and the red line indicates the USEPA drinking-water limit for nitrate-N (10 mg/L).
The surface-water site south and west of the operation (Sharps CK W) shows low δ15N values in the range of inorganic fertilizer. The surface-water site near the operation (Sharps CK east) shows a very low value (0.57‰), which suggests a possible inorganic fertilizer source, an ammonia source, or rainfall.
Points for monitoring wells and production wells generally fall within the animal waste zone on figure 13. In particular, samples from MW#1, MWCK, MW#3, MW#4, MW#5, and production wells West, South Mill, and Hill plot within this area. This is not unexpected considering that these wells are located in the main portion of the feedlot (fig. 3).
The MWCK well is located in a field east of Sharps Creek. As discussed previously, this site has had manure application and lagoon waste application in the past (Table 1). The MWCK sample has a lower nitrate-N concentration but an enriched δ15N value. This may be related to volatilization of ammonium from the manure, which would release nitrogen gas and result in an increase in δ15N but lower nitrate concentration in the remaining nitrogen in the manure.
Test Hole #2 plots in the area for an animal waste source. This well water may be impacted by flow from the southernmost feeding lot southward towards Sharps Creek (fig. 1, 2), or perhaps overflow from the southernmost ditch bordering the feedlot during heavy rainfall.
MWs #3 and #4 are located north of the feedlot area. Samples from these wells have high nitrate-N and high δ15N values suggesting a manure source. These wells are located in the apparent drainage basin of a stream that flows in an easterly direction and is located north of the feedlot (figs. 1 and 2). The fertilizer history includes manure application in 2001 and perhaps prior to the current ownership (Table 1). The samples have a much higher nitrate-N concentration than most of the other samples at the site (Appendix 1), suggesting that runoff or manure application has reached the ground water.
Points for wells MW7, EXMW, North Mill, and Test Hole #1 plot within the inorganic fertilizer source range. The Test Hole #1 has been fertilized in recent years and may reflect the use of fertilizer in this field east of the feedlot (Appendix 1; fig. 3, Table 1).
The EXMW well is located between a lagoon and a fresh water pond and is not directly downgradient of a lagoon (figs. 2 and 3). The lower δ15N value for this well may reflect either ground water moving from the west that has been impacted by fertilizer or by mixing of water from the fresh water pond, lagoon leakage, and background ground water.
MW7 samples also fall within the fertilizer zone. This well is located between a lagoon and the stream in an area with grass and some trees but no feedlots. The flow distance between the lagoon and MW7 is very short (figs. 2 and 3). It is likely that the signature is related to infiltration of leakage with ammonium that was somewhat affected by volatilization but did not become overly enriched. The source could also be fertilizer from when the site was previously farmed prior to the feedlot. The δ15N values are in the fertilizer range but higher than applied anhydrous or other fertilizers, which would be in the range of +0 to +2‰. The nitrate-N values are above the USGS background level of 2 mg/L (Mueller and Helsel, 1995) suggesting that human activities have impacted the ground water at this site.
The soils at the site have some calcium carbonate at depth (figs. 7 and 8), which could result in chemical enrichment of an ammonium source in the ground water. At this point it is not possible to identify the source solely by isotope values. However, as previously discussed, all of the samples had chloride, sulfate, bicarbonate, and potassium values that strongly suggest an animal waste source impacting the water.
Overall, the general water chemistry and the nitrogen-15 isotope values strongly indicate that the feedlot is having a long-term impact on the ground water in the area. The wells within the confines of the feedlot as well as those located at the edges all show higher levels of chloride, sulfate, potassium, and nitrate-N than the background levels measured at the irrigation wells.
The surface-water chemistry shows an increase in chloride and sulfate concentrations from southwest of the site to east of the site. This may reflect runoff impacts of irrigation or soil moisture enriched by evapoconcentration processes. The nitrogen isotope values for the surface water do not suggest that the contaminated ground water is significantly impacting the stream.
To determine if there is a surface-ground water interaction, further monitoring would be needed.
One concern for the site is the use of waste water from the lagoons for irrigation at an area two miles north of the site. The soil in that location is the most permeable in the area, the Wells loam. Additional monitoring based on wells and soil-water samplers and possibly surface-water sampling from intermittent streams on the site may be necessary determine whether future contamination of ground water occurs in the area.
DASC, 2005, http://www.kansasgis.org/, MrSID Compressed Digital Orthophoto Counties 2002, verified September 2005.
Hathaway, L. R., Waugh, T. C., Galle, O. K., and Dickey, H. P., 1981, Chemical quality of irrigation waters in the Equus Beds area, south-central Kansas: Kansas Geological Survey, Chemical Quality Series 10, 45 p.
Heaton, T. H. E., 1986, Isotopic studies of nitrogen pollution in the hydrosphere and atmosphere: a review: Chemical Geology, v. 59, p. 87-102.
Herbel, M. J., and Spalding, R. F., 1993, Vadose zone fertilizer-derived nitrate and δ15N extracts: Ground Water, v. 31, no. 3, pp. 376-382.
Hoefs, J., 2001, Stable Isotope Geochemistry, 4th ed.: Springer, 201 p.
Maulè, C. P., and Fonstad, T. A., 2000, Impacts of cattle penning on ground-water quality beneath feedlots: Canadian Agricultural Engineering, v. 42, no. 2, p. 87-93.
Mueller, D. K., and Helsel, D. R., 1996, Nutrients in the nation's waters--too much of a good thing?: U.S. Geological Survey Circular 1136, 24 p. http://water.usgs.gov/nawqa/CIRC-1136.html (Verified December 2005).
Piper, A. M., 1944, A graphic procedure in the geochemical interpretation of water analyses: American Geophysical Union, Transactions, v. 25, p. 914-923.
Thornthwaite, C. W., Mather, J. R., and Carter, D. B., 1957, Instructions and tables for computing potential evapotranspiration and the water balance: Climatology, v. 10, p. 181-311.
Townsend, M.A. and Sleezer, R.O., 1995, Drainage basin scale variation of nitrate-N concentrations in ground water, Harvey County, Kansas: Geological Society of America, 1995 Abstracts with Programs of North-Central Section and South-Central Section, University of Nebraska-Lincoln. Lincoln, NE, p. A-90.
Townsend, M.A., Sleezer, R.O., and Macko, S.A., 1996, Effects of agricultural practices and vadose zone stratigraphy on nitrate concentration in groundwater in Kansas, USA: Water Science and Technology, v. 33, no. 4-5, p. 219-226.
Townsend, M. A., Macko, S. A., and Young, D. P., 2001, Distribution and sources of nitrate-nitrogen in Kansas groundwater, in, Optimizing Nitrogen Management in Food and Energy Production and Environmental Protection: Proceedings of the 2nd International Nitrogen Conference on Science and Policy, The Scientific World 1 (S2), p. 216-222.
Townsend, M. A., and Young, D. P., 2000, Assessment of nitrate-nitrogen distribution in Kansas Groundwater, 1990-1998: Natural Resources Research, v. 9, no. 2, p. 125-134.
U.S. Department of Agriculture, Soil Conservation Service, 1983, Soil survey of McPherson County, Kansas, 105 p.
U. S. Department of Agriculture, Natural Resources Conservation Service, Web Soil Survey, http://websoilsurvey.nrcs.usda.gov/app/, (verified September 2005).
U. S. Department of Agriculture, Natural Resources Conservation Service (NRCS), NSSC Soil Survey Laboratory Research Database, http://ssldata.nrcs.usda.gov/, verified September 2005.
U. S. Environmental Protection Agency, 2001, National Primary Drinking Water Standards: http://www.epa.gov/safewater/mcl.html#inorganic (verified December 2002).
Appendix 1. Complete chemical analyses for waters from Mcpherson County Feeders wells, surface water, and manure from the site January 2005.
| ID | Date | Spec Cond μS/cm |
pH | SiO2 ppm |
Ca ppm |
Mg ppm |
Na ppm |
K ppm |
Sr ppm |
HCO3 ppm |
SO4 ppm |
Cl ppm |
NH4-N ppm |
NO3-N ppm |
Total N ppm |
B ppm |
15N ‰ |
|---|---|---|---|---|---|---|---|---|---|---|---|---|---|---|---|---|---|
| MW3 NC | 1/8/2005 | 1170 | 7.60 | 21.1 | 154 | 38.1 | 25.1 | 1.2 | 1.64 | 266 | 28.3 | 37.8 | 78.6 | 54 | 18.9 | ||
| Flood Irr | 1/8/2005 | 627 | 7.60 | 24.9 | 89.8 | 12.8 | 26.8 | 4.6 | 0.57 | 327 | 45.5 | 7.5 | 2.8 | 100 | 0.6 | ||
| Sharps Ck W | 1/8/2005 | 747 | 8.20 | 15.7 | 80.0 | 34.8 | 31.2 | 4.6 | 1.99 | 329 | 97.2 | 25.9 | 1.5 | 115 | 3.4 | ||
| Sharps Ck E | 1/8/2005 | 809 | 8.00 | 15.9 | 89.9 | 33.8 | 36.0 | 5.6 | 1.87 | 337 | 100 | 31.0 | 2.1 | 104 | 0.9 | ||
| Pivot Irr | 1/8/2005 | 680 | 7.80 | 22.3 | 100 | 13.2 | 29.5 | 4.6 | 0.54 | 351 | 50.3 | 17.1 | 2.3 | 81 | 2.0 | ||
| MW5 | 1/8/2005 | 1045 | 7.75 | 19.4 | 112 | 37.0 | 58.0 | 3.1 | 1.71 | 363 | 142 | 38.1 | 21.3 | 135 | 9.9 | ||
| MW4 NE | 1/8/2005 | 1295 | 7.50 | 24.3 | 170 | 47.7 | 33.5 | 1.7 | 2.09 | 397 | 51.6 | 39.4 | 67.7 | 91 | 20.8 | ||
| W Well | 1/8/2005 | 920 | 7.60 | 22.8 | 105 | 27.1 | 58.2 | 1.6 | 1.42 | 403 | 96.5 | 28.2 | 11.1 | 83 | 12.9 | ||
| Test Hole #2 | 1/8/2005 | 970 | 7.95 | 24.6 | 110 | 21.9 | 65.3 | 2.9 | 0.74 | 409 | 46.6 | 7.7 | 36.1 | 128 | 13.5 | ||
| EXMW | 1/8/2005 | 922 | 7.70 | 19.5 | 120 | 23.0 | 46.8 | 1.6 | 1.08 | 416 | 44.4 | 58.3 | 8.7 | 52 | 5.3 | ||
| Hill | 1/8/2005 | 1047 | 7.40 | 21.4 | 136 | 27.7 | 44.3 | 2.8 | 1.33 | 430 | 45.1 | 66.0 | 17.7 | 60 | 18.8 | ||
| N Mill | 1/8/2005 | 937 | 7.60 | 20.5 | 112 | 25.7 | 53.8 | 1.3 | 1.24 | 430 | 64.4 | 38.2 | 11.1 | 86 | 6.6 | ||
| Test Hole #1 | 1/8/2005 | 1140 | 7.60 | 26.2 | 122 | 29.2 | 87.7 | 3.8 | 1.34 | 439 | 156 | 50.6 | 9.9 | 122 | 5.5 | ||
| S Mill | 1/8/2005 | 1015 | 7.60 | 22.6 | 121 | 26.4 | 63.4 | 3.1 | 1.15 | 454 | 98.8 | 34.5 | 10.2 | 82 | 17.8 | ||
| MW1 | 1/8/2005 | 2900 | 7.55 | 17.3 | 250 | 93.4 | 174 | 123 | 2.09 | 783 | 144 | 479 | 11.5 | 86 | 28.3 | ||
| MWCK | 1/8/2005 | 2340 | 7.60 | 27.2 | 337 | 66.0 | 103 | 6.0 | 2.48 | 832 | 142 | 326 | 6.5 | 101 | 26.7 | ||
| MW7A | 1/8/2005 | 2430 | 7.60 | 23.4 | 304 | 91.6 | 103 | 18.1 | 2.82 | 910 | 94.6 | 355 | 5.2 | 142 | 5.8 | ||
| MW7B | 1/8/2005 | 2740 | 7.50 | 24.6 | 326 | 96.1 | 130 | 32.8 | 3.03 | 991 | 110 | 428 | 3.7 | 149 | 8.1 | ||
| Manure | 1/8/2005 | 7700 | 7.42 | 160 | 90 | 450 | 1448 | 2624 | 209 | 1223 | 160 | 330 | 1,000 | 22.3 |
Kansas Geological Survey, Geohydrology
Placed online Feb. 1, 2006
Comments to webadmin@kgs.ku.edu
The URL for this page is http://www.kgs.ku.edu/Hydro/Publications/2005/OFR05_35/index.html