Kansas Geological Survey, Open-file Report 2004-58
by
Donald O. Whittemore
KGS Open File Report 2004-58
Prepared for the Oklahoma Corporation Commission
Saltwater was found in surface and ground waters in an area near the Washita River in Garvin County, Oklahoma, in September 2004. The Oklahoma Corporation Commission (OCC) requested the assistance of the Kansas Geological Survey (KGS) for a geochemical identification of the saltwater source. Fox Hollow Consultants in Oklahoma worked with the OCC in the investigation of the saltwater contamination and collected water and oil-field brine samples that they sent to the KGS for chemical analysis and interpretation. The project name listed for the samples is Newman Drilling and the property name is Lanoy. The general location of the samples is Sec. 14, T. 1 N., R. 1 E. The KGS used the methods of Whittemore (1984, 1988, 1995) to determine the saltwater source. These methods are also cited in Richter and Kreitler (1993); see, for example, pages 28, 66, 102, 128, 131, 132, 181, and 182 in their book.
The KGS received a total of 14 surface and ground waters and three oil-field brines (Table 1). Copies of the chain-of custody forms are in the Appendix. The surface and ground waters included four spring and seep samples, one stream (river tributary) sample, one pond sample, water from a borehole, six samples from different depths and at different times from a plugged water well, and water from a monitoring well.
The KGS analytical laboratory filtered the water and brine samples through 0.45 μm membrane filter paper before analysis. The laboratory measured specific conductance to estimate chloride concentrations and determine dilution factors for the optimum concentration range of the analytical method. Chloride, sulfate, and bromide concentrations were determined using automated colorimetric methods on a Technicon AutoAnalyzer II, except for the sulfate content of the brine samples, which was measured by a turbidimetric procedure. The chloride concentration was adjusted for the effect of bromide in the analytical method. Total inorganic iodine was determined in all samples and iodate was measured in selected samples and used to adjust the bromide correction for the effect of dissolved iodide in the analytical method. The estimated maximum errors in the chloride, sulfate, and bromide determinations are 3%, 4%, and 5%, respectively. The error estimates are based on data periodically collected for samples spiked with standards and results from participation in the standard reference water program of the U.S. Geological Survey. Table 1 lists the KGS laboratory number and chemical data for the water and brine samples.
Table 1. Collection information and chemical data for surface and ground waters and oil brines collected for the Newman Driling/Lanoy project for geochemical identification of saltwater surce requested by the Oklahoma Corporation Commission. All of the samples were collected by G.R. Wollaston of Fox Holllow Consultants. Sp. C. is specific conductance.
| KGS lab number |
Sample ID number |
Collector lab no. |
Sample type |
Sample description | Sample date |
Sp. C. μS/cm |
SO4 mg/L |
Cl mg/L |
Br mg/L |
SO4/Cl | Br/Cl x 10,000 |
|---|---|---|---|---|---|---|---|---|---|---|---|
| 040078 | 1604092301 | 4240 | Spring | Lanoy spring ∼175' below pond | 9/23/04 | 1,065 | 43.8 | 124.8 | 0.430 | 0.351 | 34.5 |
| 040079 | 1604092302 | 4241 | Surface water |
Tributary @ river | 9/23/04 | 39,540 | 60.8 | 15,080 | 55.1 | 0.00403 | 36.5 |
| 040080 | 1604092303 | 4242 | Spring | 3rd spring | 9/23/04 | 1,780 | 61.6 | 351 | 1.38 | 0.1753 | 39.4 |
| 040081 | 1604092304 | 4243 | Surface water |
Lanoy pond @ dam | 9/23/04 | 33,130 | 27.3 | 12,640 | 46.0 | 0.00216 | 36.4 |
| 040082 | 1604092401 | 4244 | Seep | Seep below pond | 9/24/04 | 11,650 | 8.7 | 3,906 | 14.4 | 0.00223 | 36.9 |
| 040083 | 1604092402 | 4245 | Seep | Lanoy pond seep north | 9/24/04 | 56,810 | 155 | 23,260 | 85.0 | 0.00666 | 36.6 |
| 040084 | 1604092403 | 4246 | Ground water |
Lanoy borehole BH 924-1 | 9/24/04 | 1,340 | 97.9 | 35.1 | 0.104 | 2.79 | 29.6 |
| 040085 | 1604092404 | 4247 | Oil brine | Oil Creek | 9/24/04 | 109,600 | <10 | 47,630 | 183 | <0.0002 | 38.5 |
| 040086 | 1604092405 | 4248 | Oil brine | Arbuckle | 9/24/04 | 180,900 | 406 | 101,640 | 368 | 0.00399 | 36.2 |
| 040087 | 1604092406 | 4249 | Oil brine | Mixed brine | 9/24/04 | 109,600 | 24.4 | 46,370 | 181 | 0.000526 | 39.1 |
| 040096 | 1604100401 | 4251 | Ground water |
Plugged water well | 10/4/04 | 71,500 | 47.2 | 28,720 | 95.8 | 0.00164 | 33.4 |
| 040097 | 1604100402 | 4252 | Ground water |
Top water, plugged water well | 10/4/04 | 71,900 | 40.1 | 28,400 | 96.7 | 0.00141 | 33.9 |
| 040098 | 1604100403 | 4253 | Ground water |
Middle water, plugged water well | 10/4/04 | 71,900 | 74.5 | 28,390 | 96.8 | 0.00262 | 34.0 |
| 040099 | 1604100404 | 4254 | Ground water |
Bottom water, plugged water well | 10/4/04 | 71,900 | 42.8 | 28,400 | 96.8 | 0.00151 | 34.1 |
| 040100 | 1604100405 | 4255 | Ground water |
Flowing water, plugged water well | 10/4/04 | 72,700 | 40.0 | 28,730 | 98.2 | 0.00139 | 34.2 |
| 040101 | 2204101801 | 4261 | Ground water |
Plugged water well | 10/18/04 | 74,700 | 75.0 | 29,520 | 100.1 | 0.00254 | 33.9 |
| 050000 | 2204123101 | Ground water |
Green MW #1 | 12/31/04 | 11,200 | 124 | 3,700 | 13.8 | 0.0335 | 37.1 |
The quality of the water samples ranged from fresh (< 1,000 mg/L total dissolved solids based on ∼2/3 of the specific conductance) to highly saline. The chloride concentration range (35.1-29,500 mg/L) is very large in comparison with the much smaller range in the sulfate content (8.7-155 mg/L). The most saline water samples had chloride concentrations greater than seawater (19,400 mg/L). The oil brines had a chloride concentration range of 46,370-101,640 mg/L and a sulfate range of < 10-406 mg/L.
The geochemical methods ofWhittemore (1984, 1988, 1995) for identifying saltwater sources primarily involve plots of the constituent mass ratios bromide/chloride and sulfate/chloride versus chloride concentration, on which are points for the water sample data and curves for the mixing of different source waters. Chloride and bromide are generally the two most conservative constituents in waters, i.e., they are little affected by chemical reactions such as mineral precipitation or adsorption. Although sulfate concentration in water is sometimes subject to oxidation-reduction reactions, sulfate is generally conservative during the mixing of different waters, and is usually much more conservative than dissolved cations. Dissolved cations such as sodium, potassium, calcium, and magnesium are subject to cation exchange in soils and sediments containing clay minerals during the migration of waters, thereby changing their concentrations relative to a conservative constituent such as chloride. Additional information on the properties and applications of dissolved constituents in water for geochemical differentiation of saltwater sources is in Whittemore (1995).
Each curve on a mixing-curve plot such as Figure 1 is generated using an algebraic equation for conservative (non-reactive) mixing of two end-member waters (low chloride and high chloride concentration). The bromide/chloride ratio is multiplied by 10,000 for graphical display to give numbers that range from about one upwards (the lowest mass ratios are near 0.0001 for halite or rock salt dissolution). Logarithmic scales are used in the graphs because they produce a more even distribution (separation) of points for large ranges in concentration and ratios than linear scales.
Figure 1. Bromide/chloride mass ratio versus chloride concentration for surface and ground waters and oil brines collected for the Newman Drilling/Lanoy project. The solid curves represent the mixing of freshwater end points with oil brine end points that are based on the analytical error ±5% natural variation in the ratio of the oil brines. The dashed curves represnt the mixing of freshwater end points with oil brine end points that are based on the analytical error in the ratio range of the oil brines.
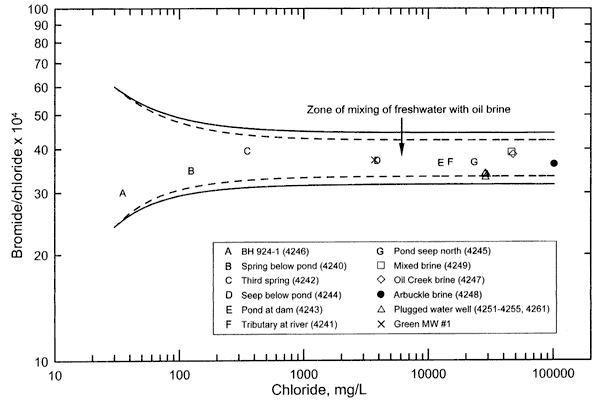
The bromide/chloride ratios for the saline water samples are relatively similar to the ratios for the oil brines collected from the area in comparison with the ratio range for other types of saltwaters and oil brines (Table 1 and Figure 1). Figure 1 is a bromide/chloride versus chloride concentration plot containing points for the surface and ground waters and oil-field brines sampled from the study area. The individual points in Figure 1 are symbols representing the different types of samples in Table 1. The solid curves on Figure 1 represent the mixing of freshwaters with saltwaters; the end points for the saltwaters are based on the maximum estimated analytical error in the chloride and bromide concentrations for the oil brines plus and minus 5%, which represents a possible natural variation in the ratio range of each of the oil brines in the study area. The dashed curves represent the mixing between freshwater end points and oil brine end points that are based only on the maximum analytical error in the ratio range of the oil brines. The end points for freshwater have bromide/chloride ratios that are above and below the range for the waters with the lower chloride concentrations, and that are in the ratio ranges common for waters in the Oklahoma-Kansas region at chloride concentrations near that of the lowest chloride value (for the borehole water).
All of the points for the saline waters from the study area fall within the freshwater and oil-brine mixing zone defined by the two solid curves. Saltwater generated from the dissolution of rock salt by ground water in Kansas and Oklahoma generally has a bromide/chloride mass ratio well below 0.001 (a value of 10 expressed as Br/Cl x 104). (See, for example, figures 1, 3, and 4 in Whittemore, 1995.) Saltwater from the dissolution of road salt has a similarly low bromide/chloride ratio (Knuth et al., 1990). Bromide/chloride mass ratios are usually between 0.003 and 0.01 (30-100 as Br/Cl x 104) in Oklahoma oil brines with >20,000 mg/L chloride content, and can sometimes be as low as near 0.001 and as high as over 150 (10 and 150 as Br/Cl x 104). The similar range of bromide/chloride ratios for the saline waters and oil brines from the study area in comparison with the larger ratio range in other types of saltwaters, along with the graphical relationship displaying this (Figure 1), indicate that the chemistry of the oil brines sent to the KGS for analysis fits well the chemistry of the saltwater source.
The chloride and sulfate concentrations of the five samples collected from the Lanoy plugged well on October 4, 2004, were in a relatively narrow range (71,500-72,700 mg/L and 40.0-74.5 mg/L, respectively). The sample collected on October 18, 2004, had chloride and sulfate contents only slightly higher than the upper range of the other samples. The sulfate/chloride ratios and especially the bromide/chloride ratios were also in a relatively narrow range. This indicates that a similar, consistent source of saltwater affected the well waters, i.e., there was no apparent stratification of saltwater at different depth in the well.
Figure 2 is a sulfate/chloride versus chloride concentration plot containing points for the surface and ground waters and oil-field brines sampled from the study area. The upper solid curve represents the mixing of a low chloride end point with an oil brine end point that is based on the maximum analytical error in the sulfate and chloride concentrations plus a 40% natural variation in the Arbuckle oil brine. The lower solid curve represents the mixing of a freshwater end point with Oil Creek oil brine, assuming a sulfate concentration half of the detection limit of 10 mg/L for this brine. The low-chloride end points were chosen to bracket the freshest water from the study area and to represent a range in possible sulfate/chloride ratios for low-chloride surface and ground waters; the ratios are in a reasonable range for low-chloride waters in Oklahoma. The range in sulfate/chloride ratios at a given chloride concentration is relatively greater than for bromide/chloride ratios at a given chloride value (comparing Figure 1 with Figure 2 ) due to the larger range in sulfate/chloride possible in low-chloride waters and in the oil brines in the area.
Figure 2. Sulfate/chloride mass ratio versus chloride concentration for surface and ground waters and oil brines collectd for the Newman Drilling/Lanoy project. The upper solid curve represents the mixing of a freshwater end point with an oil brine end point that is based on the analytical error plus 40% natural variation in the Arbuckle oil brine. The lower solid curve represents the mixing of a freshwater end point with Oil Creek oil brine (assuming a sulfate concentration half of the detection limit for this brine).
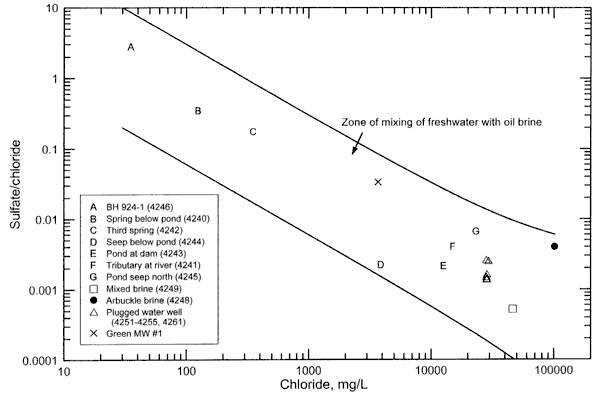
The location of points for the saline surface and ground waters within the zone of mixing of freshwater with oil brine (Figure 2) is consistent with oil brine in the area as the saltwater source. If dissolution of evaporite minerals by ground water in the area were an important source of chloride, the sulfate concentration and the sulfate/chloride ratio of the saline surface and ground waters would be expected to be substantially higher than observed because the minerals anhydrite (calcium sulfate) and gypsum (hydrated calcium sulfate) accompany rock salt in the evaporite deposits of Oklahoma and Kansas. If evapotranspiration concentration of dissolved salts in surface waters, soil moisture, and shallow ground water were an important contributor to the salinity, then the sulfate/chloride ratios would also be substantially greater than observed in the saline waters because both sulfate and chloride would increase during the concentration process (See, for example, Figure 7 in Whittemore, 1995).
Bromide/chloride ratios for the saline surface and ground waters with a chloride concentration greater than a few thousand mg/L reflect mainly the ratio in the saltwater source, as can be seen by the relatively horizontal appearance of the mixing curves at high-chloride values. The bromide/chloride ratios of the saline surface, seep, and ground waters with chloride concentration greater than a few thousand mg/L were closer to the ratio for the Arbuckle oil brine than to the ratios for the other oil brines. This suggests that the chemistry of the saltwater source contaminating the surface and ground waters fits the chemistry of the Arbuckle brine better than the Oil Creek brine and mixed brine. However, the natural ranges in the bromide/chloride ratios in the formations from which the Arbuckle, Oil Creek, and mixed brines were produced are not known because only one sample of each was provided. Comingling of water from brine injection for disposal and water flooding with the original formation brine could also cause spatial variation in the chemistry of the waters within the formations. The bromide/chloride ratio ranges for the Arbuckle, Oil Creek, and mixed brines are most probably between the ratio range of the high-chloride end members of the two solid mixing lines in Figure 1. Additional brine sampling and analysis would be needed to determine the actual ratio ranges of the brines.
The bromide/chloride ratios of the saline waters are more definitive for indicating specific sources for saline waters with high chloride content than the sulfate/chloride ratios. The sulfate/chloride ratios of the saline waters with high-chloride concentration depend both on the ratios in the uncontaminated waters and the saltwater source. The sulfate/chloride ratio for the expected saltwater source for the samples from the flowing abandoned well fall between the ratios of the Arbuckle brine and the mixed brine. As for the bromide/chloride ratio, additional samples of the oil brines in the area would be needed to determine the range in sulfate/chloride in the different formations. Also, samples of uncontaminated ground water would be needed along with the additional oil brine samples to more specifically determine whether the chemistry of the Arbuckle brine fits better as the saltwater source than the other two brines.
The chemistry of the saltwater source contaminating the surface and ground waters of the study area fits the chemistry of the oil-field brines sampled from the area. The chemistry of the sampled waters does not fit a saltwater source such as dissolution of rock salt in evaporite deposits. The interpretation is based on the best methods for geochemical differentiation of oil and gas brines from other saltwater sources affecting water resources in Oklahoma, i.e., mixing curve relationships on plots of bromide/chloride and sulfate/chloride ratios versus chloride concentration. The bromide/chloride ratios of the saline surface and ground waters with a chloride concentration greater than a few thousand mg/L more closely fit the ratio of the Arbuckle brine than the ratios of the Oil Creek and mixed brines. However, additional sampling and analysis of oil brines from different wells would be needed to determine the range in the ratio for these brines to more definitively determine whether the Arbuckle fits better as the saltwater source in comparison with the other oil brines.
Knuth, M., Jackson, J.L., and Whittemore, D.O., 1990, An integrated approach to identifying the salinity source contaminating a ground-water supply: Ground Water 28 (2), 207-214.
Richter, B.C., and Kreitler, C.W., 1993, Geochemical techniques for identifying sources of ground-water salinization: C.K. Smoley (CRC Press, Inc.), Baca Raton, FL, 258 p.
Whittemore, D.O., 1984, Geochemical identification of salinity sources; in R.H. French (ed.), Salinity in Watercourses and Reservoirs (Proceedings of the International Conference on State-of-the-Art Control of Salinity): Ann Arbor Science, Butterworth Publishers, Stoneham, MA, p. 505-514.
Whittemore, D.O., 1988, Bromide as a tracer in ground-water studies: Geochemistry and analytical determination: Proceedings Ground Water Geochemistry Conference, National Water Well Assoc., Dublin, OH, p. 339-360.
Whittemore, D.O., 1995, Geochemical differentiation of oil and gas brine from other saltwater sources contaminating water resources: Case studies from Kansas and Oklahoma: Environmental Geosciences 2, p. 15-31.
Lawrence Hathaway, analytical chemist at the Kansas Geological Survey, analyzed the water and brine samples. The Oklahoma Corporation Commission, Fox Hollow Consultants, and the Kansas Geological Survey reviewed the report.
Chain-of-Custody Forms for Water and Oil Brine Samples (PDF file, 320 kB). To read this file, you will need the Acrobat PDF Reader, available free from Adobe.
Kansas Geological Survey, Geohydrology
Placed online Jan. 9, 2006
Comments to webadmin@kgs.ku.edu
The URL for this page is http://www.kgs.ku.edu/Hydro/Publications/2004/OFR04_58/index.html