Kansas Geological Survey, Open-file Report 2000-83
by
C. D. McElwee, University of Kansas,
and G. M. Zemansky, Compass Environmental, Inc.
Prepared for Presentation at
Fall AGU Meeting, San Francisco, CA
Dec. 16, 2000
KGS Open-file Report 2000-83
Slug tests have been used for many years to attempt characterization of the hydraulic conductivity distribution in a given area. It is well known that slug tests can give misleading results if adequate precautions are not taken and if the best procedures are not followed. We have attempted in recent years to improve many aspects of slug testing allowing better information to be obtained for hydraulic conductivity. In recent slug testing at our field site there appeared to be a dependence on flow direction and head in some results for moderate values of hydraulic conductivity that could not be explained by any known models. Since the hydraulic conductivity in this testing program was not high, the nonlinear model for high conductivity which can give a head dependence to the results was not appropriate. In the first round of slug tests we used solid slugs of varying lengths, which occupied a substantial portion of the casing cross section. At first, we thought the dependence on flow direction and head was due to slug length and friction in the annular space between the slug and casing. However, the work presented here indicates that the above mentioned factors were not responsible for the observed behavior.
In early solid slug data it was observed that for larger initial heads the apparent hydraulic conductivity was less than for smaller initial heads. Also it was observed that there was a directional dependence to the results, with a larger apparent hydraulic conductivity occurring for slug tests causing water to flow to the well. Later slug testing with a packer eliminated the effect of the slug in the wellbore, but the head and directional dependence observed earlier remained for the packer data. This indicated possible well development problems, so a program of well development was instituted and slug tests were performed at various points in this program. Surge blocks, overpumping, and blackflushing were used in the well to attempt to develop it properly.
In the end, we were not able to eliminate the head and directional dependence of the results for the hydraulic conductivity by well development. However, we have arrived at some conclusions that may be helpful to others interpreting slug test data. It appears that well development and slug testing can cause fine material to be moved around in an aquifer. Apparently in our testing and development program, we have created an artificial distribution of fine material that varies with radius, causing the apparent hydraulic conductivity to vary with volume injected or withdrawn. The data that we have collected indicate consistently that slug tests moving water into the aquifer give lower values of hydraulic conductivity. This implies that the mobile fines may move easily into the well but can not move easily away from the well. In fact, in moving away from the well the fines may build up an annulus of higher fine density resulting in a lower apparent hydraulic conductivity. This is very apparent when slug tests injecting water into the well are done repeatedly, causing the apparent hydraulic conductivity to decrease. The best procedure seems to involve alternating between injecting and withdrawing water, starting with the largest withdrawal, and decreasing the volume in successive tests. Well development is appropriate for obtaining representative measurements of hydraulic conductivity. However, over development can cause an artificial hydraulic conductivity distribution near the well. The results of this research should be helpful in recognizing the potential pitfalls in measuring hydraulic conductivity when dealing with aquifers having a mobile fine fraction.
Slug tests have been used for many years to attempt characterization of the hydraulic conductivity distribution in a given area. It is well known that slug tests can give misleading results if adequate precautions are not taken and if the best procedures are not followed. We have attempted in recent years to improve many aspects of slug testing allowing better information to be obtained for hydraulic conductivity. In recent slug testing at our field site there appeared to be a dependence on flow direction and head in some results for moderate values of hydraulic conductivity that could not be explained by any known models. Since the hydraulic conductivity in this testing program was not high, the nonlinear model for high conductivity which can give a head dependence to the results was not appropriate. In the first round of slug tests we used solid slugs of varying lengths, which occupied a substantial portion of the casing cross section. At first, we thought the dependence on flow direction and head was due to slug length and friction in the annular space between the slug and casing. However, the work presented here indicates that the above mentioned factors were not responsible for the observed behavior.
A field site, GEMS, in the Kansas River alluvium (coarse sand and gravel overlain by silt and clay) exhibits very high conductivities and nonlinear behavior for slug tests in the sand and gravel region. It is known from extensive drilling, sampling, and a tracer test that the hydraulic conductivity varies a great deal spatially. Over 70 wells have been completed at various depths. Slug tests have been performed in wells that are completed in the sand and gravel interval using a packer system with a piston for slug test initiation, allowing accurate determination of the initial head and starting time for the slug test.
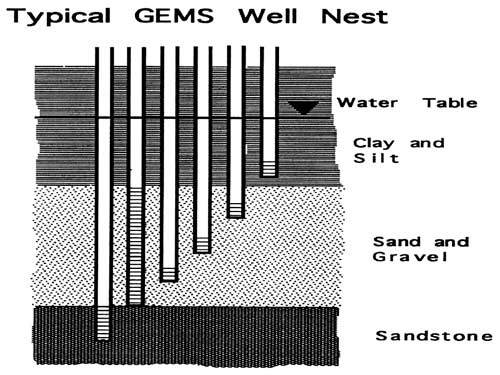
A typical well nest is shown in the next figure. Commonly there is a fully screened well and several wells with short screens completed at various depths. In some nests we may have a well completed into the bedrock.
Well 00-4 is located near the center of GEMS. It is a 2 inch PVC well that is completed with a total casing length of 37.2 feet, which includes a screen that is 2.5 feet long. This well is near the interface between the upper silt and clay and the underlying sand and gravel. Since it is just below the interface we expect a relatively low value for the hydraulic conductivity. It was expected that traditional linear models would give a good description of the slug test results. However, during a slug testing program conducted in the summer of 2000 we noticed some anomalous results and set about trying to understand those results.
In early solid slug data it was observed that for larger initial heads the apparent hydraulic conductivity was less than for smaller initial heads. Also it was observed that there was a directional dependence to the results, with a larger apparent hydraulic conductivity occurring for slug tests causing water to flow to the well. These results are shown in the two following figures, one for slug in tests and one for slug out tests. The results shown are for the average behavior of 5 tests with each slug size.
At first we thought that the dependence on head and direction had something to do with slug length and friction in the annular ring between the slug and the wellbore for slug in tests. We also thought that perhaps nonlinear effects could explain the dependence on initial head. However, the additional work presented in this paper will show that these effects are not the answer to the observed behavior shown above.
In order to see if the presence of a solid slug in the wall was the source of the anomalous behavior previously shown, we performed a series of packer slug tests. In this case a packer with a piston attached to pump rods is used to initiate the slug test. The packer is set at a given depth and inflated to give a good seal on the wellbore walls. At this point, a given quantity of water can be added or subtracted (peristaltic pump) above the packer when the piston is seated. The slug test is initiated by moving the piston out of the packer throat using the pump rods which come to the surface.
Six injection slug tests were run first using 1, 2, and 4 liters of added water. After that, six withdrawal slug tests were run using the same volumes. The results are shown in the two figures below.
This series of injection slug tests shows progressively lower values of hydraulic conductivity. Tests #01 and #04 are both for 1000 ml but are widely separated on the plot, indicating that there is no repeatability. The obvious interpretation is that progressive plugging, due to movement of fine material, is causing a decrease of hydraulic conductivity as the tests proceed. The last few tests are clustered on the plot, indicating that the plugging has begun to reach a maximum.
This series of withdrawal slug tests is reasonably consistent within experimental error. They show very little initial head dependence. This implies that plugging caused by the previous tests has been destroyed by remobilizing the fine material.
The previously shown slug testing with a packer eliminated the effect of a solid slug being present in the wellbore, but the dependence on initial head and flow direction that was observed for solid slugs remained for the packer data. This result indicated possible well development problems. Therefore, a program of well development was instituted. Surge blocks, overpumping, and blackflushing were performed in the well in an attempt to develop it properly. Slug tests were performed at various points in this development program. Those slug tests showed that the results were dependent on the recent history of the well. The last phase of the well development was blackflushing with clean water at about 9 gal/min. At that point, a series of injection (6 tests) and withdrawal (5 tests) slug tests were performed followed by 2 more injection tests. The results are shown in the two figures below and show a definite dependence on the recent well history.
The first 6 tests shown above were performed immediately after 50 minutes of backflushing the well. The measured hydraulic conductivity is extremely low, indicating that fine material has been concentrated in a band at some distance from the well forming a low conductivity skin. Tests #12 and # 13 were performed after the series of withdrawal slug tests shown below. Apparently the withdrawal slug tests have broken up the low conductivity skin, resulting in the measured hydraulic conductivity being much higher and in the normal range for this well.
The slug test results for the withdrawal slug tests shown above are reasonably repeatable; but, they do show a dependence on initial slug height. The results indicate higher measured values for the hydraulic conductivity for the lower initial slug heights. This result may be attributed to a non-uniform radial distribution of fines caused by the development activities the well.
The previous suite of slug tests showed that the results for the measured hydraulic conductivity depended rather strongly on the recent history of withdrawal or injection of water. Therefore, it was decided that the best way to get a consistent measurement of the hydraulic conductivity was to start with the largest volumes and alternate between withdrawal and injection tests. The following figure shows the results of 14 such alternating direction slug tests.
Using this method of alternating between withdrawal and injection tests allowed the most consistent results to be obtained. The above figure shows that there is very good repeatability for the +1000 ml and +2000 ml tests. However the -3000 ml and +3000 ml tests are still separated on the plot, indicating that the measured hydraulic conductivity still depends on the direction of flow for the larger volume tests. The injection slug tests for 3000 ml have a lower hydraulic conductivity, indicating the formation of a lower conductivity skin by concentration of fines at some radius by the inflowing water. The above figure continues to indicate that the hydraulic conductivity depends on the initial slug height. The conclusion is that an artificial distnbution of fines has been created by the well development procedures, with the net result that the hydraulic conductivity varies with radial distance
In the end, we were not able to eliminate the head and directional dependence of the results for the hydraulic conductivity by well development. However, we have arrived at some conclusions that may be helpful to others interpreting slug test data. It appears that well development and slug testing can cause fine material to be moved around in an aquifer. Apparently in our testing and development program, we have created an artificial distribution of fine material that varies with radius, causing the apparent hydraulic conductivity to vary with volume injected or withdrawn. The data that we have collected indicate consistently that slug tests moving water into the aquifer give lower values of hydraulic conductivity. This implies that the mobile fines may move easily into the well but can not move easily away from the well. In fact, in moving away from the well the fines may build up an annulus of higher fine density resulting in a lower apparent hydraulic conductivity. This is very apparent when slug tests injecting water into the well are done repeatedly, causing the apparent hydraulic conductivity to decrease. The best procedure seems to involve alternating between injecting and withdrawing water, starting with the largest withdrawal, and decreasing the volume in successive tests. Well development is appropriate for obtaining representative measurements of hydraulic conductivity. However, over development can cause an artificial hydraulic conductivity distribution near the well. The results of this research should be helpful in recognizing the potential pitfalls in measuring hydraulic conductivity when dealing with aquifers having a mobile fine fraction.
McElwee, C.D., 2000. Analyzing Slug Tests for Maximum Accuracy. Kansas Geological Survey, Open-file Report 2000-26, 22 pp.
McElwee, C.D., 2000. Implementation of a nonlinear model for analysis of slug tests. Kansas Geological Survey, Computer Program Series 2000-01, 99 pp.
Kansas Geological Survey, Geohydrology
Placed online Sept. 21, 2007, original report dated Dec. 2000
Comments to webadmin@kgs.ku.edu
The URL for this page is http://www.kgs.ku.edu/Hydro/Publications/2001/OFR00_83/index.html