Kansas Geological Survey, Open-file Report 94-28c
Part of the Mineral Intrusion Project: Investigation of Salt Contamination of Ground Water in the Eastern Great Bend Prairie Aquifer
Next page: Appendices
A cooperative investigation by The Kansas Geological Survey and Big Bend Groundwater Management District No. 5
KGS Open File Report 94-28c
Released December, 1994
To read this report, you will need the Acrobat PDF Reader, available free from Adobe.
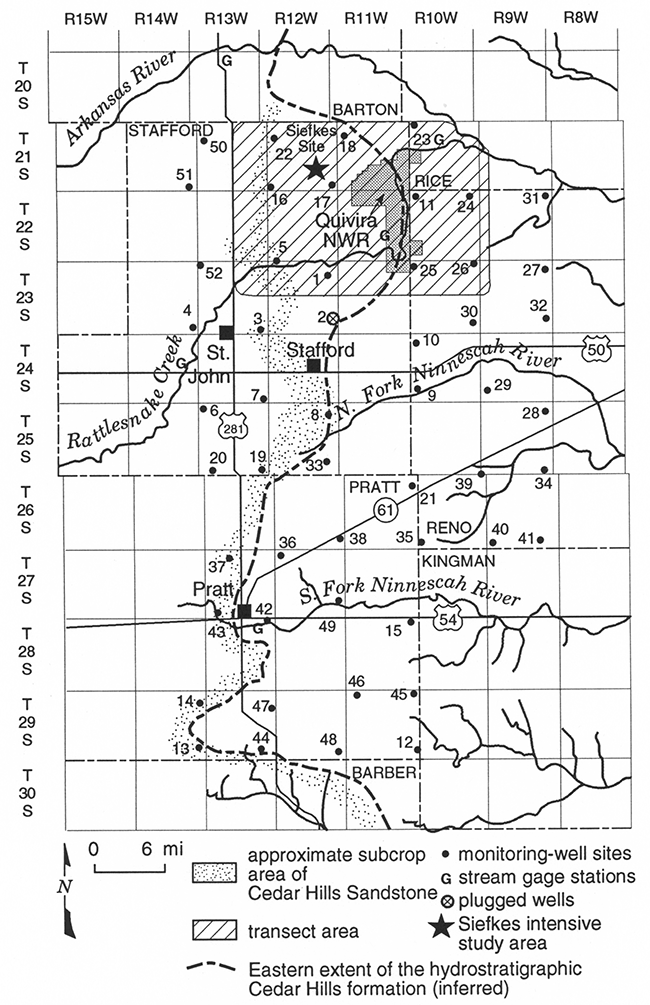
In order to achieve the Mineral Intrusion project goal of describing and understanding the inventories and movements of freshwater and saltwater in the Great Bend Prairie aquifer, an extensive program of water level measurements, well logging, and sampling has been developed for the monitoring well network shown in figure C1. The figure also shows the locations of a "transect area" designated for more intensive study because of the presence of high salinity ground waters, and the Siefkes site where intensive local investigations of the effects of irrigation pumpage on the saltwater interface are being carried out. Additional background information on the objectives, setting and methods of the project may be found in OFR 94-28a and the references contained therein.
Figure C1--Observation wells and other physical features in the area of the KGS/GMD5 monitoring-well network.
This report updates the water-level measurements presented by Young et al. (1993) to include 1994 data, and presents information on variations in transition zone elevations and characteristics based on the results calculated in OFR 94-28b. It also presents the results of chemical analyses showing the relative importance of oil brine and natural salt in the water quality deterioration observed at the Siefkes irrigation well during the limited 1993 pumping season.
The Permian monitoring well at each GMD5 observation well site (except sites 13, 14, and 44) was relogged during March-April, 1994. Sites 13, 14, and 44 have freshwater in the Permian underlying the Quaternary aquifer in southern Pratt County and will be relogged when time permits. Logging of the transect wells is continuing on an approximately monthly schedule. The Siefkes wells are being monitored frequently to determine the effects of irrigation pumping on freshwater/saltwater dynamics. Monitoring and sampling of the Siefkes site during 1994 is particularly important because of the heavy rains, recharge, and minimal pumping which occurred in 1993.
The water levels or heads listed and discussed in this section are actual fluid levels measured in wells, corresponding to the point water level (Hip) discussed in OFR 94-28b. Because there was minimal variation in the saltwater contents or transition zone characteristics (see below), these values provide an adequate basis for assessing changes at individual sites without the calculation of the density effects considered in that report.
As a result of the unusually high precipitation and recharge in 1993, water levels rose in virtually every well in the monitoring well network during 1993 (Young et al., 1993). January 1994 water levels were greater than or approximately equal to January 1993 water levels in all wells. A summary table of water levels from the KGS/GMD5 monitoring-well network is contained in Appendix A. The summary table lists all 1993- 94 water-level measurements from the study wells and calculated hydraulic-head differences among the various wells at each site. Included for comparison are the averages and standard deviations of the heads and head differences for 1993-94 and the period 1987-93. The 1993-94 water levels are typically higher than those in previous years.
Hydrographs illustrating 1993-94 water-level fluctuations in all wells at the saline transition zone sites are contained in Appendix B. The reader is cautioned that the lines connecting data points do not necessarily represent the behavior of the water levels, but are merely for convenience in showing trends. The hydrographs illustrate that at many sites water levels peaked in the second half of 1993 and have fallen over the winter. However, water levels in the rust few months of 1994 were generally higher than they were one year earlier. While water-level rises were synchronous in the different wells at many sites, Permian head changes lagged behind shallow aquifer well changes at certain sites, such as site 16. At sites 4 and 6, where a Cretaceous confining layer apparently separates the Permian from the Great Bend Prairie aquifer, Permian heads fluctuated very little.
Observed net head rises in the shallow aquifer and Permian monitoring wells from January 1993 to January 1994 are summarized in figure C2. The greatest waterlevel rises were observed in the northern part of the study area, north of the North Fork of the Ninnescah River and the Stafford/Pratt county line. Head rises tended to be higher at greater distances from streams or other discharge features. Many of the largest waterlevel rises were observed in the transect area. At site 18, for example, the head in the shallow well showed a net rise of more than 11 feet and the Permian head rose about 8 feet from January 1993 to January 1994.
Figure C2--Net water-level rises in shallow aquifer and Permian monitoring wells from January 1993 to January 1994.
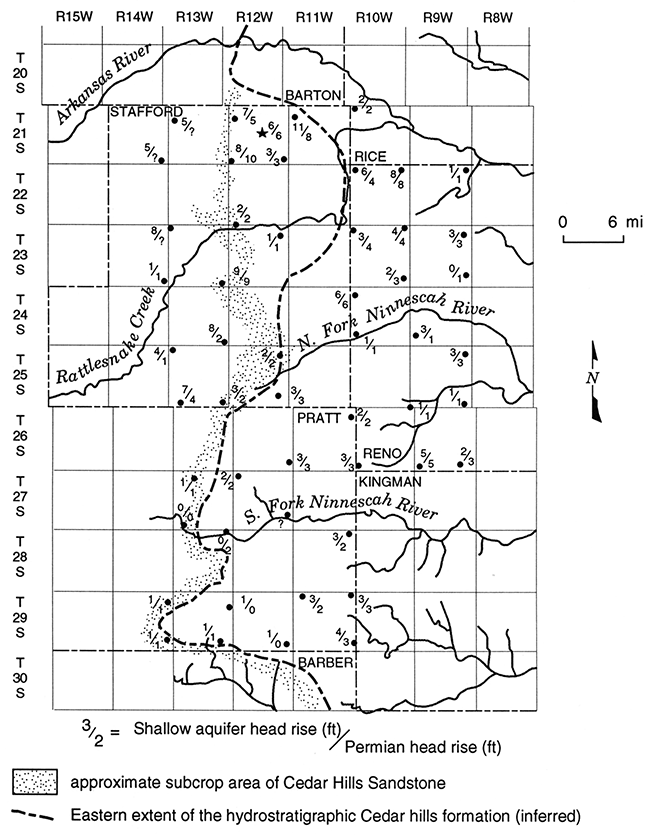
Observed Permian head rises were less than or approximately equal to water-table rises at most sites (figure C2). An exception is site 16, where the head in the shallow aquifer well rose 8 feet and the Permian head rose 10 feet. The Permian head remained above the deep aquifer head at sites 5 and 25. At sites 4 and 18, the average Permian head, previously above the average deep aquifer head, has been below the average deep aquifer head in 1993-94. At sites 6 and 18, the deep aquifer head dropped below the Permian head in August 1993, possibly due to nearby pumping (see well hydro graphs in Appendix B). This phenomenon was observed at site 18 as early as late May in 1994.
The observed rise in the Permian well at site 1 in April 1994 has been attributed to recent agitation (by airlifting) and possibly a broken well casing. Recent airlifting may also be responsible for the observed rise in the Permian well at site 18 in late March. Those wells and wells at sites 5, 7, 9, 11, and 19 were airlifted in late March 1994 in an attempt to redevelop and remove sediment from the bottom of the wells so they could be logged to greater depths.
A primary objective of the logging efforts, particularly at the Siefkes intensive study site (figure C3 and table C1), is to monitor the effects of (irrigation) pumping on the freshwater-saltwater interface or transition zone. Because of extraordinary amounts of precipitation (and subsequent recharge and ponding) in the spring and summer of 1993, pumping was minimal. However, enough irrigation occurred late in the 1993 season and early in 1994 to provide some observations on responses to the start and stop of pumping. Fluid levels at the Siefkes site are presented in table C2 (which also indicates the dates on which irrigation was occurring) and illustrated in figures C4-C6.
Figure C3--Wells in the Siefkes intensive study area. See Table C1 for well identification and characteristics, and Table C2 for 1993-94 data. Contours indicate approximate elevation of land surface (feet above mean sea level).
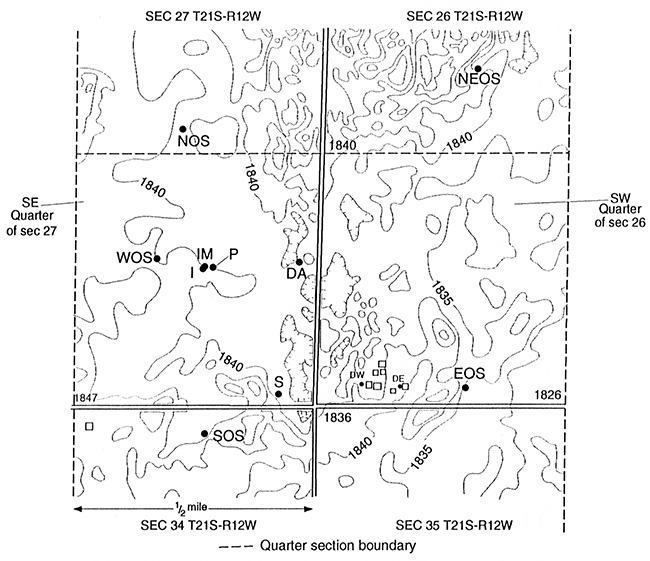
Table C1--Information for wells in the Siefkes intensive study area.
| Legal location | Well | Description | Top of screen (bls) |
Depth (bls) |
Land surface elev. |
Elev. top of screen |
Elev. bottom of well |
|---|---|---|---|---|---|---|---|
| 21-12-27DACC | I | Irrigation well near center of SE Sec. 27 T21S-R12W |
60 | 120 | 1840.7 | 1780.7 | 1720.7 |
| 21-12-27DBDC | WOS | Oil-field supply well west of irrigation well |
65 | 85 | 1839.4 | 1774.4 | 1754.4 |
| 21-12-27DACC | IM | 2" monitoring well near irrigation well |
60 | 1840.7 | 1780.7 | ||
| 21-12-27ACDD | NOS | Oil-field supply well north of irrigation well |
100 | 120 | 1839.0 | 1739.0 | 1719.0 |
| 21-12-27DDDC | S | Stock well southeast of irrigation well |
80 | 90 | 1836.3 | 1756.3 | 1746.3 |
| 21-12-34AAB | SOS | Oil-field supply well south of irrigation well |
80 | 100 | 1841.0 | 1761.0 | 1741.0 |
| 21-12-26CDCC | EOS | Oil-field supply well east of irrigation well |
80 | 100 | 1832.9 | 1752.9 | 1732.9 |
| 21-12-27DACC | P | KGS Permian monitoring well |
198 | 228 | 1839.6 | 1641.6 | 1611.6 |
| 21-12-27DADD | DA | KGS deep aquifer monitoring well |
157 | 167 | 1839.8 | 1682.8 | 1672.8 |
| 21-12-26BDB | NEOS | Oil-field supply well northeast of irrigation well |
90 | 105 | 1840* | 1750* | 1735* |
| *Elevations approximate, estimated from topographic map. All other elevations surveyed. | |||||||
At the Siefkes site, water levels in all wells showed a net increase of about 6 feet between April and October 1993 (large areas of the field and roads at the Siefkes site were under water much of the summer of 1993) and then a drop of about 2 feet over the winter (see table C2 and figures C4-C6). Thus, March-April 1994 water levels were approximately 4 feet higher than March-April 1993 levels. Figures C4-C6 illustrate the rapid drop in water levels when the irrigation well is turned on (for example, in late July 1993 and in April 1994). Among the shallow wells (figs. C4 and C6) the response is greatest in the wells closest to the pumping well. The deep aquifer monitoring well shows a greater response to pumping than does the Permian monitoring well, in spite of being at a greater lateral distance from the pumping well. Both the deep and shallow aquifer heads drop below the Permian head during pumping cycles (see figs. C5 and C6). Notice that such a head reversal was not observed until late July in 1993, but was observed as early as late March in 1994. On May 16, 1994 the deep aquifer head dropped below the Permian head when the irrigation well at the site was not pumping, but when an irrigation well approximately one-half mile west was pumping. Although water levels are still higher than in previous years, 1994 monitoring should yield data more representative of a normal irrigation season than 1993.
By processing and analyzing data from the logs and other available information (especially Whittemore, 1993), Young et al. (1993) designated the sites that exhibit elevated salinity (a chloride concentration greater than 250 mg/L) and/or a freshwater-saltwater interface or transition zone above the bedrock as saline transition zone sites; they are identified in figure C7. At sites 4, 6, 7, 50, 51, and 52, the alluvial aquifer presumably is separated from Permian strata by Cretaceous bedrock (Fader and Stullken, 1978), which can act to confine saltwater below the Great Bend Prairie aquifer. However, chloride concentrations greater than 250 mg/L have been observed above bedrock at sites 4, 6, and 51 (Whittemore, 1993)
The Permian well at site 7 yields very saline water. It was not possible to log to bedrock at site 7 to determine where the saline transition zone is located. However, the water samples collected in 1978 and 1983 from the well screened at the base of the Quaternary aquifer both contained chloride concentrations less than 200 mg/L. Also, the second sample had a chloride content slightly less than that of the first sample. A third sample was collected in March 1994; the chloride concentration was 146 mg/L, within 10% of that in the sample obtained in 1983. This confirmed that the saline transition zone is below the base of the Quaternary aquifer and thus at some position within the bedrock above the screened interval of the Permian welL Therefore this site has been removed from the list of sites with an identified or probable transition zone within the aquifer. Site information and additional chemical data for the new sample from well 2 at site 7 are given in tables C3 and C4, respectively.
Table C2A--1993-94 water levels in wells at the Siefkes site. * x in IRR column indicates irrigation well pumping.
| Depth to water (ft). | ||||||||
|---|---|---|---|---|---|---|---|---|
| IRR* | P | DA | IM | WOS | SOS | EOS | NOS | |
| 3/24/93 | 15.2 | 14.2 | 16.8 | |||||
| 3/26/93 | 18.6 | |||||||
| 4/17/93 | 23.0 | 22.6 | ||||||
| 5/20/93 | 22.2 | 20.9 | ||||||
| 5/25/93 | 22.0 | 20.7 | 12.8 | 11.2 | 14.8 | 16.0 | 13.8 | |
| 7/7/93 | 21.7 | 19.5 | 11.4 | 9.5 | 13.4 | 15.0 | 12.5 | |
| 7/8/93 | 20.9 | 18.8 | 10.8 | 8.9 | 12.7 | 14.4 | 11.8 | |
| 7/27/93 | 19.1 | 18.5 | 10.0 | 8.1 | 11.5 | 13.5 | ||
| 7/29/93 | x | 21.2 | 23.0 | 43.9 | 16.9 | 16.2 | 16.3 | |
| 8/17/93 | x | 21.1 | 21.6 | 45.0 | 17.1 | 15.8 | 16.5 | 15.6 |
| 8/23/93 | 13.4 | 15.4 | 16.4 | |||||
| 8/24/93 | x | 22.4 | 23.4 | 45.9 | 17.8 | 17.3 | 17.2 | |
| 8/25/93 | 22.5 | 22.2 | 44.4 | 17.4 | 16.4 | 16.5 | ||
| 9/10/93 | 18.7 | 17.4 | 10.2 | 8.7 | 11.8 | 13.1 | ||
| 9/18/93 | 18.1 | 16.4 | 9.0 | 7.0 | 10.7 | 12.5 | ||
| 10/12/93 | x | 18.4 | 19.6 | 42.2 | 13.9 | 13.1 | 14.0 | |
| 10/13/93 | 19.1 | 17.5 | 10.4 | 8.2 | 11.9 | 13.5 | 10.7 | |
| 10/14/93 | 18.0 | 17.0 | ||||||
| 10/21/93 | 17.3 | 16.6 | 9.8 | 7.5 | 11.2 | 12.9 | 10.0 | |
| 3/4/94 | 17.5 | 10.8 | 12.2 | 13.8 | 11.1 | |||
| 3/5/94 | 17.9 | 10.8 | 8.6 | |||||
| 3/23/94 | 8.8 | 11.4 | ||||||
| 3/24/94 | 18.4 | 18.3 | 11.4 | 9.2 | 12.7 | 14.4 | ||
| 3/30/94 | 18.4 | 18.0 | 11.3 | 9.0 | 12.6 | 14.2 | 11.5 | |
| 3/31/94 | x | 18.9 | 19.2 | 37.9 | 13.0 | 13.3 | 14.4 | 12.6 |
| 4/1/94 | x | 18.8 | 20.4 | 42.4 | 15.0 | 14.2 | 15.0 | 13.3 |
| 4/8/94 | 9.6 | |||||||
| 4/13/94 | 18.4 | 17.9 | 11.4 | 9.0 | 12.6 | 14.1 | 11.4 | |
| 4/19/94 | 18.6 | 18.4 | 11.7 | 9.3 | 12.8 | 14.5 | 12.0 | |
| 4/21/94 | x | 18.9 | 21.4 | 42.6 | 14.9 | 15.8 | ||
| 4/22/94 | x | 20.4 | 22.8 | 44.7 | 17.3 | 17.2 | 17.0 | |
| 5/16/94 | 18.6 | 18.1 | 11.4 | 14.3 | 11.6 | |||
| 5/19/94 | 19.4 | 19.8 | 13.0 | 11.3 | 14.2 | 15.5 | 13.8 | |
| 5/26/94 | 20.2 | 19.8 | 12.8 | 15.8 | ||||
Table C2B--1993-94 water levels in wells at the Siefkes site. * x in IRR column indicates irrigation well pumping.
| Water level elevations (ft above mean sea level) | ||||||||
|---|---|---|---|---|---|---|---|---|
| IRR* | P | DA | IM | WOS | SOS | EOS | NOS | |
| 3/24/93 | 1825.5 | 1825.2 | 1822.2 | |||||
| 3/26/93 | 1814.3 | |||||||
| 4/17/93 | 1816.6 | 1817.2 | ||||||
| 5/20/93 | 1817.4 | 1818.9 | ||||||
| 5/25/93 | 1817.6 | 1819.1 | 1827.9 | 1828.2 | 1826.2 | 1816.9 | 1825.2 | |
| 7/7/93 | 1817.9 | 1820.3 | 1829.3 | 1829.9 | 1827.6 | 1817.9 | 1826.5 | |
| 7/8/93 | 1818.7 | 1821.0 | 1829.9 | 1830.5 | 1828.3 | 1818.5 | 1827.2 | |
| 7/27/93 | 1820.5 | 1821.3 | 1830.7 | 1831.3 | 1829.5 | 1819.4 | ||
| 7/29/93 | x | 1818.4 | 1816.8 | 1796.8 | 1822.5 | 1824.8 | 1816.6 | |
| 8/17/93 | x | 1818.5 | 1818.2 | 1795.7 | 1822.3 | 1825.2 | 1816.4 | 1823.4 |
| 8/23/93 | 1827.3 | 1825.6 | 1816.5 | |||||
| 8/24/93 | x | 1817.2 | 1816.4 | 1794.8 | 1821.6 | 1823.7 | 1815.7 | |
| 8/25/93 | 1817.1 | 1817.6 | 1796.3 | 1822.0 | 1824.6 | 1816.4 | ||
| 9/10/93 | 1820.9 | 1822.4 | 1830.5 | 1830.7 | 1829.2 | 1819.8 | ||
| 9/18/93 | 1821.5 | 1823.4 | 1831.7 | 1832.4 | 1830.3 | 1820.4 | ||
| 10/12/93 | x | 1821.2 | 1820.2 | 1798.5 | 1825.5 | 1827.9 | 1818.9 | |
| 10/13/93 | 1820.5 | 1822.3 | 1830.3 | 1831.2 | 1829.1 | 1819.4 | 1828.3 | |
| 10/14/93 | 1821.6 | 1822.8 | ||||||
| 10/21/93 | 1822.3 | 1823.2 | 1830.9 | 1831.9 | 1829.8 | 1820.0 | 1829.0 | |
| 3/4/94 | 1822.3 | 1829.9 | 1828.8 | 1819.1 | 1827.9 | |||
| 3/5/94 | 1821.7 | 1829.9 | 1830.8 | |||||
| 3/23/94 | 1830.6 | 1827.6 | ||||||
| 3/24/94 | 1821.2 | 1821.5 | 1829.3 | 1830.2 | 1828.3 | 1818.5 | ||
| 3/30/94 | 1821.2 | 1821.8 | 1829.4 | 1830.4 | 1828.4 | 1818.7 | 1827.5 | |
| 3/31/94 | x | 1820.7 | 1820.6 | 1802.8 | 1826.4 | 1827.7 | 1818.5 | 1826.4 |
| 4/1/94 | x | 1820.8 | 1819.4 | 1798.3 | 1824.4 | 1826.8 | 1817.9 | 1825.7 |
| 4/8/94 | 1829.8 | |||||||
| 4/13/94 | 1821.2 | 1821.9 | 1829.3 | 1830.4 | 1828.4 | 1818.8 | 1827.6 | |
| 4/19/94 | 1821.0 | 1821.4 | 1829.0 | 1830.1 | 1828.2 | 1818.4 | 1827.0 | |
| 4/21/94 | x | 1820.7 | 1818.4 | 1798.1 | 1839.4 | 1826.1 | 1817.1 | |
| 4/22/94 | x | 1819.2 | 1817.0 | 1796.0 | 1822.1 | 1823.8 | 1815.9 | |
| 5/16/94 | 1821.0 | 1821.7 | 1829.3 | 1818.6 | 1827.4 | |||
| 5/19/94 | 1820.2 | 1820.0 | 1827.7 | 1828.1 | 1826.8 | 1817.4 | 1825.2 | |
| 5/26/94 | 1819.4 | 1820.0 | 1827.9 | 1817.1 | ||||
Figure C4--Hydrographs of shallow wells surrounding the Siefkes site. See Figure C3 and Tables C1 and C2 for locations, well characteristics, and data.
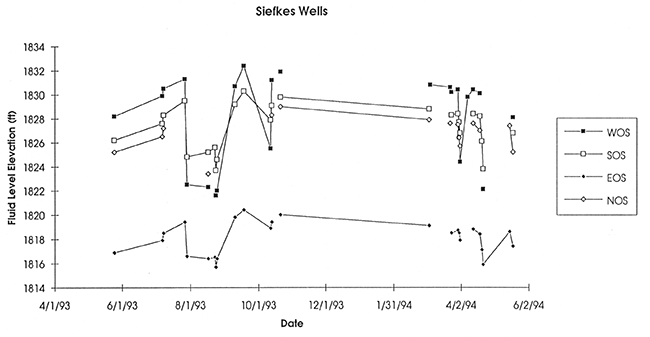
Figure C5--Hydrographs of the Permian (P) and Deep Aquifer (DA--base of Great Bend Prairie Aquifer) monitoring wells at the Siefkes site. See Figure C3 and Tables C1 and C2 for locations, well characteristics, and data.
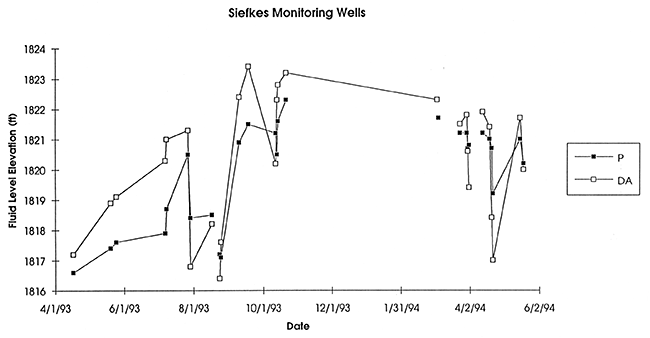
Figure C6--Hydrographs of the Permian (P) and Deep Aquifer (DA--base of Great Bend Prairie Aquifer) monitoring wells at the Siefkes site, rescaled for comparison to the hydrograph of the water table monitoring well (IM) immediately adjacent to the irrigation well. See Figure C3 and Tables C1 and C2 for locations, well characteristics, and data.
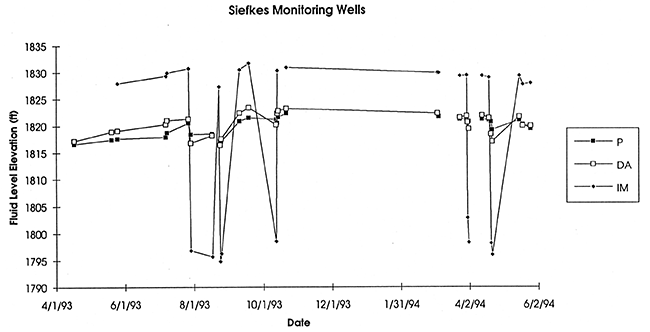
Figure C7--Monitoring well sites and site numbers, indicating the saline transition zone sites.
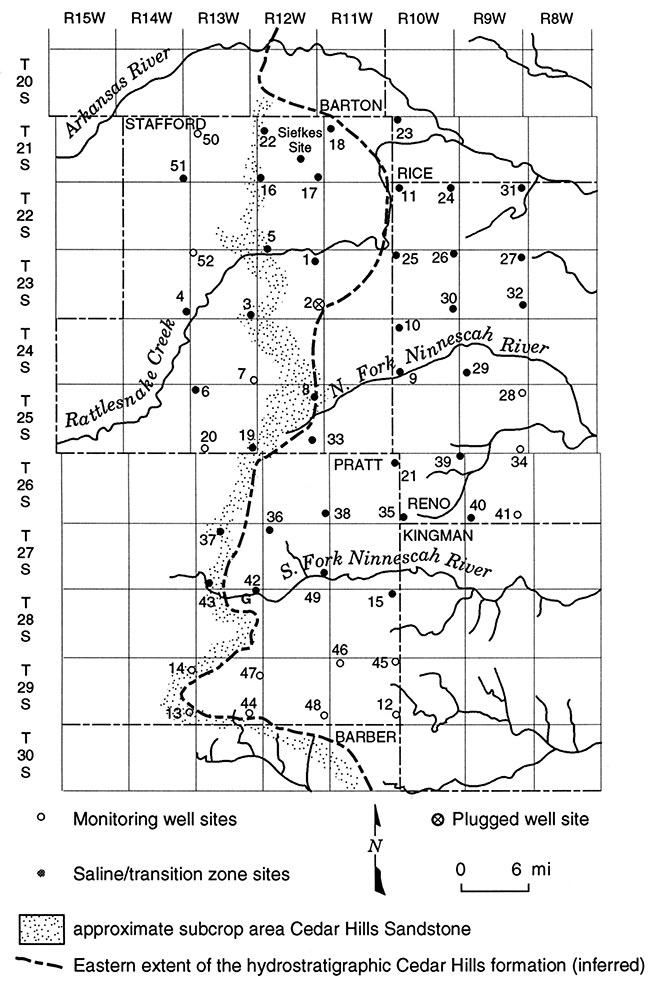
Table C3--Identification and Information for Sites Sampled for Water Chemistry in the Mineral Intrusion Study. SS = Siefkes Site.
| Well ID | Legal location | Well description | Well depth ft. |
|---|---|---|---|
| SS-I | 21S-12W-27DACC | Siefkes irrigation well | 120 |
| SS-IM | 21S-12W-27DACC | Siefkes irrigation observ. well | 60 |
| SS-P | 21S-12W-27DACC | Permian observation well | 228 |
| SS-DA | 21S-12W-27DADD | Aquifer base observation well | 167 |
| SS-S | 21S-12W-27DDDC | Siefkes stock well | 90 |
| SS-WOS | 21S-12W-27DBDC | Oil field supply well W | 85 |
| SS-EOS | 21S-12W-26CDCC | Oil field supply well E | 100 |
| SS-NOS | 21S-12W-27ACDD | Oil field supply well N | 120 |
| SS-DE | 21S-12W-26CC | Siefkes domestic well E | 90 |
| SS-DW | 21S-12W-26CC | Siefkes domestic well W | 96 |
| SS-WI | 21S-12W-27C | Irrigation well W | 101 |
| SS-SI | 21S-12W-34A | Irrigation well S | |
| SS-OB1 | 21S-12W-34A | Oil brine, tank near disposal well | |
| 7-2 | 24S-13W-36DDDD | KGS/GMD5 mono well 7-2 | 154 |
| 19-1 | 25S-13W-36DCCC | KGS/GMD5 mono well 19-1 | 185 |
Table C4--Chemical Properties and Constituent Concentrations in Water Samples Collected for the Mineral Intrusion Study. Samples are listed in chronological order of collection. See table C3 for site information listed according to well identification.
| Well ID | Date collected |
Sample time or information |
Lab Sp.C. uS/cm |
Lab pH |
Ca mg/L |
Mg mg/L |
Na mg/L |
K mg/L |
Sr mg/L |
HCO3 mg/L |
Cl mg/L |
SO4 mg/L |
NO3 mg/L |
Br mg/L |
I mg/L |
|---|---|---|---|---|---|---|---|---|---|---|---|---|---|---|---|
| SS-WOS | 03-23-93 | 750 | 95.6 | 11.1 | 130 | 0.096 | 0.001 | ||||||||
| SS-S | 03-23-93 | 1130 | 238.2 | 10.1 | 26.6 | 0.860 | 0.005 | ||||||||
| SS-DE | 04-15-93 | 820 | 116.0 | 14.5 | 47.9 | 0.320 | 0.003 | ||||||||
| SS-DW | 04-15-93 | 770 | 125.7 | 8.0 | 17.4 | 0.390 | 0.002 | ||||||||
| SS-IM | 04-13-93 | 680 | 90.6 | 9.3 | 107 | 0.087 | 0.001 | ||||||||
| SS-EOS | 04-15-93 | 1320 | 308 | 14.2 | 10.2 | 0.910 | 0.002 | ||||||||
| SS-NOS | 04-15-93 | 680 | 95.0 | 14.4 | 29.8 | 0.240 | 0.003 | ||||||||
| SS-P | 04-14-93 | 200 gal* | 55600 | 20960 | 2540 | 3.0 | |||||||||
| SS-P | 04-15-93 | 300 gal* | 60600 | 9.55 | 25240 | 2870 | 1.6 | 3.84 | 0.081 | ||||||
| SS-DA | 04-15-93 | 200 gal* | 37300 | 13620 | 1500 | 0.9 | 2.15 | 0.049 | |||||||
| SS-DA | 04-15-93 | 400 gal* | 38400 | 7.80 | 347 | 162 | 8880 | <12 | 3.20 | 292 | 13940 | 1530 | 0.6 | 2.22 | 0.050 |
| SS-P | 06-02-93 | 70800 | 7.85 | 711 | 370 | 17800 | <25 | 14.1 | 277 | 26670 | 3180 | 0.2 | 4.14 | 0.108 | |
| SS-I | 07-28-93 | 11:45 | 1085 | 7.60 | 136 | 9.5 | 53.2 | 3.4 | 0.52 | 157 | 203.1 | 15.3 | 89.2 | 0.328 | 0.002 |
| SS-I | 07-28-93 | 14:45 | 1085 | 206.7 | 15.6 | 86.4 | 0.337 | 0.001 | |||||||
| SS-I | 07-28-93 | 18:05 | 1105 | 210.8 | 16.2 | 84.1 | 0.343 | 0.001 | |||||||
| SS-I | 07-29-93 | 10:00 | 1135 | 7.55 | 132 | 9.4 | 68.3 | 3.7 | 0.51 | 164 | 220.9 | 17.0 | 78.2 | 0.352 | 0.001 |
| SS-I | 08-23-93 | 9:00 | 1315 | 7.60 | 131 | 10.1 | 102 | 4.3 | 0.55 | 194 | 279.0 | 21.8 | 55.8 | 0.424 | 0.002 |
| SS-I | 08-24-93 | 9:15 | 1350 | 292.9 | 22.7 | 53.6 | 0.432 | 0.002 | |||||||
| SS-I | 08-24-93 | 13:55 | 1345 | 291.6 | 22.8 | 53.8 | 0.430 | 0.002 | |||||||
| SS-I | 08-25-93 | 13:50 | 1350 | 7.60 | 128 | 10.2 | 114 | 4.4 | 0.55 | 182 | 292.9 | 22.8 | 53.2 | 0.436 | 0.002 |
| SS-OB1 | 08-25-93 | 93300 | 7.45 | 2670 | 1140 | 18400 | 152 | 429 | 456 | 36350 | 230 | 137 | 5.560 | ||
| SS-I | 10-12-93 | 15:30 | 1315 | 7.65 | 126 | 9.9 | 105 | 4.3 | 0.55 | 182 | 283.8 | 21.4 | 52.3 | 0.429 | 0.002 |
| 7-2 | 03-24-94 | 14:00 | 937 | 8.10 | 26.9 | 4.3 | 166 | 1.9 | 0.23 | 243 | 146 | 34.4 | 15.5 | ||
| SS-I | 03-31-94 | 9:22 | 900 | 7.60 | 129 | 9.2 | 21.3 | 3.3 | 0.5 | 133 | 135 | 13.2 | 126 | ||
| SS-IM | 03-31-94 | 9:40 | 835 | 130 | 10.0 | 130 | |||||||||
| SS-I | 04-01-94 | 10:15 | 1083 | 203 | 15.7 | ||||||||||
| 19-1 | 04-07-94 | 8:45 | 19300 | 7.80 | 581 | 153 | 3510 | 12.5 | 8.91 | 55.2 | 6213 | 796 | 3.2 | ||
| SS-I | 04-08-94 | 12:10 | 1220 | 132 | 9.9 | 84.9 | 4.1 | 0.55 | 253 | 18.7 | 64.9 | ||||
| SS-I | 04-21-94 | 16:20 | 1110 | 212 | 16.7 | 75.4 | |||||||||
| SS-I | 04-22-94 | 8:40 | 1280 | 266 | 20.6 | 60.5 | |||||||||
| SS-SI | 05-18-94 | ** | 532 | 7.80 | 69.9 | 4.6 | 31.7 | 3.8 | 0.27 | 233 | 33.4 | 13.8 | 25.0 | 0.026 | 0.0009 |
| SS-WI | 05-19-94 | 12:00 | 920 | 7.60 | 123 | 10.1 | 30.7 | 4.0 | 0.52 | 170 | 162.7 | 18.8 | 46.8 | 0.097 | 0.0035 |
| Nitrate concentrations were determined by the ultraviolet spectrophotometric method. Nitrate-N concentrations can be calculated by dividing the nitrate concentration by 4.427. * Amount pumped before sampling. ** Sample collected from upright-mix from two wells. |
|||||||||||||||
Geophysical logging at site 19 indicated a saline transition zone exists near the contact of the Quaternary aquifer and the underlying Permian bedrock (Young et al., 1993). The log analysis showed a marked increase in the water conductivity just above the screened interval of the Permian well. Only one water sample had been collected from the Permian well; the observed chloride concentration (192 mg/L) was much lower than expected based on the distribution of salinity for surrounding Permian observation wells in the GMD5 network and based on the log analysis. The well was further developed in 1994 and then resampled. The analysis (table C4) showed that the water from the Permian at the depth of the well is saline and contains a chloride concentration of 6,210 mg/L. The salinity is close to that in water from the Permian well at site 20, the next site to the west, and fits the general chloride pattern contoured by Whittemore (1993) for the Permian underlying the Quaternary aquifer. Plate 2 in Whittemore (1993) will be revised to reflect the updated information.
Background data for each of the saline transition zone sites are listed in table C5. These data include land surface elevations, elevations of and depths to water and bedrock, and the specific conductance and chloride values of water samples from the Permian wells. Table C6 contains transition zone characteristics and parameter estimates from OFR 94-28b. These data include D1, D2, M0, M1, R, and the depth to the 500 mg/L chloride concentration elevation (based on fitted curves). These values are discussed and defined in OFR 94-28b. Also included is the depth to the 100 mS/m elevation at each of the transition zone sites; this value is read directly from the corrected conductivity profiles. The 100 mS/m Cm' level refers to an aquifer conductance equivalent to a chloride concentration of approximately 3,300 mg/L (see Young et al., 1993). The 500 mg/L elevations listed are estimates based on the curve-fitting approach of the elevation below which fresh water is not expected to occur. See Young et al. (1993) for figures showing the corrected EM logs and water-quality data from earlier measurements.
Table C5--Background data for saline transition zone sites.
| Site | Location | Land Elev |
Date | DTW | Depth to BR |
WL Elev |
BR Elev |
Cond (mS/m) |
Cl (mg/L) |
|---|---|---|---|---|---|---|---|---|---|
| 1 | 23-12-12BAA | 1827 | 3/26/93 | 5.3 | 146 | 1821.7 | 1681 | 3690 | 13200 |
| 3 | 23-13-36DCC | 1898 | 5/19/93 | 22 | 130 | 1876 | 1768 | ND | ND |
| 4 | 23-14-36DDC | 1912 | 4/22/93 | 8.7 | 129 | 1903.3 | 1783 | 7760 | 31000 |
| 5 | 23-12-06BBB | 1855 | 9/17/93 | 1.8 | 181 | 1853.2 | 1674 | 8550 | 41200 |
| 6 | 25-13-06BCB | 1950 | 4/19/93 | 19.3 | 148 | 1930.7 | 1802 | 10200 | 42640 |
| 8 | 25-12-11AAA | 1848 | 4/21/93 | 8.8 | 117 | 1839.2 | 1731 | 10600 | 43800 |
| 9 | 24-10-31CBC | 1755 | 4/25/93 | 9 | 87 | 1746 | 1668 | 1070 | 3280 |
| 10 | 24-10-06DCC | 1790 | 4/25/93 | 18.3 | 156 | 1771.7 | 1634 | 623 | 1710 |
| 11 | 22-10-06CBB | 1763 | 3/27/93 | 13.5 | 208 | 1749.5 | 1555 | 6690 | 25000 |
| 15 | 28-11-01AAA | 1725 | 4/22/93 | 29.7 | 128 | 1695.3 | 1597 | 213 | 466 |
| 16 | 21-12-31CCC | 1872 | 3/25/93 | 12 | 220 | 1860 | 1652 | 8850 | 34800 |
| 17 | 21-12-36DDC | 1804 | 3/25/93 | 11.6 | 114 | 1792.4 | 1690 | 2890 | 9880 |
| 18 | 21-11-07BBB | 1810 | 3/25/93 | 19 | 214 | 1791 | 1596 | 3520 | 12200 |
| 19 | 25-13-36DCC | 1901 | 4/19/93 | 11.7 | 163 | 1889.3 | 1738 | 1930 | 6210 |
| 21 | 26-11-01DDD | 1801 | 5/20/93 | 21.6 | 137 | 1779.4 | 1664 | 3510 | 11700 |
| 22 | 21-12-06CCB | 1855 | 3/25/93 | 16.1 | 215 | 1838.9 | 1640 | 8260 | 32500 |
| 23 | 21-10-06AAD | 1743 | 4/20/93 | 22.4 | 94 | 1720.6 | 1649 | 2130 | 6480 |
| 24 | 22-10-01ADB | 1743 | 4/20/93 | 27.3 | 123 | 1715.7 | 1620 | 631 | 1820 |
| 25 | 23-10-06BBA | 1780 | 3/28/93 | 6.3 | 98 | 1773.7 | 1682 | 4100 | 17400 |
| 26 | 23-10-01AAA | 1738 | 4/20/93 | 6.8 | 177 | 1731.2 | 1561 | 3710 | 13470 |
| 27 | 23-09-01ADA | 1685 | 4/20/93 | 9.9 | 104 | 1675.1 | 1581 | 651 | 1841 |
| 29 | 24-10-36AAA | 1732 | 4/25/93 | 38.6 | 151 | 1693.4 | 1581 | 6000 | 22000 |
| 30 | 23-10-36DAA | 1750 | 4/25/93 | 13.1 | 134 | 1736.9 | 1616 | 652 | 2410 |
| 31 | 22-09-01ADA | 1664 | 4/20/93 | 13.4 | 93 | 1650.6 | 1571 | 652 | 1771 |
| 32 | 23-09-25DDD | 1689 | 4/24/93 | 2.5 | 172 | 1686.5 | 1517 | 715 | 1864 |
| 33 | 25-12-36CBB | 1872 | 5/20/93 | 33.9 | 141 | 1838.1 | 1731 | 425 | 1160 |
| 35 | 26-10-31CCC | 1760 | 4/21/93 | 19 | 153 | 1741 | 1607 | 2140 | 6750 |
| 36 | 27-12-06BAA | 1892 | 4/21/93 | 28 | 195 | 1864 | 1697 | 5680 | 21800 |
| 37 | 27-13-05CAB | 1971 | 4/21/93 | 58.7 | 240 | 1912.3 | 1731 | 770 | 2310 |
| 38 | 26-12-36ADD | 1844 | 4/21/93 | 26 | 189 | 1818 | 1655 | 691 | 1908 |
| 39 | 26-10-01AAA | 1679 | 10/22/93 | 3.2 | 55 | 1675.8 | 1624 | 3630 | 12300 |
| 40 | 26-09-31DCC | 1735 | 4/22/93 | 56.2 | 158 | 1678.8 | 1577 | 272 | 663 |
| 42 | 28-13-01CBA | 1829 | 4/22/93 | 13.1 | 160 | 1815.9 | 1669 | 1550 | 4900 |
| 43 | 27-13-31DDD | 1872 | 4/22/93 | 5 | 65 | 1867 | 1807 | 750 | 2198 |
| 49 | 27-12-35AAA | 1737 | 7/7/93 | -1.3 | 105 | 1738.3 | 1632 | 8480 | 32700 |
| 51 | 21-14-36DDD | 1916 | 3/26/93 | 17.3 | 200 | 1898.7 | 1716 | ND | ND |
| SP | 21-12-27DACC | 1840 | 9/18/93 | 9 | 186 | 1831 | 1654 | 7080 | 26670 |
| SDA | 21-12-27DADD | 1840 | 9/18/93 | 3840 | 13940 | ||||
| DTW = Depth to water (feet below land surface) in shallow wells. Some values estimated. Water levels in all wells are listed in Appendix B. COND = Specific conductance of water from Permian wells and Siefkes deep aquifer well. Cl = Chloride concentration of water from Permian wells and Siefkes deep aquifer well. |
|||||||||
Table C6--Transition zone data.
| Site | Date | D1 | D2 | M0 | M1 | R | 500 mg/L |
100 mS/m |
|---|---|---|---|---|---|---|---|---|
| 1 | 3/26/93 | 90 | 127.7 | 133.18 | 17.07 | 0.9909 | 94.6 | 111.7 |
| 4/15/94 | 90 | 127.7 | 134.54 | 17.89 | 0.9892 | 94.1 | 112 | |
| 3 | 5/19/93 | 94 | 119 | 197.41 | 43.01 | 0.8229 | 100.2 | |
| 4/13/94 | 94 | 119 | 192.14 | 39.93 | 0.8102 | 101.9 | ||
| 4 | 4/22/93 | 80 | 100 | 177.57 | 49.71 | 0.764 | 65.1 | |
| 4/13/94 | 80 | 100 | 165.23 | 44.26 | 0.8814 | 65.1 | ||
| 5 | 9/17/93 | 66 | 106 | 98.88 | 12.64 | 0.972 | 68.3 | 79.6 |
| 10/16/93 | 66 | 106 | 96.89 | 13.02 | 0.9755 | 67.5 | 79.3 | |
| 4/19/94 | 66 | 106 | 97.27 | 12.54 | 0.9754 | 68.9 | 80.4 | |
| 6 | 4/19/93 | |||||||
| 4/13/94 | 78 | 97 | 156.2 | 31.73 | 0.88445 | 84.5 | ||
| 8 | 4/21/93 | 117 | ||||||
| 4/7/94 | 117 | |||||||
| 9 | 4/25/93 | 40 | 79.5 | 90.07 | 17.34 | 0.5944 | 50.9 | 76.5 |
| 4/14/94 | 40 | 79.5 | 88.04 | 16.18 | 0.5655 | 51.4 | 76.4 | |
| 10 | 4/18/93 | 111 | 126 | 164.71 | 24.53 | 0.81843 | 109.2 | |
| 4/7/94 | 111 | 126 | 160.34 | 21.82 | 0.82634 | 111 | ||
| 11 | 3/27/93 | 82 | 167.1 | 216.97 | 60.11 | 0.9277 | 81 | 146.4 |
| 5/20/93 | 82 | 167.1 | 221.95 | 64.42 | 0.9289 | 76.3 | 146.3 | |
| 7/9/93 | 82 | 167.1 | 220.58 | 63.57 | 0.9286 | 76.8 | 146.3 | |
| 7/30/93 | 82 | 167.1 | 220.22 | 63.29 | 0.9279 | 77.1 | 146.2 | |
| 9/22/93 | 82 | 167.1 | 221.78 | 65.08 | 0.9276 | 74.6 | 146.1 | |
| 10/13/93 | 82 | 167.1 | 221.69 | 65.06 | 0.9291 | 74.6 | 146.1 | |
| 4/8/94 | 82 | 167.1 | 226.16 | 66.18 | 0.912 | 76.4 | 146.9 | |
| 16 | 3/25/93 | 122 | 187 | 176.97 | 21.62 | 0.9691 | 128.1 | 146.7 |
| 5/19/93 | 122 | 187 | 177.19 | 21.45 | 0.9695 | 128.7 | 146.7 | |
| 7/8/93 | 122 | 187 | 177.19 | 21.76 | 0.9686 | 128 | 146.7 | |
| 7/31/93 | 122 | 187 | 176.88 | 22.3 | 0.9734 | 126.4 | 145.9 | |
| 9/8/93 | 122 | 187 | 176.03 | 19.33 | 0.9773 | 132.3 | 146.8 | |
| 10/21/93 | 122 | 187 | 176.88 | 22.32 | 0.9704 | 126.4 | 145.8 | |
| 3/31/94 | 122 | 187 | 176.63 | 21.89 | 0.974 | 127.1 | 146.2 | |
| 17 | 3/25/93 | 61 | 100 | 111.1 | 20.37 | 0.9412 | 65 | 84 |
| 5/19/93 | 61 | 100 | 112.15 | 21.58 | 0.9446 | 63.3 | 83.6 | |
| 7/8/93 | 61 | 100 | 112.49 | 21.76 | 0.9447 | 63.3 | 83.5 | |
| 7/28/93 | 61 | 100 | 112.95 | 22.45 | 0.9455 | 62.2 | 83.4 | |
| 9/8/93 | 61 | 100 | 111.01 | 20.18 | 0.9384 | 65.4 | 83.7 | |
| 10/21/93 | 61 | 100 | 111.08 | 20.45 | 0.9409 | 64.8 | 83.6 | |
| 4/1/94 | 61 | 100 | 111.02 | 20.49 | 0.9395 | 64.7 | 83.5 | |
| 18 | 3/25/93 | 107 | 172 | 182.26 | 31.75 | 0.8504 | 110.5 | 143.9 |
| 5/21/93 | 107 | 172 | 183.84 | 33.19 | 0.8618 | 108.8 | 143.7 | |
| 7/9/93 | 107 | 172 | 183.09 | 32.72 | 0.85 | 109.1 | 143.8 | |
| 7/29/93 | 107 | 172 | 183 | 32.62 | 0.844 | 109.2 | 143.8 | |
| 10/14/93 | 107 | 172 | 182.55 | 32.28 | 0.8482 | 109.6 | 143.9 | |
| 4/8/94 | 107 | 172 | 181.63 | 31.23 | 0.8407 | 111 | 144.5 | |
| 19 | 4/19/93 | 142 | 163 | 237.37 | 41.18 | 0.78367 | 144.2 | 163 |
| 4/7/94 | 142 | 163 | 237.49 | 41.55 | 0.78048 | 143.5 | 163 | |
| 21 | 5/20/93 | 80 | 136.1 | 161.27 | 34.2 | 0.9653 | 83.9 | 112.4 |
| 4/7/94 | 80 | 136.1 | 160.13 | 32.16 | 0.9642 | 87.4 | 113.6 | |
| 22 | 3/25/93 | 133 | 204 | 198.15 | 25.65 | 0.9338 | 140.2 | 175.7 |
| 5/21/93 | 133 | 204 | 197.44 | 24.72 | 0.944 | 141.5 | 175.4 | |
| 7/9/93 | 133 | 204 | 197.91 | 24.93 | 0.9262 | 141.5 | 175.7 | |
| 7/30/93 | 133 | 204 | 197.93 | 25.11 | 0.9271 | 141.1 | 175.6 | |
| 10/14/93 | 133 | 204 | 197.08 | 24.43 | 0.938 | 141.8 | 175 | |
| 3/31/94 | 133 | 204 | 197.82 | 24.55 | 0.9523 | 142.3 | 175.1 | |
| 23 | 4/20/93 | 52.5 | 82 | 123.87 | 21.59 | 0.5614 | 75.1 | |
| 4/19/94 | 52.5 | 82 | 158.41 | 40.54 | 0.6778 | 66.7 | ||
| 24 | 4/20/93 | 88 | 112 | 146.88 | 24.41 | 0.86403 | 91.7 | |
| 4/19/94 | 88 | 112 | 148.55 | 25.44 | 0.8805 | 91 | ||
| 25 | 3/28/93 | 8 | 38 | 35.68 | 11.43 | 0.9346 | 9.8 | 25 |
| 7/31/93 | 8 | 38 | 34.9 | 11.43 | 0.901 | 9.1 | 24.6 | |
| 9/14/93 | 8 | 38 | 34.9 | 11.64 | 0.8947 | 8.6 | 24.8 | |
| 10/22/93 | 8 | 38 | 34.91 | 11.57 | 0.8944 | 8.7 | 25.1 | |
| 4/4/94 | 8 | 38 | 35.56 | 11.1 | 0.9477 | 10.5 | 25 | |
| 26 | 4/20/93 | 64 | 102 | 102.11 | 12.63 | 0.9278 | 73.6 | 80.7 |
| 4/15/94 | 64 | 102 | 106.61 | 17.43 | 0.9788 | 67.2 | 79.6 | |
| 27 | 4/20/93 | 53 | 66 | 78.23 | 7.59 | 0.9907 | 61.1 | |
| 4/15/94 | 53 | 66 | 84.09 | 11.19 | 0.9905 | 58.8 | ||
| 29 | 4/25/93 | 94 | 150 | 254.31 | 67.95 | 0.634 | 100.6 | |
| 4/7/94 | 94 | 150 | 248.73 | 64.38 | 0.6457 | 103.1 | ||
| 30 | 4/25/93 | 85 | 132 | 216.98 | 48.91 | 0.5368 | 106.4 | |
| 4/14/94 | 85 | 132 | 204.65 | 42.66 | 0.4906 | 108.2 | ||
| 31 | 4/20/93 | 73 | 90 | 196.27 | 52.74 | 0.8467 | 77 | |
| 4/15/94 | 73 | 90 | 192 | 50.26 | 0.8138 | 78.3 | ||
| 32 | 4/24/93 | 75 | 135 | 158.26 | 31.29 | 0.6085 | 87.5 | |
| 4/19/94 | 75 | 135 | 151.87 | 27.75 | 0.551 | 89.1 | ||
| 33 | 5/20/93 | 120 | 139 | 191.41 | 26.98 | 0.794 | 130.4 | |
| 4/7/94 | 120 | 139 | 176.71 | 18.72 | 0.8117 | 134.4 | ||
| 35 | 4/21/93 | 115 | 142 | 186.37 | 27.45 | 0.8686 | 124.3 | |
| 4/20/94 | 115 | 142 | 188.79 | 28.94 | 0.8685 | 123.3 | ||
| 36 | 4/21/93 | 121 | 188 | 202.18 | 31.62 | 0.9544 | 130.7 | 164 |
| 9/16/93 | 121 | 188 | 199.77 | 28.1 | 0.9635 | 136.2 | 164.1 | |
| 4/14/94 | 121 | 188 | 203.65 | 32.83 | 0.9462 | 129.4 | 164.3 | |
| 37 | 4/21/93 | 212 | 233 | 260.55 | 17.5 | 0.902 | 221 | |
| 4/13/94 | 212 | 233 | 259.04 | 16.66 | 0.9271 | 221.4 | ||
| 38 | 4/21/93 | 150 | 177 | 198.04 | 19.21 | 0.8461 | 154.6 | |
| 4/14/94 | 150 | 177 | 197.33 | 18.81 | 0.8577 | 154.8 | ||
| 39 | 10/22/93 | 55 | ||||||
| 4/20/94 | 55 | |||||||
| 42 | 4/22/93 | 74 | 149 | 187.52 | 37.41 | 0.93 | 102.9 | 139.9 |
| 4/14/94 | 74 | 149 | 188.01 | 37.26 | 0.9392 | 103.7 | 139.9 | |
| 43 | 4/22/93 | 40 | 55 | 61.09 | 7.2 | 0.9387 | 44.8 | |
| 4/19/94 | 40 | 55 | 60.55 | 6.83 | 0.938 | 45.1 | ||
| 49 | 6/22/94 | 40 | 70 | 87.13 | 17.6 | 0.9264 | 47.1 | 102.7 |
| SP | 4/17/93 | 123 | 180 | 167.27 | 16.4 | 0.9766 | 130.2 | 147.9 |
| 5/20/93 | 123 | 180 | 166.63 | 16.22 | 0.9743 | 129.9 | 147.2 | |
| 7/8/93 | 123 | 180 | 166.17 | 15.49 | 0.969 | 131.1 | 147.3 | |
| 7/27/93 | 123 | 180 | 166.04 | 14.99 | 0.968 | 132.1 | 147.2 | |
| 7/29/93 | 123 | 180 | 166.09 | 15.34 | 0.9704 | 131.4 | 146.8 | |
| 9/18/93 | 123 | 180 | 166.63 | 17.19 | 0.9702 | 127.8 | 147.2 | |
| 10/21/93 | 123 | 180 | 166.46 | 17.71 | 0.9655 | 126.4 | 146.8 | |
| 3/24/94 | 123 | 180 | 166.07 | 16.68 | 0.9744 | 128.4 | 144.7 | |
| 3/31/94 | 123 | 180 | 166.08 | 16.47 | 0.9753 | 128.8 | 144.5 | |
| 4/13/94 | 123 | 180 | 166.01 | 16.17 | 0.97535 | 129.5 | 144.9 | |
| 4/21/94 | 123 | 180 | 166.12 | 16.32 | 0.9752 | 129.2 | 145.9 | |
| 5/19/94 | 123 | 180 | 166.25 | 17.33 | 0.97624 | 127.1 | 144.5 | |
| SDA | 4/17/93 | 123 | 158.3 | 165.45 | 15.87 | 0.8824 | 129.6 | 146 |
| 5/20/93 | 123 | 158.3 | 164.17 | 15.37 | 0.8888 | 129.4 | 145.7 | |
| 7/8/93 | 123 | 158.3 | 163.97 | 15.39 | 0.8918 | 129.2 | 145.7 | |
| 7/27/93 | 123 | 158.3 | 163.66 | 14.79 | 0.8795 | 130.2 | 145.9 | |
| 7/29/93 | 123 | 158.3 | 163.85 | 15.15 | 0.8863 | 129.6 | 145.8 | |
| 9/18/93 | 123 | 158.3 | 163.92 | 15.13 | 0.9001 | 129.7 | 145.7 | |
| 10/21/93 | 123 | 158.3 | 164.18 | 15.33 | 0.8992 | 129.5 | 145.8 | |
| 3/31/94 | 123 | 158.3 | 164.31 | 15.5 | 0.8608 | 129.3 | 147.8 | |
| 4/13/94 | 123 | 158.3 | 164.06 | 15.31 | 0.87022 | 129.4 | 147.1 | |
| 4/21/94 | 123 | 158.3 | 164.27 | 15.57 | 0.8621 | 129.1 | 147.7 | |
| 5/19/94 | 123 | 158.3 | 164.4 | 15.62 | 0.8656 | 129.1 | 147.8 |
At sites 8 and 19, the geophysical log analysis suggests that there is saline water (chloride >500 mg/L) perched on clay layers in the profiles with fresher water below; this is not reflected in table C6. The perched saline water in the log profile for site 19 is at a depth of about 70 ft and is marked, while that at site 8 is much less pronounced. Site 19 is within an oil field suggesting the possibility of past brine contamination from the surface that infiltrated and now remains as diluted saltwater resting on a clay, whereas site 8 is not within an oil field.
Young et al. (1993) commented on the apparent stability of the transition zone compared to the substantial changes in head and water level during 1993. Although consideration of the 1994 data and the extended calculation of additional transition zone parameters show slightly more movement, the original observation is generally still valid. Water-level changes in many areas have been several feet, but very few of the 100 mS/m saltwater interface elevations change by as much as a foot. The estimated 500 mg/L chloride elevations fluctuated more than the 100 mS/m elevations, but commonly not by more than about two feet, and changes at this low concentration reflect very minor changes in the overall saltwater pattern. These observations are consistent with the calculation that total salt inventories did not change by more than one percent at any of the sites where they could be calculated (OFR 94-28b).
No definite trends or correlations have been observed. However, at sites near discharge zones one or both of the 100 mS/m conductivity and 500 mg/L chloride concentration elevations tended to drop. At site 16, where the Permian head rose more than the shallow aquifer and deep aquifer heads, both the 500 mg/L and the 100 mS/m elevations rose. Overall, the substantial changes in head and water level were not matched by transition zone changes, indicating that the saltwater content and its interface is a more stable and slowly varying feature of the hydrologic system than is the freshwater inventory or the local heads.
The monitoring wells at the Siefkes intensive study site showed evidence of continued recovery following installation in April 1993. The wells were drilled with low-conductance drilling fluids, and although they were developed after installation, the steady rise in conductivity (based on the 100 mS/m elevation) following installation indicates that the ambient ground water was gradually flushing away residual drilling fluid. However, changes apparently related to pumping began to be observed on EM logs later in 1993. Changes in water conductivity in the Permian monitoring well are reflected in corresponding changes in the estimated position of the 500 mg/L elevation as determined by curve fitting. Detailed analysis of these changes is in progress.
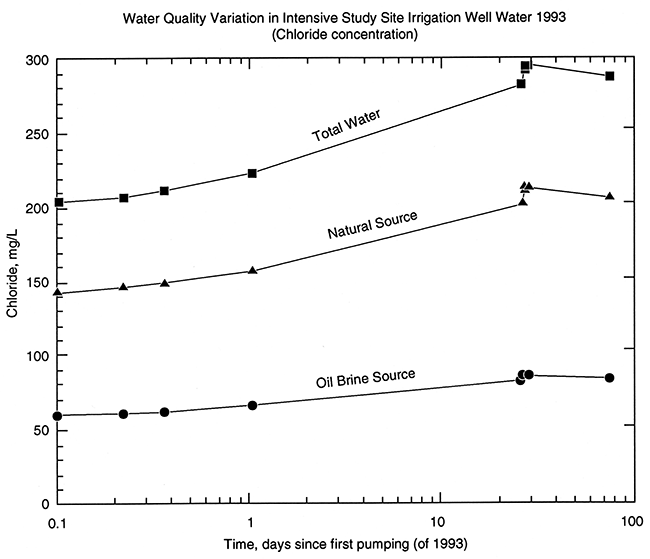
Water samples from the irrigation well were collected and analyzed during the abbreviated 1993 pumping season. Site information and analytical results are listed in tables C3 and C4, respectively. In spite of limited pumping, deterioration of water quality was noted. Earlier results (Buddemeier et al., 1993) indicated that the saline water appearing in the Siefkes irrigation well was a mixture of natural Permian formation brine and oil-field brine contamination. The method of Whittemore (1988) was used to distinguish the relative proportions of the two components and their variations over the 1993 pumping season. These results are illustrated in figure C8, which shows that the natural salt content increased at a greater rate with pumping than did that from oil-brine contamination.
Figure C8--Change in well-water salinity and the sources of salinity as a result of irrigation pumping.
Similar determinations are being made for the 1994 pumping season (table C3). The first sample collected from the Siefkes irrigation well in 1994 contained a chloride concentration appreciably lower (135 mg/L) than the first sample collected during 1993. The irrigation well had been pumping longer before the first sample was collected in 1993 than in 1994 and thus had apparently caused more upconing of natural saline water.
The second 1994 sample was collected a day later and contained essentially the same chloride concentration as the first 1993 sample. The results indicate that the salinity rises appreciably even after the first pumping of a season. Also, the low salinity of the initial sample for 1994 shows that the water quality appeared to recover to at least as good as probably existed at the start of the 1993 irrigation season. Other observation, stock, and irrigation wells are being monitored periodically to compare salinity variations with those observed in the Siefkes irrigation well. Well information and analytical results through May 1994 are listed in tables C3 and C4, respectively.
Since the total saturated thickness of the alluvial aquifer (difference in elevation between bedrock and water table) is known at each site, it is possible to calculate the proportion of saturated thickness above and below the 500 mg/L chloride concentration elevation (based on the fitted curves) for each of the saline transition zone sites. Ground water below this elevation is not considered suitable for human consumption and is generally unsuitable for irrigation.
The 1994 saturated thickness values and the percent of water below the 500 mg/L chloride elevation are tabulated in table C7. The percent of the total alluvial-aquifer saturated thickness that is below the 500 mg/L elevation ranges from 0 to 95% at these sites. The spatial pattern of the saltwater saturated thickness in the alluvial aquifer is shown in figure C9. It seems clear that saltwater intrusion is a regional phenomenon in the vicinity of the study transect in northern Stafford County. Also, the area in northeastern Pratt County and along the Stafford-Reno county line appears to be a region of consistent deep aquifer salinity. We have contoured the percent of saturated thickness occupied by high-salinity water (chloride concentration > 500 mg/L) using 40% of total saturation occupied by salt water as the cutoff for contouring. The salt-affected sites are indicated by individual percentages.
Figure C9--Percent of saturated thickness occupied by salt water (Cl > 500 mg/L) in the Great Bend Prairie aquifer (1994).
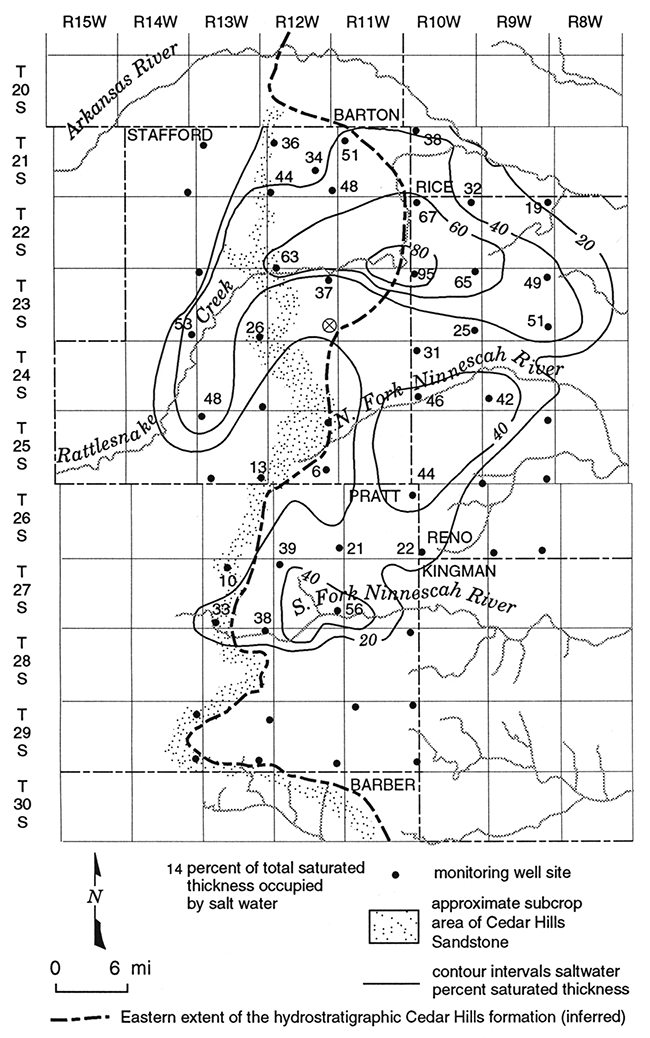
Table C7--Saturated thicknesses above and below the 500 mg/L elevation (1994).
| Site | Sat Thick Above |
Sat Thick Below |
Tot Sat Thick |
Percent Below |
|---|---|---|---|---|
| 1 | 87.8 | 51.9 | 139.7 | 37.2 |
| 3 | 81.3 | 28.2 | 109.5 | 25.7 |
| 4 | 57.3 | 63.9 | 121.1 | 52.7 |
| 5 | 66.8 | 112.1 | 178.9 | 62.7 |
| 6 | 69 | 63.6 | 132.6 | 47.9 |
| 8 | 100.1 | 0 | 100.1 | 0 |
| 9 | 42.1 | 35.6 | 77.6 | 45.8 |
| 10 | 97.2 | 45 | 142.3 | 31.6 |
| 11 | 65 | 131.6 | 196.6 | 66.9 |
| 16 | 119.5 | 92.9 | 212.4 | 43.7 |
| 17 | 54.1 | 49.3 | 103.5 | 47.7 |
| 18 | 99.5 | 103 | 202.5 | 50.9 |
| 19 | 131.8 | 19.5 | 151.3 | 12.9 |
| 21 | 64.3 | 49.6 | 113.9 | 43.6 |
| 22 | 129.6 | 72.7 | 202.3 | 35.9 |
| 23 | 44.3 | 27.3 | 71.6 | 38.1 |
| 24 | 67.1 | 32 | 99.1 | 32.3 |
| 25 | 4.4 | 87.5 | 92 | 95.2 |
| 26 | 58.4 | 109.8 | 168.2 | 65.3 |
| 27 | 47.6 | 45.2 | 92.8 | 48.7 |
| 29 | 67.1 | 47.9 | 115 | 41.6 |
| 30 | 91 | 29.8 | 120.8 | 24.7 |
| 31 | 63.3 | 14.7 | 77.9 | 18.8 |
| 32 | 80 | 82.9 | 162.9 | 50.9 |
| 33 | 102.2 | 6.6 | 108.8 | 6.1 |
| 35 | 104.9 | 29.7 | 134.6 | 22 |
| 36 | 101.6 | 65.6 | 167.2 | 39.2 |
| 37 | 164.3 | 18.6 | 182.9 | 10.2 |
| 38 | 129 | 34.2 | 163.2 | 21 |
| 39 | 51.9 | 0 | 51.9 | 0 |
| 42 | 90.7 | 56.3 | 147 | 38.3 |
| 43 | 40 | 19.9 | 59.9 | 33.2 |
| 49 | 46 | 58 | 104 | 56 |
| SP | 114.1 | 58.9 | 173 | 34.1 |
Figure C10 shows current (1994) estimates of the freshwater saturated thickness at the monitoring well sites. These are based on the saturated thickness above the 500 mg/L chloride elevation at each site. Critical areas of less than 60 ft and less than 80 ft of saturated thickness are shaded in figure C10.
Figure C10--Saturated thickness occupied by fresh water (Cl < 500 mg/L) in the Great Bend Prairie aquifer (1994).
The implications of these findings for consideration of the saltwater and freshwater budgets and their controlling factors are discussed in OFR 94-28e, and preliminary comments on relevance to eventual considerations of monitoring and management strategies are presented in OFR 94-28g.
Buddemeier, R. W., G. Garneau, J. M. Healey, T.-S. Ma, M. A. Sophocleous, D. O. Whittemore, D. Young and D. Zehr, 1993. The Mineral Intrusion Project: report of progress during fiscal year 1993: Kansas Geological Survey, Open-File Report 93-23, 53 pp plus appendices.
Fader, R. W., and L. E. Stullken, 1978. Geohydrology of the Great Bend Prairie, south-central Kansas: Kansas Geological Survey, Irrigation Series 4, 19 pp. [available online]
Whittemore, D.O., 1993. Ground-water geochemistry in the mineral intrusion area of Groundwater Management District No. 5, south-central Kansas: Kansas Geological Survey Open-File Report 93-2.
Whittemore, D.O., 1988. Bromide as a tracer in ground-water studies: Geochemistry and analytical determination: Proceedings Ground Water Geochemistry Conference, National Water Well Assoc., Dublin, OH, p. 339-360.
Young, D. P., G. W. Garneau, R. W. Buddemeier, D. Zehr, and J. Lanterman, 1993. Elevation and variability of the freshwater-saltwater interface in the Great Bend Prairie aquifer, south-central Kansas: Kansas Geological Survey, Open-File Report 93-55.
Next page: Appendices
Kansas Geological Survey, Geohydrology
Placed online Feb. 23, 2016; originally released Dec., 1994
Comments to webadmin@kgs.ku.edu
The URL for this page is http://www.kgs.ku.edu/Hydro/Publications/1994/OFR94_28c/index.html