Kansas Geological Survey, Open-file Report 1994-10
a report for the Kansas Corporation Commission
KGS Open File Report 1994-10
February, 1994
The complete report is available as an Adobe Acrobat PDF file (100 kB).
The Kansas Corporation Commission (KCC) found saline waters in the shallow subsurface in the area of the Meats and Beard oil-field leases near Le Roy, Coffey County. The Meats scar is primarily within SW SW sec. 1 and the Beard scar mainly in the NW corner of sec. 12, T. 23 S., R. 16 E. The sites overlie alluvium of the Neosho River valley on the east side of the river. The area is well within the band of alluvium as delineated in the state geologic map suggesting that naturally saline water from the bedrock is not a probable source. The bedrock underlying the alluvium and forming the valley wall over two miles to the northeast comprises shale and sandstone of the Pennsylvanian Douglas Group. Most probable sources of shallow salinity are concentration of dissolved solids by evapotranspiration (combined evaporation and plant transpiration) and oil-field brine. Many oil wells exist in the vicinity and produce from the "Squirrel sand" in the upper part of the Cabaniss Formation near the top of the Cherokee Group at depths of approximately 960-975 ft. Enhanced recovery of oil by waterflooding started in 1965 on the Pinon lease north of the Beard lease, in 1969 on the Beard lease, and in 1974 on the Meats lease. Waterflooding on the Pinon lease has involved adding water from a supply well in the Kansas City Group to the produced saltwater; the other leases use the water produced with the oil as the waterflood supply.
The KCC requested the assistance of the Kansas Geological Survey (KGS) in identifying the source(s) of saltwater. The KCC collected a water sample from a borehole augered into a surface salt scar on each of the two leases. The two salt scars are about 0.5 mile apart. The saline water sample from the Beard lease is designated as BE1 (Table 1) and was obtained from a 4 ft deep borehole in clay loam at a naturally low-lying area. The KCC also collected a sample (BE2) from a borehole augered in a soybean field at a location about 150 ft south of and a surface elevation approximately 1.5-2 ft higher than for borehole BE1. The saline water (ML1) from the Meats lease was collected from a 2 ft borehole in silty loam. Sample ML2 was obtained from a borehole in silty loam about 200 ft upslope of ML1. The samples were sent along with an oil-field brine sampled from the saltwater tank on the Meats lease. The saltwater in the tank is a mixture of brines produced from many oil wells on the lease in the W/2 SW sec. 1, T. 23S., R. 16 E.
The KGS determined the saltwater source using the geochemical methods of Whittemore (1984, 1988). The procedure involved measuring the specific conductance, and chloride, sulfate, and bromide concentrations in the samples and identifying the salinity source based on constituent ratios and mixing curve graphs.
Table 1--Location and constituent concentrations and ratios for water samples from the site area.
| Sample description |
Sample location | KGS Lab No. |
Sp. C. µS/cm |
Cl mg/L |
SO4 mg/L |
Br mg/L |
Br/Cl x 104 |
SO4/Cl |
|---|---|---|---|---|---|---|---|---|
| Borehole BE1, 4 ft deep |
23S-16E-12ABBB | 930658 | 7960 | 2470 | 377 | 8.11 | 32.83 | 0.1526 |
| Borehole BE2 5 ft deep |
23S-16E-12ABBB | 930658 | 2700 | 557 | 179 | 1.10 | 19.75 | 0.3214 |
| Borehole ML1 2 ft deep |
23-16E-01CCBD | 930658 | 8560 | 2880 | 36.7 | 10.5 | 36.46 | 0.0127 |
| Borehole ML2 3 ft deep |
23-16E-01CCBA | 930658 | 950 | 47.1 | 59.1 | 0.18 | 38.22 | 1.255 |
| Produced oil brine* |
23S-16E-01C | 930658 | 86000 | 363330 | <5 | 132 | 36.33 | <0.0002 |
| * Collected from the brine tank located at 235-16E-01CBC which receives saltwater produced from oil wells in 235-16E-01CB and 235-16E-01CC. |
||||||||
The samples received by the KGS were filtered through 0.45 µm membrane filter paper before analysis. Chloride, sulfate, and bromide, concentrations were determined using automated colorimetric methods on a Technicon AutoAnalyzer II, except for sulfate in the oil brine which was measured using a turbidimetric method. The inorganic iodine concentration was also determined in the samples and used to correct the bromide values for the iodide response appearing as apparent bromide. The estimated maximum errors in the chloride and sulfate determinations are 3% and 4%, respectively. The estimated maximum error for the bromide measurements is 5% for the values >0.2 mg/L and 0.01 in the concentration for ML2.
The sample identification and chemical results for the samples are listed in Table 1. The chloride concentrations of the two borehole samples BE1 and ML1 from the surface salt scars contain comparable chloride concentrations. The chloride concentration of the upslope sample BE2 is appreciably higher than the upslope sample ML2. The sulfate concentrations for both the BE boreholes are substantially higher than the relatively low values for the ML boreholes.
The salinity sources were identified using constituent ratios and mixing curves on plots of bromide/chloride and sulfate/chloride mass ratios versus chloride concentration. The bromide/chloride plot (Figure 1) contains two pairs of mixing curves. Each curve is calculated from the conservative mixing of two end-member waters. Conservative mixing refers to the simple mixing of waters without chemical reactions, such as mineral precipitation or adsorption, that could alter the concentration of one or both of the constituents. Chloride and bromide are the two most conservative inorganic constituents in natural waters.
Each pair of curves in Figure 1 represents a mixing zone between the fresh or low salinity borehole water from the Beard or Meats leases and the produced oil brine. The bromide/chloride ratios for the two saltwater end points for both pairs of curves are based on the maximum analytical error in the oil brine analysis and an additional 2% for possible natural variation in the oil brines in the area. The bromide/chloride ratios of the lower-chloride end points for the solid pair of curves were calculated from the analytical error plus 10% for the additional natural range possible in the ratio at the BE2 borehole area. A similar calculation was used for the bromide/chloride ratios of the end points at higher and lower ratios than for the ML2 point except that the additional possible range in the ratio in the ML sample area is approximated as 15%. The greater range in bromide/chloride ratios at lower than at higher chloride contents is expected because a small change in a constituent concentration gives a relatively larger change in the ratio than at higher concentrations.
Figure 1--Bromide/chloride mass ratio versus chloride concentration. Legend: B Beard lease; M Meats lease; O oil brine.
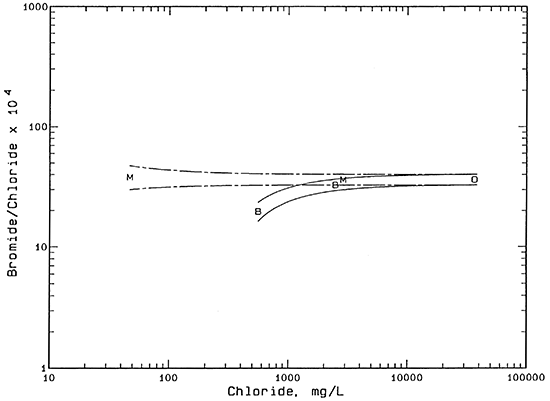
The mixing zones are drawn to test the hypothesis: do the saline borehole waters BE1 and ML1 fit the mixing of background waters BE2 and MU with oil brine. If the saline waters fit within the respective mixing zones, results are consistent with oil brine as the origin of salinity. As Figure 1 indicates, both of the points for the saline borehole waters fit within the respective mixing zones.
An alternative mechanism that can produce near surface salinity in soils is concentration of surface or soil water by evapotranspiration. If the surface salt scars at locations BE1 and ML1 have little or no vegetation, the main concentration process would be evaporation of surface water or soil moisture wicked upwards by capillary action. The bromide/chloride ratio remains constant as the dissolved solids are concentrated during water loss. No detectable fractionation would be expected to occur in the soil moisture unless appreciable amounts of the mineral halite (sodium chloride) were precipitated. The chloride concentration at which halite would start to precipitate is approximately 190,000 mg/L for the expected mean annual temperature of the shallow subsurface in Coffey County. The saline borehole waters are appreciably below this concentration.
Concentration by evapotranspiration could not be the sole origin of the BE1 saline water because the nearby water BE2 has an appreciably lower bromide/chloride ratio. Evapotranspiration concentration could be used as the major mechanism explaining the ML1 salinity based on Figure 1 alone because the bromide/chloride ratios of the ML1 and MU samples are relatively similar. However, the bromide/chloride ratio of ML1 matches the oil brine quite closely.
A plot of the sulfate/chloride mass ratio versus chloride concentration (Figure 2) for the water samples assists in distinguishing the relative importance of oil brine versus evapotranspiration as salinity origins. Sulfate/chloride ratios of oil-field brines in Kansas are generally much lower than for near-surface ground waters deriving salinity from evapotranspiration of fresher waters as indicated by the ratios in Table 1.
Figure 2--Sulfate/chloride mass ratio versus chloride concentration. Legend: B Beard lease; M Meats lease; O oil brine.
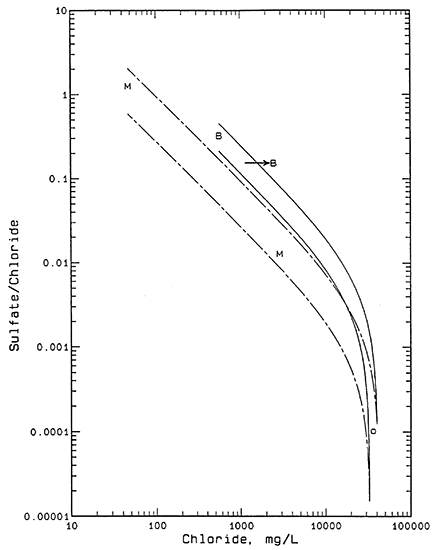
Each pair of curves in Figure 2 represents a mixing zone as described above for Figure 1. The sulfate/chloride ratios for the two saltwater end points for both pairs of curves are based on sulfate concentrations of 1 and 10 mg/L and +10% of the chloride concentration of the oil brine. The sulfate/chloride ratios of the lower-chloride end points for the solid pair of curves were calculated from the analytical error plus 30% for the additional natural range possible in the ratio at the BE2 borehole area. A similar calculation was used for the bromide/chloride ratios of the end points at higher and lower ratios than for the ML2 point except that the additional possible range in the ratio in the ML sample area is approximated as 50%. The greater range in sulfate/chloride ratios at lower than at higher chloride concentrations is expected for the same reason as for the bromide/chloride ratios. The greater range in sulfate/chloride ratios at lower chloride concentrations than for bromide/chloride ratios at similar chloride values is expected because the natural range in sulfate/chloride ratios is greater than for bromide/chloride; for example, compare the orders of magnitude in the ratio axes on Figures 1 and 2.
Figure 2 indicates that the point for water ML1 is consistent with the hypothesis of mixing of fresh ML2 water and oil brine because the point for ML1 fits within the dashed-line mixing zone. The combination of both the bromide/chloride and sulfate/chloride relationships with chloride content for ML1 water strongly indicate that oil brine is the primary source of salinity and evapotranspiration concentration is not a significant factor.
Figure 2 shows that sample BE1 does not fit the hypothesis of oil brine mixing with water BE2 as the sole origin of the water chemistry because the point does not fit within the solid-line mixing zone. However, the sulfate/chloride ratio of water BE1 is substantially lower than that of BE2 indicating that evaporation or evapotranspiration alone could not produce the salinity. The sulfate content of water BE1 is also too low for a decrease in the sulfate/chloride ratio to have occurred as a result of fractionation from precipitation of gypsum. The sulfate content would have to be well over 2,000 mg/L before gypsum could precipitate in the soil. The horizontal arrow in Figure 2 suggests a mechanism for the salinity origin. If oil brine leaked or was disposed at or near the surface and flowed to the location of sample BE1 and mixed with water similar to sample BE2, the resultant mixture would be expected to plot near the left end of the horizontal arrow. The oil-brine contaminated water at the surface and in the soil at the low area around BE1 could then be concentrated by evapotranspiration; the sulfate and chloride concentrations would both increase while the ratio remained the same as indicated by the arrow direction to the point for BE1.
In order for the combined mechanism for the salinity origin of water BE1 to be consistent with the bromide/chloride relationship in Figure 1, i.e., for a similar horizontal arrow to be drawn to the point for BE1 and still have the left end of the arrow fall within the bromide/chloride mixing zone with solid curves, the evapotranspiration concentration factor could not exceed a value of 2. The combined bromide/chloride and sulfate/chloride relationships suggest that oil brine could have increased the chloride concentration of water from BE2 (557 mg/L) by a factor of about 2-3 to within the range 1,200-1,600 mg/L. Evaporation or evapotranspiration could have further increased the salinity by a factor of approximately 1.5-2 times to give the observed chloride concentration of 2,470 mg/L.
If the sample from borehole ML2 is generally representative of the water expected in the alluvial soils, a mechanism similar to that described above for the salinity origin of water BE1 could be invoked for the moderate chloride content of sample BE2. A horizontal arrow drawn from within the mixing zone for MU, ML1, and oil brine to the point for BE2 would help indicate this mechanism. Oil brine contamination from a nearby well could have increased the chloride concentration from background similar to the 47 mg/L for ML2 by a factor of about 2-7 to within the range 100-300 mg/L. Evapotranspiration within the soil at site BE2 could then have increased the salinity by a factor within approximately 2-6 to give the observed value of 557 mg/L.
Correspondingly, if oil brine contaminated a water similar in composition to ML2 to give a chloride content of 200-600 mg/L (an increase of approximately 4-13 times the background chloride content of 47 mg/L), and evapotranspiration concentrated the contaminated water by a factor of about 4-12 times, the chloride concentration of BE1 could be produced. This last case could be further illustrated by extending the horizontal arrow drawn on Figure 2 to the left to within the mixing zone delineated by the two dashed curves. Figure 2 could then be depicted with only one mixing zone (the dashed pair of mixing curves) and two horizontal arrows, one to sample BE1 and the other to BE2. If the maximum evapotranspiration concentration factor of 12 were multiplied by the starting chloride of 47.1 mg/L of water ML2, the result would be 565 mg/L or less than one-fourth of the 2470 mg/L chloride dissolved in the BE1 borehole water. Therefore, in the mechanisms described in this and the preceding two paragraphs, oil brine contamination appears to have resulted in at least half of the BE1 sample salinity.
The source of salinity in the shallow ground water at the salt scar of the Meats lease is primarily oil brine similar in chemistry to the saltwater produced from oil wells in the study area. The saline water has not been significantly affected by concentration from evaporation or evapotranspiration.
At least half of the salinity of the shallow ground water at the surface salt scar of the Beard lease is derived from oil brine contamination. The oil-brine contaminated water has been appreciably concentrated by evaporation or evapotranspiration resulting in a further increase in the salinity. Evaporation or evapotranspiration concentration alone could not produce the chemistry of the water based on the background water quality. At least half of the chloride concentration of the BE2 water from the soybean field could have resulted from oil-brine contamination assuming a chemistry similar to the shallow ground water representing background on the Meats lease.
The report was conducted in cooperation with Mike Fletcher of Conservation Division District 3 of the Kansas Corporation Commission in Chanute, Kansas. Lawrence Hathaway, Chief of the Analytical Services Section of the Kansas Geological Survey, determined the specific conductance, chloride, and sulfate concentrations in the water samples.
Whittemore, D.O., 1984, Geochemical identification of salinity sources; in, Salinity in Watercourses and Reservoirs (Proceedings of the International Conference on State-of-the-Art Control of Salinity), R.H. French, ed.: Ann Arbor Science, Butterworth Publishers, Stoneham, Massachusetts, p. 505-514.
Whittemore, D.O., 1988, Bromide as a tracer in ground-water studies: Geochemistry and analytical determination: Proceedings Ground Water Geochemistry Conference, National Water Well Association, Dublin, Ohio, p. 339-360.
Kansas Geological Survey, Geohydrology
Placed online Nov. 19, 2013
Comments to webadmin@kgs.ku.edu
The URL for this page is http://www.kgs.ku.edu/Hydro/Publications/1994/OFR94_10/index.html