Kansas Geological Survey, Open-file Report 91-61
KGS Open File Report 91-61
December 31, 1991
Also available as an Acrobat PDF file.
Groundwater Management District No. 5 (GMD5) in south-central Kansas in cooperation with the Kansas Geological Survey (KGS) has operated an observation-well network in the Quaternary aquifer of the Great Bend Prairie. Most of the sites also include a well screened in the underlying Permian strata to examine relationships of hydraulic head and water chemistry to the overlying aquifer waters. Ground water at a shallow depth in the aquifer has increased in salinity in well 2 at site 2 (T. 23 S., R. 12 W., Sec. 36 ABAB) of the network. Network site 2 is to the southwest and within a few hundred feet of the R. Wendelberg house and farm buildings. The house well of Mr. Wendelberg yields water which is slightly saline and has been reported to be increasing in dissolved-solids content. This report addresses the question of the source of the salinity in the well waters.
Samples representative of the ground water were collected by KGS staff on December 4, 1991, by pumping waters from the two wells at site 2 of the GMD5 observation-well network. The samples were analyzed at the Kansas Geological Survey using procedures that give high-quality results. The charge-balance error for the two samples was <2%. The results were examined along with other data obtained from KGS analyses, including those for earlier samples from site 2 and other sites in the GMD5 network (Whittemore, et al., 1987), from research recharge site 6 of the KGS located a couple thousand feet to the southwest of network site 2 (Sophocleous et al., 1990), and from the R. Wendelberg house well and other nearby water-supply wells (Sophocleous et al., 1990; M. Townsend, personal communication). The identification procedure included the mixing-curve approach developed by Whittemore (1984, 1988).
Specific conductance and concentrations of chemical constituents in the site 2 and other nearby ground waters and a soil water are listed in Table 1. The waters from recharge site 6 listed are for samples collected before and approximately one year after the flooding experiment conducted in September, 1987.
Table 1--Quality Ground, Soil, and Stream Waters in the Vicinity of GMD5 Observation-Well Network Site 2. All concentrations are for dissolved constituents and are in mg/L. Ranges in silica and fluoride contents are 20-25 and 0.3-0.4 mg/L, respectively, for the site 2 well waters. If the silica concentration was not measured in a major constituent determination. a value of 24 mg/L. was assumed for the TDS calculation.
| Well description |
Depth, feet |
Sample date |
Sp. C.a µS |
TDSb | Ca | Mg | Na | K | HCO3 | SO4 | Cl | NO3 | Br |
|---|---|---|---|---|---|---|---|---|---|---|---|---|---|
| Site 2, well 1 | 104 | 10-26-1978 | 2450 | 1581 | 103 | 20 | 471 | 3.6 | 255 | 110 | 725 | 0.22 | |
| 3-01-1983 | 2630 | 1445 | 111 | 19 | 416 | 6.5 | 228 | 96 | 659 | 0.48 | 0.11 | ||
| 12-04-1991 | 3000 | 1652 | 121 | 19.5 | 479 | 5.3 | 255 | 128 | 148 | 0.2 | 0.17 | ||
| Site 2, well 2 | 38 | 10-25-1978 | 693 | 400 | 64 | 5.2 | 71 | 3.1 | 263 | 22 | 12 | 12.8 | |
| 1-14-1983 | 875 | 508 | 101 | 8.1 | 75 | 3.9 | 290 | 41 | 103 | 8.4 | |||
| 11-23-1983 | 900 | 94 | 7.9 | 87 | 3.3 | 290 | 34 | 105 | 24.8 | ||||
| 5-10-1984 | 920 | 37 | 109 | 26 | |||||||||
| 11-07-1984 | 1020 | 127 | 0.18 | ||||||||||
| 12-04-1991 | 1450 | 855 | 182 | 14.0 | 102 | 4.0 | 331 | 106 | 220 | 39 | 0.32 | ||
| R. Wendelbergc | 55-60d | 7-19-1989 | 1760 | 1058 | 237 | 19 | 116 | 4.5 | 359 | 135 | 291 | 55 | |
| 3-1990 | 51 | ||||||||||||
| Recharge site 6 | 20 | 6-22-1987 | 2450 | 1282 | 211 | 31 | 218 | 5.8 | 275 | 33 | 594 | 29 | |
| 8-06-1987 | 2450 | 619 | 0.60 | ||||||||||
| 5-04-1988 | 2845 | 1523 | 257 | 35 | 275 | 5.7 | 292 | 46 | 713 | 22 | 0.62 | ||
| 9-13-1988 | 3000 | 816 | 21 | 0.88 | |||||||||
| Recharge site 6 | 34 | 6-22-1987 | 1060 | 593 | 68 | 12 | 134 | 5.0 | 319 | 39 | 147 | 6.6 | |
| 8-06-1987 | 1030 | 133 | 0.19 | ||||||||||
| 5-04-1988 | 945 | 549 | 96 | 13 | 90 | 5.8 | 353 | 35 | 97 | 14 | 0.20 | ||
| 8-03-1988 | 950 | 548 | 98 | 13 | 91 | 6.0 | 346 | 34 | 97 | 14 | 0.10 | ||
| 9-13-1988 | 980 | 108 | 14 | 0.10 | |||||||||
| Recharge site 6 | 45 | 6-22-1987 | 870 | 495 | 67 | 7.1 | 113 | 3.6 | 291 | 26 | 110 | 0.8 | |
| 5-04-1988 | 860 | 477 | 60 | 7.0 | 110 | 3.8 | 282 | 25 | 108 | 0.5 | 0.16 | ||
| 8-03-1988 | 710 | 434 | 71 | 6.9 | 79 | 3.6 | 272 | 21 | 81 | 13 | 0.07 | ||
| Recharge site 6 | 54 | 6-22-1987 | 960 | 546 | 70 | 7.1 | 128 | 3.7 | 281 | 27 | 145 | 2.4 | |
| Irrigation SWe | 1-30-1989 | 1220 | 669 | 12 | 7.9 | 177 | 3.4 | 258 | 34 | 223 | 0.4 | ||
| Irrigation We | 66d | 1-30-1989 | 1050 | 582 | 71 | 7.0 | 141 | 3.5 | 241 | 30 | 187 | 0.1 | |
| A. Wendelberg | 1-30-1989 | 990 | 554 | 63 | 6.1 | 137 | 3.1 | 265 | 28 | 162 | <0.1 | ||
| Recharge site 6f | 6 | 8-03-1988 | 3850 | 178 | 388 | ||||||||
| Peace Creek, upstreamg | 9-16-1981 | 615 | 358 | 48 | 5.5 | 69 | 14 | 149 | 22 | 102 | 0.1 | ||
| Peace Creek, downstreamg | 9-16-1987 | 515 | 303 | 47 | 5.2 | 49 | 14 | 154 | 18 | 69 | 1.1 | ||
| a Specific conductance; µS is equivalent to µmho/cm at 25°C. b Total-dissoived solids c Well near house d Approximate depth e Irrigation wells located to the west and southwest of recharge site 6 f Lysimeter collecting soil water in the unsaturated zone g Peach Creek, upstream and downstream of recharge site 6 |
|||||||||||||
Freshwaters are often defined as having <1,000 mg/L of total-dissolved-solids (TDS), and a U.S. Geological Survey publication (Hem, 1985) classifies waters with 1,000-3,000 mg/L TDS as slightly saline. The TDS can measured by evaporating a water to dryness or calculated as the sum of dissolved constituents, after adjusting the bicarbonate concentration for carbon dioxide loss. The computed TDS values in Table 2 include an estimated silica concentration based on measurements for the site 2 well waters. [Note: no table 2 found in archived copy of report.] If a complete determination of the major constituents is not available, the TDS content can also be estimated by multiplying the specific conductance (SpC) in µS or µmho/cm by 0.57 for these waters. The TDS/SpC factor was calculated from the data in Table 1 and is the average for the waters; most of the values are in the range 0.55-0.60.
The computed or estimated TDS indicates that waters from 4 sampling locations listed in Table 2 are slightly saline based on the 1,000 mg/L classification value: well 1 of network site 2, which is screened in the Permian bedrock immediately below the unconsolidated sediments at the base of the aquifer; the shallowest well (20 feet deep) and the lysimeter (6 feet deep) at recharge site 6, and the Wendelberg house well. The salinity of the water from well 1 of network site 2 has fluctuated somewhat during the period of record, but is now approximately the same as in 1978. Dissolved constituents have increased during the same period in waters from well 2 of network site 2. Although the dissolved-solids concentration increased from 1987 to 1988 in waters from the 20-foot well at recharge site 6, it decreased in waters from the 34- and 45-foot wells at the same site.
The source of salinity in saline ground waters in the Permian bedrock underlying portions of the Great Bend Prairie aquifer is primarily dissolution of halite (rock salt) beds or cement in the sediments. The identification is based on the very low bromide/chloride ratio (0.00005-0.0002 for weight concentrations) which is typical of Permian salt deposits in Kansas. Some gypsum or anhydrite accompanies the halite cement and contributes sulfate to the ground waters in the Permian upon dissolution. Saline water in the Permian then can flow into the base of the Quaternary aquifer, and then disperse in a down-gradient flow direction to give less saline waters higher in the aquifer.
Most of the waters collected from the GMD5 observation-well network fall in a relatively narrow band on a plot of bromide/chloride ratio versus chloride concentration. The mixing curve passing through the center of the band is shown as a solid line in Figure 1. The curve represents the mixing of the freshest ground waters in the aquifer with saltwaters from the Permian bedrock. The curve is based on calculations assuming conservative mixing between the low-chloride and high-chloride end points. Bromide and chloride are conservative constituents (essentially unaffected by precipitation. oxidation-reduction, and adsorption processes) in ground waters. Points for water samples departing appreciably from the mixing line generally indicate a source or factor additional to simple mixing with halite solution that affects the chloride and bromide concentrations.
Figure 1--Bromide/Chloride Weight Ratio Versus Chloride Concentration. Numbers 1 and 2 are for shallow and deep wells, respectively, at network site 2; letters A, B, and C are for 20-, 34-, and 45-foot wells, respectively, at recharge site 6.
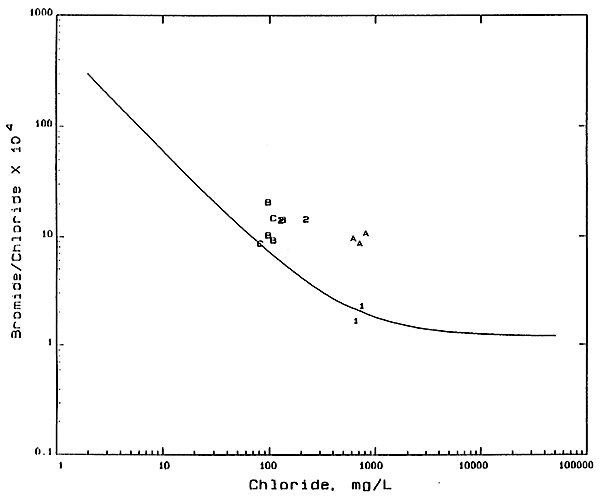
Water samples from well 1 in the Permian bedrock at network site 2 have low bromide/chloride ratios and plot very near to the mixing curve on Figure 1, indicating the predominant source of chloride is halite solution. Points for the samples from well 2 at site 2 fall above the mixing curve, suggesting that an additional source or process has affected the chloride concentration. Data for samples from the wells at recharge site 6 plot on the mixing curve to above the mixing curve. The two processes that best explain the departure of the points from the curve are (1) mixing of a water with a higher bromide/chloride ratio and a higher chloride concentration with the natural waters, and (2) the concentration of the natural water by evapotranspiration. Oil-field brine is the most common example of a water with a higher bromide/chloride ratio in the first process. In addition. the first process could be related to the infiltration of waters dissolving substances added on or in the soil. The second process would increase the chloride concentration without appreciably affecting the bromide/chloride ratio. The nearly constant bromide/chloride ratio for the well 2 samples and the lack of a known oil-brine source suggest that the latter process is predominant.
Tne chloride concentration of the two samples from well 2 at site 2 increased without a significant change in the bromide/chloride ratio. If the additional chloride in the 1991 sample for well 2 were from water from well 1, the bromide/chloride ratio would be appreciably lower and fall on a mixing curve that would be directed towards the points for well 1. Thus, the source of additional chloride in well 2 water is not caused by well l.
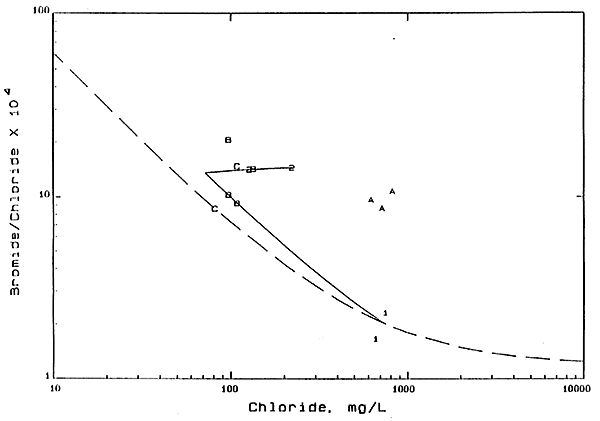
Figure 2 is an expanded portion of Figure 1 showing in more detail the location of the data on the graph. The average mixing curve for the GMD5 network is shown as a dashed line in Figure 2. The upper solid line on Figure 2 is the extrapolation of a mixing curve through the points for the well 2 waters of site 2 to the chloride concentration (72 mg/L) of the sample collected in 1978. The lower solid curve represents the mixing between the most probable position of the 1978 water from well 2 on Figure 2 with the average composition of the well 1 water. If well 1 was the main contribution to the increases in chloride in well 2, the most likely location of the well 2 points would be along the lower curve. However, this is clearly not the case. The source of salinity based on the bromide and chloride data appears to best fit the concentration of dissolved solids in soil waters or the precipitation of salts in soils by evapotranspiration, followed by leaching to the ground water.
Figure 2--Bromide/Chloride Weight Ratio Versus Chloride Concentration. Numbers 1 and 2 are for shallow and deep wells. respectively, at network site 2; letters A, B, and C are for 20-, 34-, and 45-foot wells, respectively, at recharge site 6.
The location of points on Figures 1 and 2 for the waters from the shallowest well at recharge site 6 to the southwest of network site 2 also indicate the importance of the evapotranspiration process. The chloride concentration for the 20-foot well is the highest of the 4 wells at the recharge site. Given the same sampling date, the dissolved-solids content of the waters decreases with depth from 20 feet to 45 feet, then increases slightly at 54 feet, This fits a source from the infiltration of dissolved solids concentrated in soil waters or leached from salts accumulated in the soil to the ground water, followed by dilution by fresher waters deeper in the aquifer. At even greater depths the influence of the Permian waters dispersing from below into the aquifer may explain the slight increase in dissolved solids in water from the 54-foot well.
Although not as conservative as bromide and chloride. sulfate is primarily affected by mixing or concentration processes in ground waters in Kansas. Most of the waters collected from the GMD5 observation-well network fall in a band of moderate width on a plot of sulfate/chloride ratio versus chloride concentration. The mixing curve passing through the center of the band is shown as a solid line in Figure 3. As in Figure 1, the curve represents the mixing of the freshest ground waters in the aquifer with saltwaters from the Permian bedrock. Sulfate/chloride ratios are generally lower in the Permian ground waters affected by evaporite mineral dissolution than in fresher ground waters in the area. Points for samples departing appreciably from the mixing line generally indicate a source or factor affecting the chloride and sulfate concentrations in addition to simple mixing of freshwater with evaporite mineral solutions.
Figure 3--Sulfite/Chloride Weight Ratio Versus Chloride Concentration. Numbers 1 and 2 are for shallow and deep wells. respectively, at network site 2; letters A, B, C, and D are for 20-, 34-, 45-, and 54-foot wells, respectively, at recharge site 6; W is for R. Wendelberg house well; X is for A. Wendelberg well; I is for irrigation wells to west and southwest of recharge site 6; P is for Peace Creek; S is for 6 foot lysimeter at recharge site 6.
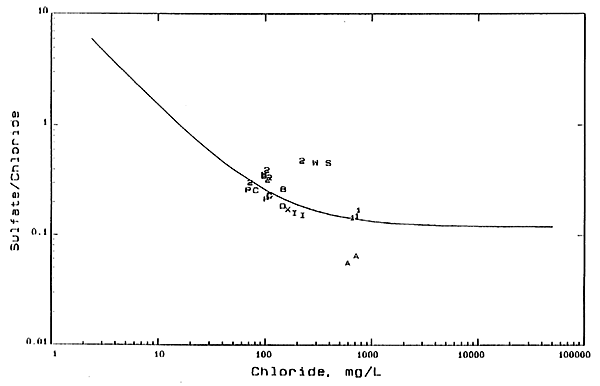
Points for all the samples from well 1 in the Permian bedrock at network site 2 plot on or very near to the mixing curve on Figure 3, fitting the evaporite solution source for Permian water. The point for the sample of well 2 water at site 2 collected in 1978 also falls on the mixing curve, indicating that the main chloride and sulfate source was the Permian water. PointS for the samples collected from 1983 to 1991 increasingly depart from the freshwater-Permian water mixing curve, suggesting that an additional source or process has affected the salinity of the waters. Oil-field brines in Kansas typically have a lower sulfate/chloride ratio than Permian saltwaters, thus oil brine does not fit the chemistry of the additional salinity source. Data for the R. Wendelberg well water plots appreciably above the mixing curve near the point for the 1991 well 2 sample. Data for samples from the 34-, 45-, and 54-foot wells at recharge site 6 fall relatively near the mixing curve, while points for the 20-foot well fall below the curve. Points for waters from other water-supply wells in the area and from Peace Creek lie slightly under the mixing curve.
Figure 4 is an expanded portion of Figure 3 showing in more detail the location of the data on the graph. As in Figure 2. the average mixing curve for the GMD5 network is shown as a dashed line in Figure 4. The upper solid line on Figure 4 is a mixing curve fitting the points for the well 2 waters of site 2 that is extrapolated to the chloride concentration of the R. Wendelberg well, The lower solid line is a mixing curve starting at the 1978 point for well 2, site 2, and passing through points for the 45- and 54-foot wells at recharge site 6 and for all of the water-supply wells in the area except the R. Wendelberg well. The samples from Peace Creek also fit this curve.
Figure 4--Sulfate/Chloride Weight Ratio Versus Chloride Concentration. Numbers 1 and 2 are for shallow and deep wells. respectively, at network site 2; letters A, B, C. and D are for 20-, 34-,45-, and 54-foot wells, respectively, at recharge site 6; W is for R. Wendelberg house well; X is for A. Wendelberg well; I is for irrigation wells to west and southwest of recharge site 6; P is for Peace Creek; S is for 6 foot lysimeter at recharge site 6.
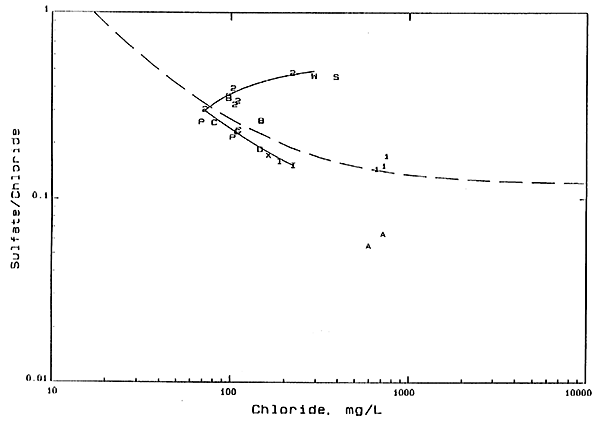
The lower solid curve on Figure 4 parallels the average mixing curve for the GMD5 network wells and represents the mixing of fresh waters with Permian water. The location of the curve slightly below the dashed line suggests that the average sulfate/chloride ratio of the Permian waters affecting the Quaternary aquifer waters at this location is somewhat lower than at site 2. This is not inconsistent with the dam for the GMD5 network because the lower solid curve lies within the band of points for the GMD5 network, and the location of the actual Permian waters that dispersed into the aquifer would be to the west of the study area. Also, ground water from the base of the Quaternary aquifer at GMD5 network site 3 a few miles to the west of site 2 has a sulfate/chloride ratio of 0.12 and a chloride concentration of 370 mg/L, which fits the extrapolation of the lower solid curve.
The sulfate/chloride ratio and the chloride concentration of the samples from well 2 at site 2 have increased with time. If the additional chloride in the samples for well 2 collected after 1978 were from water from well 1, the sulfate/chloride ratio would be appreciably lower and fall on a mixing curve between the point for the 1978 sample for well 2 and the points for well 1. This is not the case, corroborating the same conclusion derived from the bromide/chloride versus chloride graph, i.e., the source of additional chloride in well 2 water is not caused by well 1.
The extrapolated mixing curve fitting the site 2, well 2 waters (the upper solid line in Figure 4) suggests that there is a common source of increased salinity for this well and the R. Wendelberg house well. The relative increase in chloride for the well 2 samples is greater than the change in the sulfate/chloride ratio, indicating that the additional salinity is mainly from concentration of salts in soils followed by leaching and infiltration to the water table. Additional sources might include leaching of animal waste, soil amendments, and fertilizers as described later.
Concentration of water from irrigation wells in cropland to the west and southwest of site 2, of waste and garden water from the well at the R. Wendelberg buildings. and of liquid animal wastes at the Wendelberg farm could all be sources of additional salinity, If the soil water does not: become concentrated enough to precipitate chloride and sulfate salts. the sulfate/chloride ratio of the soil moisture should remain relatively constant. However, some salts are usually deposited in soils during very dry periods. When the salts are leached by meteoric precipitation or added well water, the chloride salts can be leached more rapidly than the sulfate salts due to their higher solubilities. This is probably the mechanism causing the lower sulfate/chloride ratios of the waters from the 20-foot well at recharge site 6. Salts remaining in the soil can have a higher sulfate/chloride ratio, as indicated by the soil water from the lysimeter at recharge site 6.
Points for the waters from the 34-foot well at the recharge site fall above the dashed mixing curve in Figure 4 and more closely resemble some of the waters from well 2, network site 2. Some of the added chloride in water at the 34-foot level below recharge site 6 may have been derived from concentration of irrigation water. However, leaching in the immediate vicinity of recharge site 6 may not represent the average leaching of salts from the soil across a larger area of the irrigated field, explaining the different ratios in the 20-foot well in comparison with the deeper wells. The low sulfate/chloride ratio for the 20-foot well water does indicate that the source of additional salinity in the area of site 2 and the R. Wendelberg well is not from the shallow ground water directly below the recharge site.
The increasing sulfate/chloride ratios of the waters from well 2, site 2, with time suggest that there might be an additional source of sulfate. If gypsum, sometimes used for soil treatment, or fertilizers containing sulfur have been used in the fields or gardens in the area, they might be considered as sources. The sulfate/chloride ratios of the animal waste and the house waste water for the area are not known, but would also have to be considered in explanations of the sulfate/chloride increase.
Nitrate concentrations in ground waters at network site 2 and recharge site 6 generally decrease with depth, from values of 10-40 mg/L at shallow depths, to < 1 mg/L in the Permian bedrock. This has also been observed for other well sites in the GMD5 observation-well network. The nitrate concentration in the R. Wendeiberg well water is even higher, in the 51-55 mg/L range (Table 2). Nitrate contents have increased with time in waters from well 2. site 2. The relatively high and increasing nitrate concentrations for well 2 at network site 2 and the high nitrate content for the R. Wendelberg house well suggest that fertilizer and/or animal and human wastes in the farm area are affecting the ground-water quality. The nitrate concentration of the 1991 sample from well 1, site 2 is as low as earlier samples, indicating that well 1 does not provide a pathway for detectable amounts of water to flow from shallow to deeper ground-water depths within the well.
The salinity of ground water from shallow well 2 in the Quaternary aquifer at site 2 of the GMD5 observation-well network has increased from 1978 to 1991. The chemistry of water from the Permian bedrock well 1 at the same site has not changed appreciably during the same time period. The source of the salinity in the Permian well 1 water is derived from evaporite mineral solution in Permian strata. The increase in the salinity in the waters from well 2 and the R. Wendelberg house well is not derived from the Permian well 1 water, but primarily from leaching of salts concentrated in soils by evapotranspiration processes and then leached to the ground water. Additional sources of salinity contribute to the well 2 and R. Wendelberg well waters. These sources could include leaching of fertilizers and animal and human wastes as suggested by the relatively high and increasing nitrate concentrations. The very low and unchanged nitrate concentration of the well 1 waters during 1978 to 1991 indicates that well 1 does not provide a pathway for detectable amounts of water to flow from shallow to deeper ground-water depths.
Sophocleous, M. A., Townsend. M.A., Orountiotis, C., Evanson. R.A., Whittemore, D.O., Watts, C.E., and Marks, E.T., 1990, Movement and aquifer-contamination potential of atrazine and inorganic chemicals in central Kansas croplands: Kansas Geol. Survey, Ground Water Series 12, 64 p. [available online]
Whittemore, D.O., 1984, Geochemical identification of salinity sources; in R.H. French (ed.), Salinity in Watercourses and Reservoirs (Proceedings of the International Conference on State-of-the-Art Control of Salinity) Ann Arbor Science, Butterworth Publishers, Stoneham, MA, p. 505-514.
Whittemore, D.O., 1988, Bromide as a tracer in ground-water studies: Geochemistry and analytical determination: Proceedings Ground Water Geochemistry Conference, National Water Well Assoc., Dublin, OH. p. 339-360.
Whittemore, D.O., McClain, T.1., Cobb, P.M., Davis, R.K., and Marks, E.T., 1987, Geochemistry of ground waters in the saline intrusion area of Groundwater Management District No. 5, south-central Kansas: prepared for Groundwater Management District No. 5.
Kansas Geological Survey, Geohydrology
Placed online Dec. 19, 2014; originally released Dec. 1991
Comments to webadmin@kgs.ku.edu
The URL for this page is http://www.kgs.ku.edu/Hydro/Publications/1991/OFR91_61/index.html