
Kansas Geological Survey, Open-file Report 80-15
Overview of Nitrates in Northeastern Kansas
by Jane Denne
Presented at Seminar on Nitrates in Kansas sponsored by the Kansas Department of Health and Environment, Topeka, Kansas
KGS Open File Report 80-15
May 15, 1980
The complete report is available as an Adobe Acrobat PDF file (604 kB).
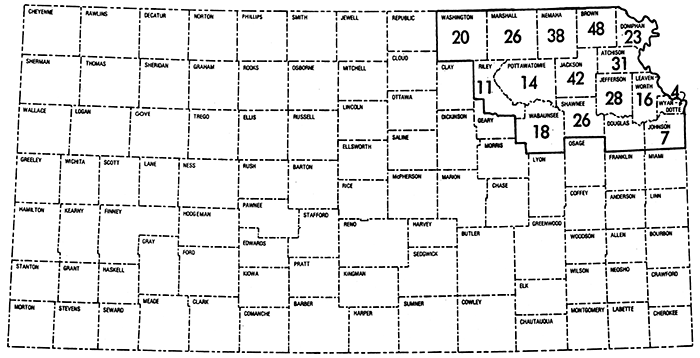
Historical water quality data for 15 counties in northeastern Kansas were obtained from the USGS files as part of an ongoing KGS-USGS cooperative program to evaluate groundwater resources available from glacial buried valley deposits. It was found that 312 of the 1,223 wells sampled in the region exceeded 45 mg/l nitrate, with one value of 1,080 mg/l, but all others below 600 mg/l. The percentage of wells having more than 45 mg/l nitrate ranged from 4% in Wyandotte County to 48% in Brown County (Fig. 1). Twenty percent or more of the wells in nine of the fifteen counties had excessive nitrate concentrations. In most counties, 40 to 80 wells were sampled; the range was from 28 in Wabaunsee County to 383 in Nemaha County.
Figure 1--Percentages of sampled wells having more than 45 mg/l nitrate (as NO3) by county in northeastern Kansas. Glacial buried valley study area enclosed within heavy black line. (No nitrate data were available for Douglas County).
The deepest well having more than 45 mg/l nitrate was 210 feet. Based on a histogram showing the number of wells with nitrate in excess of 45 mg/l and well depths, the median depth range was found to be 41 to 50 feet. In Nemaha County, the 147 wells having more than 45 mg/l nitrate appear to cluster around depths of approximately 30, 60, and 100 feet.
Approximately two-thirds of the wells in northeastern Kansas having more than 45 mg/l nitrate obtain water from Pleistocene deposits, with the majority being in glacial outwash and others in alluvium and terrace deposits and glacial till. Of the bedrock aquifers associated with high nitrate wells, formations in the Council Grove, Wabaunsee, and Shawnee Groups are the most common.
Maps showing the distribution of wells sampled with their nitrate and chloride concentrations, well depths, and aquifers were prepared for Nemaha, Brown, and eastern Marshall counties. This area was chosen because of the large percentages of high nitrate wells, the abundance of samples in Nemaha County, and the detailed hydrogeologic studies of glacial buried valleys. The high nitrate values may be natural and/or induced.
In interpreting the historical water quality information used in this study, it should be remembered that there are internal variations in the data base. Errors in recording sample data were observed. Collection and analysis procedures undoubtedly changed from the late 1930's to the mid-1970's, the time period represented by these samples. Some wells were sampled repeatedly, while others have only one analysis. The wells were not sampled at a consistent time of year. There is no indication of well construction, location of well with respect to pollution sources, use, or depth to water. Our continuing research will include investigation of high nitrate wells and their surroundings, and additional water quality samples will be obtained for the area.