Kansas Geological Survey, Open-file Report 2005-23
by
Choon B. Park and Richard D. Miller
KGS Open-file Report 2005-23
Final Report to
Barr Engineering Company
Minneapolis, MN
July 5, 2005
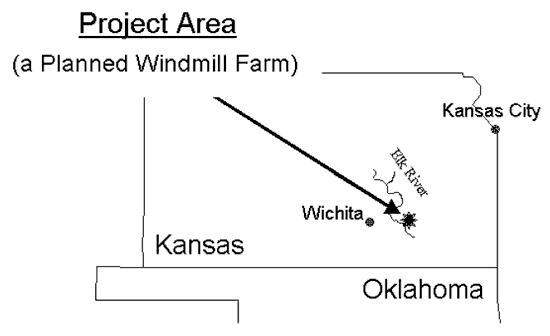
The multichannel analysis of surface waves (MASW) method (Park et al., 1999) was applied to selected turbine sites in a planned windmill farm (Figure 1) near Elk River in Elk County, Kansas, for seismic characterization of the upper 15 m or so of ground materials. The main purposes of the project were a) to evaluate ground stiffness as deduced from shear-wave velocity (Vs), and b) to estimate the potential existence of weak zones such as voids and fractured areas for the volume of ground materials defined by 100 ft (x-width) x 100 ft (y-width) x 50 ft (z-depth) volumes.
Figure 1. Location map of the project area where a windmill farm has been planned near Elk River in Elk County, Kansas.
Ten (10) sites were selected for the 1-D Vs evaluation that generated a profile showing Vs change with depth approximating the defined ground volume to be laterally homogeneous. Another ten (10) sites were selected for the 2-D Vs evaluation that generated 2-D Vs maps showing both lateral and vertical change in Vs. In addition, a unique surface-wave method was also applied to these 2-D sites to delineate subsurface anomalies by their surface (x and y) coordinates. This method is called "Side Scattering Analysis (SSA)" because its principles are based on the utilization of surface waves scattered from an anomaly sideways with respect to the seismic-survey lines. Multiple 2-D Vs maps were obtained because this SSA method required multiple seismic-survey lines deployed in a 2-D (x and y) format with data acquisition of each line identical to that for the 2-D Vs mapping. This increased the reliability and utility of the Vs evaluation provided by the redundant spatial sampling. Both 2-D Vs maps and SSA maps were used to interpret anomalies. As a supplementary tool a method called surface-wave imaging by attenuation (SIA) (Park et al., 1998a) was also used to interpret anomalies by applying this method to the same shot records used for 2-D Vs mapping.
For the interpretation of anomalies, any localized zone of anomalously low Vs in the 2-D Vs maps was first identified and then cross checked for possible back-scattering features on the corresponding seismic-shot records. Localized accumulations (or troughs) of amplitude in the SSA maps were also interpreted as potential anomalies. Effectiveness of SIA analysis to interpret anomalies was marginal.
The production seismic trip to the ten 1-D sites was made on March 28, 2005. These sites were T-003, T-012, T-024, T-031, T-054, T-058, T-060, T-065, T-071, and T-094. A testing survey was made during the final stage of this trip at T-065 to evaluate optimum acquisition parameters for the 2-D surveys that were to be conducted at another ten sites. The production seismic trip for the 2-D surveys was made from April 27 to April 29, 2005, at the following sites: T-001, T-010, T-017, T-040, T-046, T-060, T-064, T-065, T-066, and T-086. Vs in the area changed from about 100 m/sec within the uppermost 5-m depth range to about 1000 m/sec at a depth range of 10 m or more as indicated by both 1-D and 2-D Vs analyses (Tables 1-3). Within this range, however, each site showed different patterns of Vs variation in both vertical and lateral (for 2-D sites) directions.
A total of six (6) anomalies were interpreted as potential voids from the 2-D Vs and SSA analyses applied to the ten 2-D sites (Table 4). Final 2-D Vs, SSA, and SIA maps for all ten sites are presented with interpretations of voids in Appendices I, II, and III, respectively. The ten 2-D Vs maps were used to contour a bedrock-surface topography at each of the ten 2-D sites. Bedrock surface was seismically and somewhat arbitrarily defined by an interface where Vs exceeds 500 m/sec. Those interfaces were interpolated from the four 2-D Vs maps per each site and a display software (Surfer) was used to contour the topography in 3-D manner. They are presented in Appendix IV. In this report, each surveyed site is denoted by the assigned turbine-tower number. For example, the site of turbine-tower number 201 is denoted by T-201, and T-001 is the site of turbine-tower number 1. The fundamental mode of surface waves is to be denoted by M0, and higher modes are denoted by M1 (the first higher mode), M2 (the second higher mode), and so on.
Read the PDF version (2.2 MB)
Appendices 1, 2 and 3 as a PDF (3.1 MB)
Appendix 4 as a PDF (485 kB)
Kansas Geological Survey, Geophysics
Placed online July 13, 2006
Comments to webadmin@kgs.ku.edu
The URL for this page is http://www.kgs.ku.edu/Geophysics/OFR/2005/OFR05_23/index.html